Cited by 42

The DOI matches its Crossref record; 2 of the 2 references it cites were found in a registry or an index.

A self-directed Trojanbot-enzymatic nanobot in neutrobot for active target therapy of glioblastoma

Gao, Yuanyuan, Mao, Meng, Li, Yue, Xuan, Mingjun, Wu, Yingjie, He, Qiang·2025·Nature Communications

Overview

The claims and statistics of this paper haven’t been checked yet.

Run the check — free, no account needed. It reads the open-access text and checks the sources it cites.

A few free checks a day · papers already verified open instantly · results are public

Integrity signals

Registry

Crossref · 10.1038/s41467-025-60422-z

Cites

2 of 2 references verified0 citation errors · 0 not checkable

Statistics

Figures

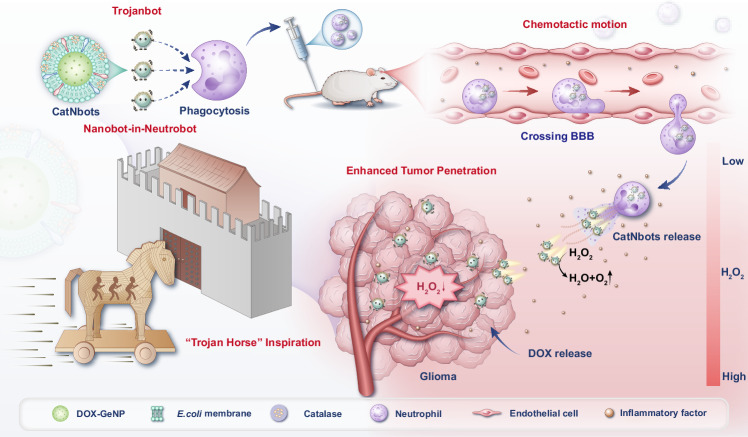
Fig. 1 Schematic illustration of the enzymatic nanobot-in-neutrobot system, inspired by the “Trojan Horse” strategy, which leverages neutrophil phagocytosis, chemotactic movement, BBB crossing, and the response of CatNbots to H2O2 in the TME to enhance the tumor penetration of DOX, thereby achieving targeted drug delivery to GBM.
Fig. 1 Schematic illustration of the enzymatic nanobot-in-neutrobot system, inspired by the “Trojan Horse” strategy, which leverages neutrophil phagocytosis, chemotactic movement, BBB crossing, and the response of CatNbots to H2O2 in the TME to enhance the tumor penetration of DOX, thereby achieving targeted drug delivery to GBM.CC BY-NC-ND · PubMed Central
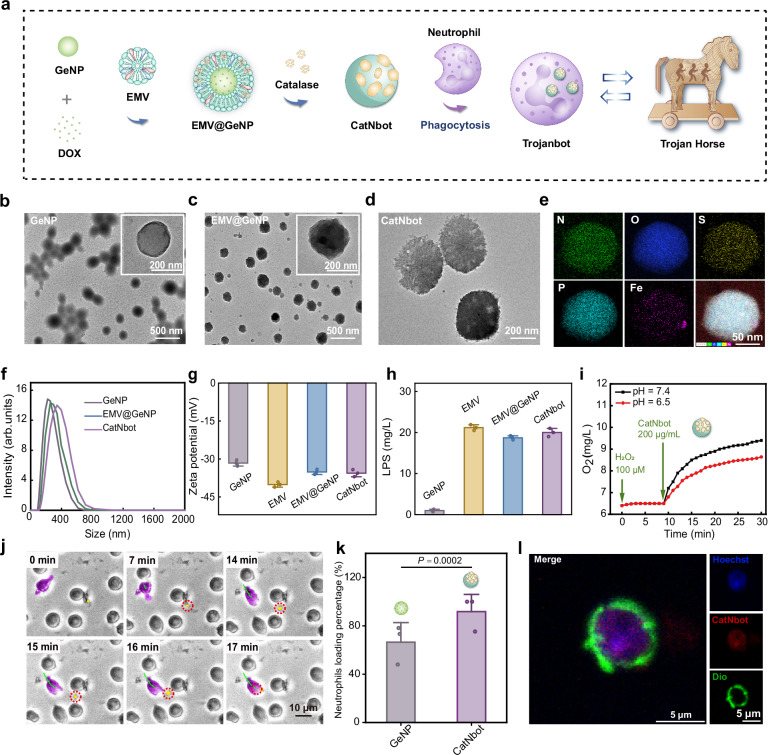
Fig. 2 Preparation and characterization of Trojanbots. a Schematic outlining the fabrication of the Trojanbots. b TEM images of GeNPs. Inset: Magnified TEM image of GeNPs. c TEM images of EMV@GeNPs. Inset: Magnified TEM image of EMV@GeNPs. d TEM image of CatNbots. e The mapping spectrum of CatNbot, Fe element indicates that catalase is successfully connected to EMV@GeNPs with random asymmetry. f DLS analyzes the particle diameter of GeNPs, EMV@GeNPs, and CatNbots. g Zeta potential values of GeNPs, EMVs, EMV@GeNPs, and CatNbots (n = 3). The Zeta analysis represented data obtained from three independent experiments. h LPS content of GeNPs, EMVs, EMV@GeNPs, and CatNbots (n = 3). The LPS content analysis represented data from three independent experiments. i Changes in the dissolved O2 level of the reaction medium treated with CatNbots under different pH conditions represent the enzymatic activity of CatNbots. j Movie snapshot capturing neutrophils undergoing phagocytosis of CatNbots. The trajectory of a representative neutrophil was depicted in green, while the typical neutrophil and CatNbot were marked in purple and yellow, respectively. k Quantitative analysis of neutrophil phagocytosis efficiency (n = 3). l The confocal laser scanning microscopy (CLSM) image of a Trojanbot. The nucleus of the neutrophil was stained with Hoechst 33342 (blue); the cell membrane of the neutrophil was stained with Dio (green), and the fluorescence of CatNbot was red. Data are presented as mean ± SD of three independent experiments (g, h, k). P-values are determined by a two-tailed Student’s t-test in (k). Source data are provided as a Source Data file.
Fig. 2 Preparation and characterization of Trojanbots. a Schematic outlining the fabrication of the Trojanbots. b TEM images of GeNPs. Inset: Magnified TEM image of GeNPs. c TEM images of EMV@GeNPs. Inset: Magnified TEM image of EMV@GeNPs. d TEM image of CatNbots. e The mapping spectrum of CatNbot, Fe element indicates that catalase is successfully connected to EMV@GeNPs with random asymmetry. f DLS analyzes the particle diameter of GeNPs, EMV@GeNPs, and CatNbots. g Zeta potential values of GeNPs, EMVs, EMV@GeNPs, and CatNbots (n = 3). The Zeta analysis represented data obtained from three independent experiments. h LPS content of GeNPs, EMVs, EMV@GeNPs, and CatNbots (n = 3). The LPS content analysis represented data from three independent experiments. i Changes in the dissolved O2 level of the reaction medium treated with CatNbots under different pH conditions represent the enzymatic activity of CatNbots. j Movie snapshot capturing neutrophils undergoing phagocytosis of CatNbots. The trajectory of a representative neutrophil was depicted in green, while the typical neutrophil and CatNbot were marked in purple and yellow, respectively. k Quantitative analysis of neutrophil phagocytosis efficiency (n = 3). l The confocal laser scanning microscopy (CLSM) image of a Trojanbot. The nucleus of the neutrophil was stained with Hoechst 33342 (blue); the cell membrane of the neutrophil was stained with Dio (green), and the fluorescence of CatNbot was red. Data are presented as mean ± SD of three independent experiments (g, h, k). P-values are determined by a two-tailed Student’s t-test in (k). Source data are provided as a Source Data file.CC BY-NC-ND · PubMed Central
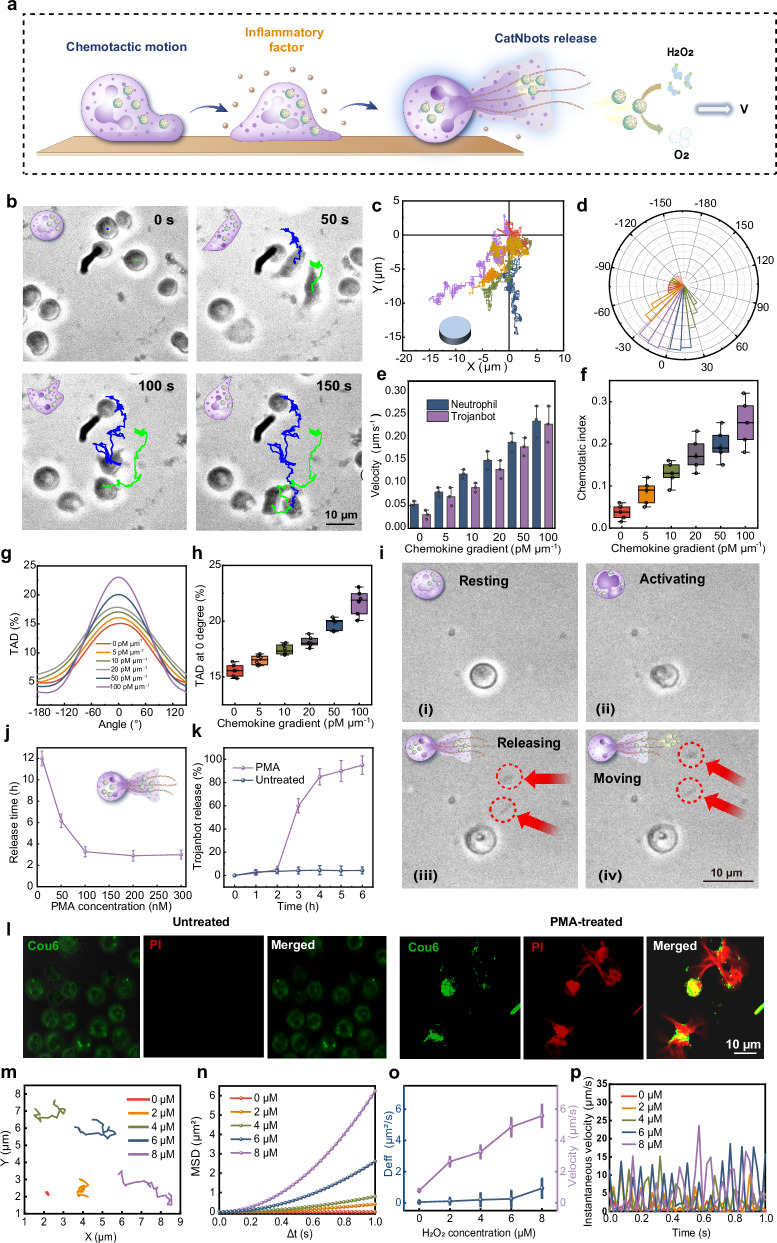
Fig. 3 Chemotactic motion of Trojanbots and the release of CatNbots. a Schematic illustration of the chemotactic motion of Trojanbots and the release of CatNbots under PMA stimulation, and the catalytic propulsion of CatNbots. b Time-lapse images of the chemotactic motion of Trojanbots along a chemokine gradient. c Trajectories (n = 7) and d direction distribution (n = 7) of Trojanbots in response to a fMLP gradient (10 pM µm−1). The duration of chemotactic motion is 10 min. e Dependence of chemotaxis velocity of neutrophils and Trojanbots on the chemokine gradient of fMLP (n = 3). f Dependence of CI (ratio of distance to path length) of Trojanbots on the chemokine gradient of fMLP (n = 6). The center line of the box plots represents the median, the box bounds indicate the 25th and 75th percentiles and the whiskers extend to the minimum and maximum values within the 1.5× interquartile range (IQR). Individual data points are overlaid. No outliers are present. g TAD of Trojanbots under chemokine gradient (n = 600). h TAD at 0° of Trojanbots under different gradients of fMLP (n = 6). The center line of the box plots represents the median, the box bounds indicate the 25th and 75th percentiles and the whiskers extend to the minimum and maximum values within 1.5× IQR. Individual data points are overlaid. No outliers are present. i Time-lapse images of CatNbots releasing process under PMA stimulation. The resting Trojanbots (i) were activated by PMA stimulation (ii), and the as-released CatNbots (iii) exhibited self-propelled motion in H2O2 solution (iv). j The effect of different concentrations of PMA on the release rate of Trojanbots (n = 3). k Dependence of Trojanbot release percentage on time with or without PMA (100 nM) stimulation. (n = 3). l CLSM images of CatNbots released from Trojanbots with (i) and without 100 nM PMA (h) after 8 h of in vitro culturing. The CatNbots were loaded with Cou6 (green), and the released DNA segments were stained with PI (red). m Representative tracking trajectories of the CatNbots (n = 20) in H2O2 solutions with different concentrations (0, 2, 4, 6, 8 µM) within 1 s. n MSD analysis (Δt = 1 s, n = 20) of CatNbots at different H2O2 concentrations (0, 2, 4, 6, and 8 µM). o The effective diffusion coefficient (Deff) (left) and self-propelled velocity of CatNbots (right) at different H2O2 concentrations (0, 2, 4, 6, and 8 µM) based on MSD. (n = 20). p The instantaneous velocity of CatNbots at different H2O2 concentrations (0, 2, 4, 6, and 8 µM) (n = 20). Data are presented as mean ± SD of three independent experiments (e, j, k), six independent experiments (f, g, h), seven independent experiments (c, d), and 20 independent experiments (o, p). Source data are provided as a Source Data file.
Fig. 3 Chemotactic motion of Trojanbots and the release of CatNbots. a Schematic illustration of the chemotactic motion of Trojanbots and the release of CatNbots under PMA stimulation, and the catalytic propulsion of CatNbots. b Time-lapse images of the chemotactic motion of Trojanbots along a chemokine gradient. c Trajectories (n = 7) and d direction distribution (n = 7) of Trojanbots in response to a fMLP gradient (10 pM µm−1). The duration of chemotactic motion is 10 min. e Dependence of chemotaxis velocity of neutrophils and Trojanbots on the chemokine gradient of fMLP (n = 3). f Dependence of CI (ratio of distance to path length) of Trojanbots on the chemokine gradient of fMLP (n = 6). The center line of the box plots represents the median, the box bounds indicate the 25th and 75th percentiles and the whiskers extend to the minimum and maximum values within the 1.5× interquartile range (IQR). Individual data points are overlaid. No outliers are present. g TAD of Trojanbots under chemokine gradient (n = 600). h TAD at 0° of Trojanbots under different gradients of fMLP (n = 6). The center line of the box plots represents the median, the box bounds indicate the 25th and 75th percentiles and the whiskers extend to the minimum and maximum values within 1.5× IQR. Individual data points are overlaid. No outliers are present. i Time-lapse images of CatNbots releasing process under PMA stimulation. The resting Trojanbots (i) were activated by PMA stimulation (ii), and the as-released CatNbots (iii) exhibited self-propelled motion in H2O2 solution (iv). j The effect of different concentrations of PMA on the release rate of Trojanbots (n = 3). k Dependence of Trojanbot release percentage on time with or without PMA (100 nM) stimulation. (n = 3). l CLSM images of CatNbots released from Trojanbots with (i) and without 100 nM PMA (h) after 8 h of in vitro culturing. The CatNbots were loaded with Cou6 (green), and the released DNA segments were stained with PI (red). m Representative tracking trajectories of the CatNbots (n = 20) in H2O2 solutions with different concentrations (0, 2, 4, 6, 8 µM) within 1 s. n MSD analysis (Δt = 1 s, n = 20) of CatNbots at different H2O2 concentrations (0, 2, 4, 6, and 8 µM). o The effective diffusion coefficient (Deff) (left) and self-propelled velocity of CatNbots (right) at different H2O2 concentrations (0, 2, 4, 6, and 8 µM) based on MSD. (n = 20). p The instantaneous velocity of CatNbots at different H2O2 concentrations (0, 2, 4, 6, and 8 µM) (n = 20). Data are presented as mean ± SD of three independent experiments (e, j, k), six independent experiments (f, g, h), seven independent experiments (c, d), and 20 independent experiments (o, p). Source data are provided as a Source Data file.CC BY-NC-ND · PubMed Central
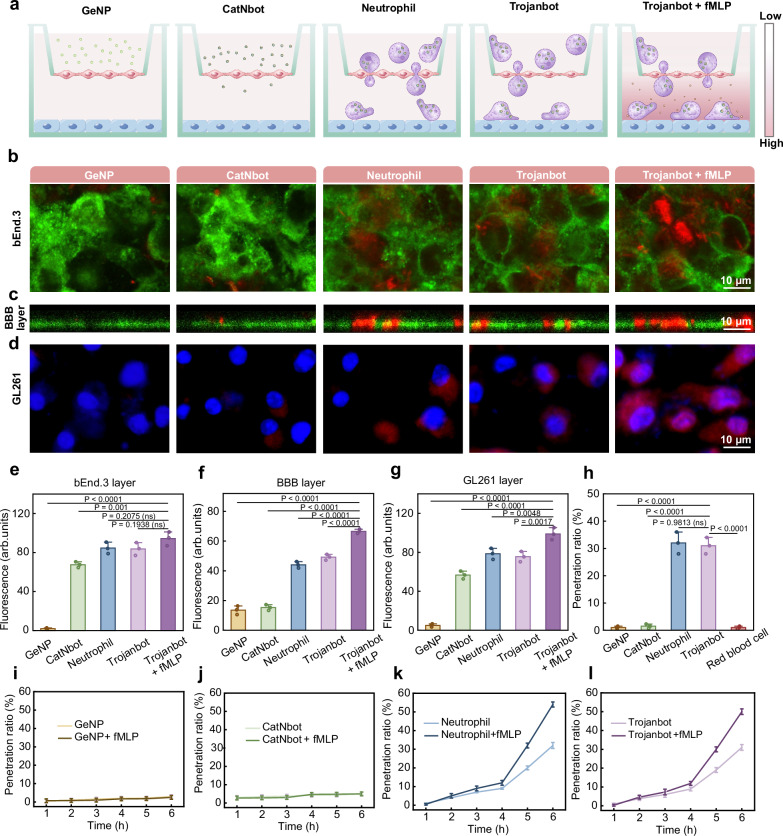
Fig. 4 BBB penetration ability of Trojanbots in vitro. a Schematic illustration of the in vitro BBB model used to evaluate the potential BBB penetration abilities of GeNPs, CatNbots, Neutrophils, and Trojanbots, both in the presence and absence of fMLP. b–d CLSM images of the bEnd.3 cell layer (b), BBB layer (c), and GL261 cells (d). In the images, bEnd.3 cells were labeled with Dio, while GeNPs, CatNbots, Neutrophils, and Trojanbots were labeled with Dil. The nuclei of the GL261 cells were stained with Hoechst 33342 (blue). e–g The fluorescence statistics of the bEnd.3 monolayer, BBB layer, and GL261 cells layer, respectively (n = 3) (exact P value of e: GeNP vs. Trojanbot + fMLP P = 1.51E−8; exact P value of f: GeNP vs. Trojanbot + fMLP P = 2E−10, CatNbot vs. Trojanbot + fMLP P = 3E−10, Neutrophil vs. Trojanbot + fMLP P = 9.666E−7, Trojanbot vs. Trojanbot + fMLP P = 1.17148E−5; exact P value of g: GeNP vs. Trojanbot + fMLP P = 4.2E−9, CatNbot vs. Trojanbot + fMLP P = 1.25964E−5.) h The penetration ratio of different groups for 6 h (n = 3). (exact P value: GeNP vs. Trojanbot + fMLP P = 1.484E−7, CatNbot vs. Trojanbot + fMLP P = 1.731E−7, Trojanbot vs. Trojanbot + fMLP P = 1.484E−7). i–l The time-dependent penetration ratios of GeNPs (i), CatNbots (j), Neutrophils (k), and Trojanbots (l) with and without fMLP (10 nM, n = 3). Data are presented as mean ± SD of three independent experiments (e–l). P-values are determined by one-way ANOVA and Tukey multiple comparisons tests in (e–h). Source data are provided as a Source Data file.
Fig. 4 BBB penetration ability of Trojanbots in vitro. a Schematic illustration of the in vitro BBB model used to evaluate the potential BBB penetration abilities of GeNPs, CatNbots, Neutrophils, and Trojanbots, both in the presence and absence of fMLP. b–d CLSM images of the bEnd.3 cell layer (b), BBB layer (c), and GL261 cells (d). In the images, bEnd.3 cells were labeled with Dio, while GeNPs, CatNbots, Neutrophils, and Trojanbots were labeled with Dil. The nuclei of the GL261 cells were stained with Hoechst 33342 (blue). e–g The fluorescence statistics of the bEnd.3 monolayer, BBB layer, and GL261 cells layer, respectively (n = 3) (exact P value of e: GeNP vs. Trojanbot + fMLP P = 1.51E−8; exact P value of f: GeNP vs. Trojanbot + fMLP P = 2E−10, CatNbot vs. Trojanbot + fMLP P = 3E−10, Neutrophil vs. Trojanbot + fMLP P = 9.666E−7, Trojanbot vs. Trojanbot + fMLP P = 1.17148E−5; exact P value of g: GeNP vs. Trojanbot + fMLP P = 4.2E−9, CatNbot vs. Trojanbot + fMLP P = 1.25964E−5.) h The penetration ratio of different groups for 6 h (n = 3). (exact P value: GeNP vs. Trojanbot + fMLP P = 1.484E−7, CatNbot vs. Trojanbot + fMLP P = 1.731E−7, Trojanbot vs. Trojanbot + fMLP P = 1.484E−7). i–l The time-dependent penetration ratios of GeNPs (i), CatNbots (j), Neutrophils (k), and Trojanbots (l) with and without fMLP (10 nM, n = 3). Data are presented as mean ± SD of three independent experiments (e–l). P-values are determined by one-way ANOVA and Tukey multiple comparisons tests in (e–h). Source data are provided as a Source Data file.CC BY-NC-ND · PubMed Central
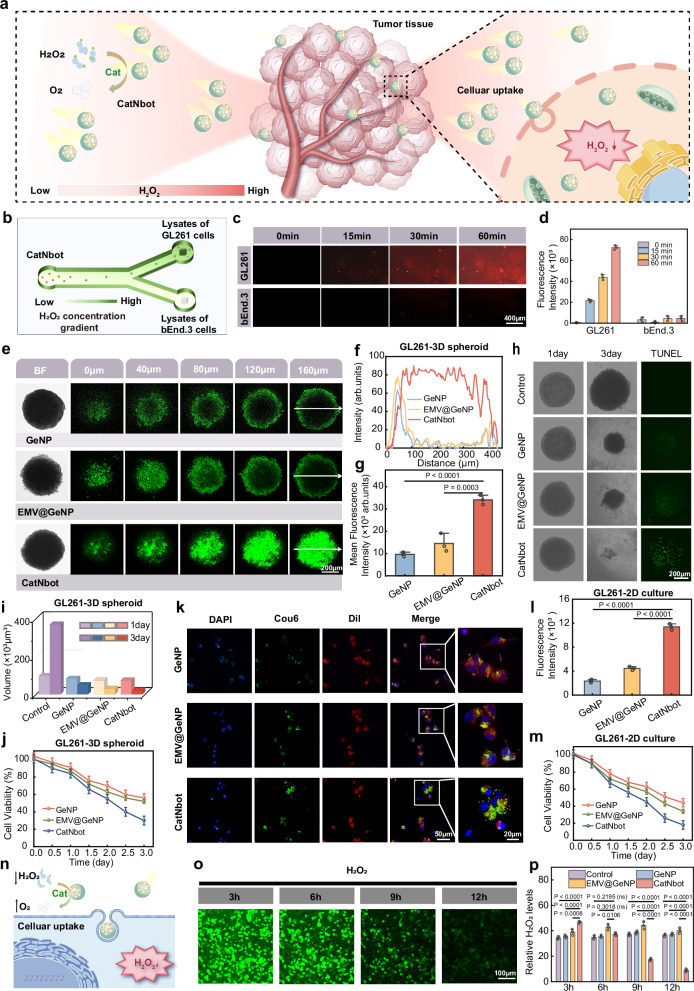
Fig. 5 Deep penetration of CatNbots into the tumor. a Schematic diagram of the chemotaxis of CatNbots toward tumor tissue and the internalization by tumor cells. b Schematic of chemotactic motion of CatNbots along the concentration gradient of the H2O2. c Fluorescent images of the different chambers. d The corresponding fluorescence quantification values at different time points (n = 3). e In vitro penetration results in 3D tumor spheroids. The bright-field images and Z-stack CLSM images were taken from the top to the equatorial plane in 160 µm thickness of 3D cellular spheroids after treatment with GeNPs, EMV@GeNPs, and CatNbots for 4 h. f The corresponding fluorescent spectra and g the mean fluorescence intensity of the GL261 tumor spheroids treated with different samples (n = 3) (exact P value: GeNP vs. CatNbot P = 8.16414E−5). h Tumor spheroid morphology and TUNEL apoptosis assay of GL261 3D spheroids treated with various groups for 3 days. Spheroid slices, 160 µm thick, were subjected to the TUNEL assay, with positive cells identified using CLSM imaging. i Volume statistics of tumor spheroids before and after treatment across different experimental groups. j Cytotoxicity assessment of GeNPs, EMV@GeNPs, and CatNbots on 3D tumor spheroids (n = 3). k Cellular uptake CLSM images for different samples (Green: labeled with Cou6, Red: cell membranes stained with Dil, Blue: cell nuclei stained with Hoechst 33342). l The corresponding fluorescence semi-quantitative analysis (n = 3) (exact P values: GeNP vs. CatNbot P = 3.77E−7, EMV@GeNP vs. CatNbot P = 1.2024E−6). m Cytotoxicity of GeNPs, EMV@GeNPs, and CatNbots on GL261 cell lines in a 2D culture (n = 3). n Mechanism diagram of CatNbots regulating the TME. o Typical CLSM images of intracellular H2O2 (labeled with the H2O2 fluorescent probe, ROSGreenTM H2O2 Probe) in cancer cells after CatNbots treatment for 12 h (n = 3). p Relative H2O2 level in cancer cells after treatment with different samples for 12 h (n = 3) (exact P-value: 3 h Control vs. CatNbot P = 1.51132E−5, 3 h GeNP vs. CatNbot P = 3.32681E−5, 9 h Control vs. CatNbot P = 3.9146E−6, 9 h GeNP vs. CatNbot P = 2.219E−6, 9 h EMV@GeNP vs. CatNbot P = 3.617E−7, 12 h Control vs. CatNbot P = 3.18E−8, 12 h GeNP vs. CatNbot P = 2.9E−8, 12 h EMV@GeNP vs. CatNbot P = 1.72E−8). Data are presented as mean ± SD of three independent experiments (d, g, j, l, m, p). P-values are determined by one-way ANOVA and Tukey multiple comparisons tests in (g, l, p). Source data are provided as a Source Data file.
Fig. 5 Deep penetration of CatNbots into the tumor. a Schematic diagram of the chemotaxis of CatNbots toward tumor tissue and the internalization by tumor cells. b Schematic of chemotactic motion of CatNbots along the concentration gradient of the H2O2. c Fluorescent images of the different chambers. d The corresponding fluorescence quantification values at different time points (n = 3). e In vitro penetration results in 3D tumor spheroids. The bright-field images and Z-stack CLSM images were taken from the top to the equatorial plane in 160 µm thickness of 3D cellular spheroids after treatment with GeNPs, EMV@GeNPs, and CatNbots for 4 h. f The corresponding fluorescent spectra and g the mean fluorescence intensity of the GL261 tumor spheroids treated with different samples (n = 3) (exact P value: GeNP vs. CatNbot P = 8.16414E−5). h Tumor spheroid morphology and TUNEL apoptosis assay of GL261 3D spheroids treated with various groups for 3 days. Spheroid slices, 160 µm thick, were subjected to the TUNEL assay, with positive cells identified using CLSM imaging. i Volume statistics of tumor spheroids before and after treatment across different experimental groups. j Cytotoxicity assessment of GeNPs, EMV@GeNPs, and CatNbots on 3D tumor spheroids (n = 3). k Cellular uptake CLSM images for different samples (Green: labeled with Cou6, Red: cell membranes stained with Dil, Blue: cell nuclei stained with Hoechst 33342). l The corresponding fluorescence semi-quantitative analysis (n = 3) (exact P values: GeNP vs. CatNbot P = 3.77E−7, EMV@GeNP vs. CatNbot P = 1.2024E−6). m Cytotoxicity of GeNPs, EMV@GeNPs, and CatNbots on GL261 cell lines in a 2D culture (n = 3). n Mechanism diagram of CatNbots regulating the TME. o Typical CLSM images of intracellular H2O2 (labeled with the H2O2 fluorescent probe, ROSGreenTM H2O2 Probe) in cancer cells after CatNbots treatment for 12 h (n = 3). p Relative H2O2 level in cancer cells after treatment with different samples for 12 h (n = 3) (exact P-value: 3 h Control vs. CatNbot P = 1.51132E−5, 3 h GeNP vs. CatNbot P = 3.32681E−5, 9 h Control vs. CatNbot P = 3.9146E−6, 9 h GeNP vs. CatNbot P = 2.219E−6, 9 h EMV@GeNP vs. CatNbot P = 3.617E−7, 12 h Control vs. CatNbot P = 3.18E−8, 12 h GeNP vs. CatNbot P = 2.9E−8, 12 h EMV@GeNP vs. CatNbot P = 1.72E−8). Data are presented as mean ± SD of three independent experiments (d, g, j, l, m, p). P-values are determined by one-way ANOVA and Tukey multiple comparisons tests in (g, l, p). Source data are provided as a Source Data file.CC BY-NC-ND · PubMed Central
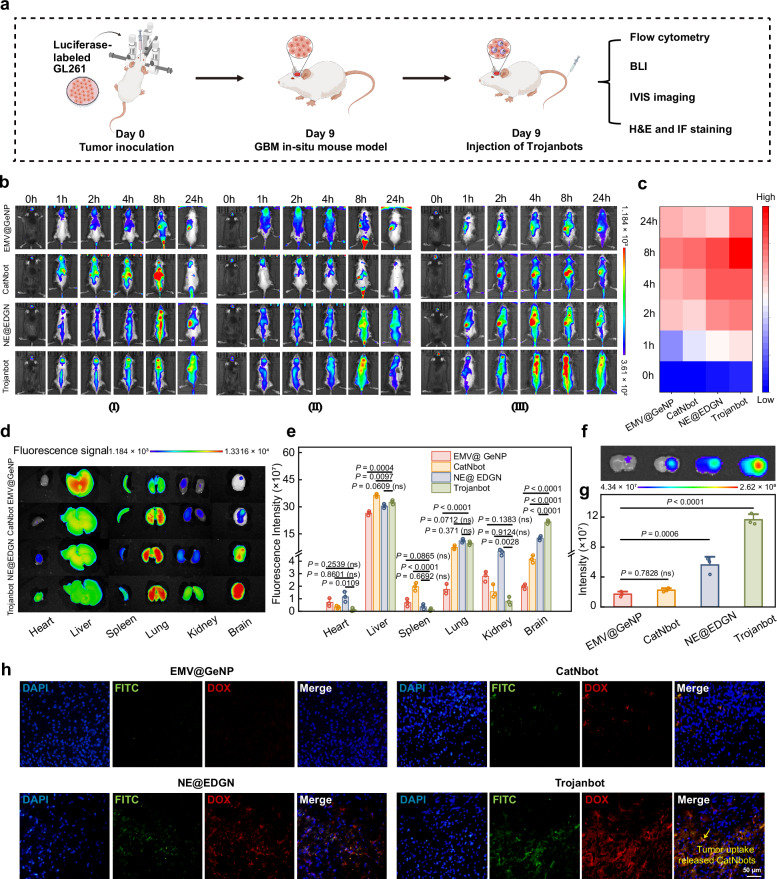
Fig. 6 In vivo distribution of Trojanbots. a The schematic representation of the construction of the brain glioma model. b In vivo fluorescence images of orthotopic GL261-Luc mouse models with GBM tumors following a single tail vein injection of potassium fluorescein (n = 3 mice per group). c Fluorescence intensity measurements of glioma mouse brains treated with various therapeutic agents (n = 3 mice per group). d Fluorescent images (IVIS imaging) of the brain and major organs, taken 48 h after injection (n = 3 mice per group). e Quantitative ROI analysis of DiR signals in the brain and organs (n = 3 mice per group) (exact P value: Spleen CatNbot vs. Trojanbot P = 5.89774E−5, Lung EMV@GeNP vs. Trojanbot P = 3.86669E−5, Brain EMV@GeNP vs. Trojanbot P = 3.98E−8, Brain CatNbot vs. Trojanbot P = 1.084E−7, NE@EDGN vs. Trojanbot P = 1.62003E−5). f Fluorescence images (IVIS imaging) of brain slices from four groups of mice, labeled with DiR (8 h post tail vein injection). g Quantitative analysis of the fluorescence images (IVIS imaging) of brain slices from the four groups (n = 3 mice per group). (exact P value: EMV@GeNP vs. Trojanbot P = 6.055E−7). h Representative fluorescence images of glioma tissue slices from GBM mice. In the images, EMV@GeNPs, CatNbots, EMV@GeNPs within NE@EDGN, and CatNbots within Trojanbots were labeled with FITC (green), while DOX exhibits intrinsic autofluorescence properties (red). The nuclei of the GL261 cells were stained with Hoechst 33342 (blue). Data are presented as mean ± SD of three independent experiments (e, g). P-values are determined by one-way ANOVA and Tukey multiple comparison tests in (e, g). Source data are provided as a Source Data file.
Fig. 6 In vivo distribution of Trojanbots. a The schematic representation of the construction of the brain glioma model. b In vivo fluorescence images of orthotopic GL261-Luc mouse models with GBM tumors following a single tail vein injection of potassium fluorescein (n = 3 mice per group). c Fluorescence intensity measurements of glioma mouse brains treated with various therapeutic agents (n = 3 mice per group). d Fluorescent images (IVIS imaging) of the brain and major organs, taken 48 h after injection (n = 3 mice per group). e Quantitative ROI analysis of DiR signals in the brain and organs (n = 3 mice per group) (exact P value: Spleen CatNbot vs. Trojanbot P = 5.89774E−5, Lung EMV@GeNP vs. Trojanbot P = 3.86669E−5, Brain EMV@GeNP vs. Trojanbot P = 3.98E−8, Brain CatNbot vs. Trojanbot P = 1.084E−7, NE@EDGN vs. Trojanbot P = 1.62003E−5). f Fluorescence images (IVIS imaging) of brain slices from four groups of mice, labeled with DiR (8 h post tail vein injection). g Quantitative analysis of the fluorescence images (IVIS imaging) of brain slices from the four groups (n = 3 mice per group). (exact P value: EMV@GeNP vs. Trojanbot P = 6.055E−7). h Representative fluorescence images of glioma tissue slices from GBM mice. In the images, EMV@GeNPs, CatNbots, EMV@GeNPs within NE@EDGN, and CatNbots within Trojanbots were labeled with FITC (green), while DOX exhibits intrinsic autofluorescence properties (red). The nuclei of the GL261 cells were stained with Hoechst 33342 (blue). Data are presented as mean ± SD of three independent experiments (e, g). P-values are determined by one-way ANOVA and Tukey multiple comparison tests in (e, g). Source data are provided as a Source Data file.CC BY-NC-ND · PubMed Central
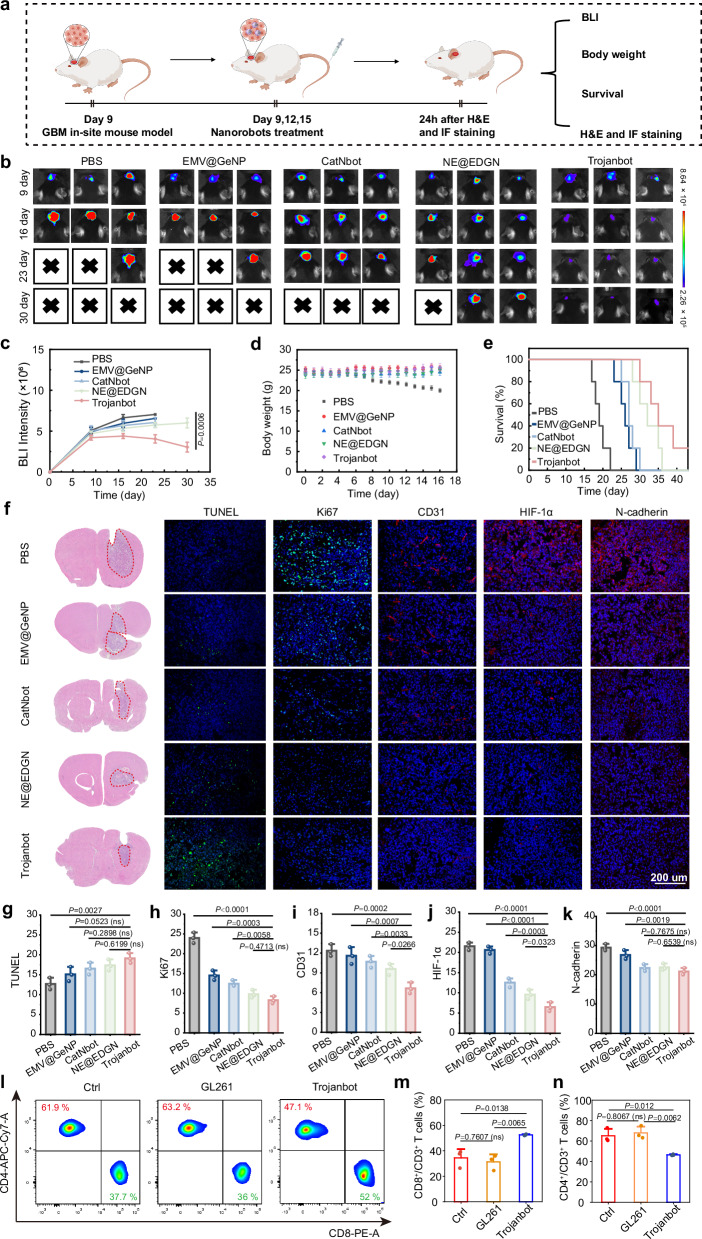
Fig. 7 In vivo antitumor activity of Trojanbots in glioma-bearing mice. a The schematic diagram of intravenous injection treatment. b Time-course bioluminescence images of orthotopic GL261 tumor-bearing mice treated with PBS, EMV@GeNPs, CatNbots, NE@EDGNs, and Trojanbots (n = 5 mice per group). c Quantified luminescence levels of mice using the Lumina IVIS III system (n = 5 mice per group). d Body weight profiles (n = 5 mice per group). e Survival curves of mice (n = 5 mice per group) (exact P value: PBS vs. Trojanbots, P = 0.0003, EMV @ GeNP vs. Trojanbot, P = 0.0005, CatNbot vs. Trojanbot, P = 0.0022, NE @ EDGN vs. Trojanbot, P = 0.2517). f H&E images of the whole brains excised from the representative mice in treatments as described above, Histological analysis using the TUNEL (Green: apoptotic cells; Blue: Hoechst-stained cell nuclei) and Ki67 assay (Green: proliferating cells; Blue: Hoechst-stained cell nuclei), CD31, HIF-1α, and N-cadherin. The histological analyses were representative of data from three mice. g–k The fluorescence statistics derived from the histological analyses shown in (f) (n = 3 mice per group) (exact P value of h: PBS vs. Trojanbot P = 5.65E−8, exact P value of j: PBS vs. Trojanbot P = 6.91E−8, EMV@GeNP vs. Trojanbot P = 1.258E−7, exact P value of k: PBS vs. Trojanbot P = 9.00532E−5). l Representative flow cytometry results showing different groups of CD45+CD3+T cells in tumor tissues of GBM. For the gating strategy for T-cell analysis, refer to Supplementary Fig. 35. m Quantitative analysis of CD3+CD8+ cytotoxic Helper T cells (n = 3 mice per group). n Quantitative analysis of CD3+CD4+ Helper T cells (n = 3 mice per group). Data are presented as mean ± SD of three independent experiments (g–k, m, n) and five independent experiments (c–e). P-values are determined by one-way ANOVA and Tukey multiple comparisons tests in (c, e, g–k, m, n). Source data are provided as a Source Data file.
Fig. 7 In vivo antitumor activity of Trojanbots in glioma-bearing mice. a The schematic diagram of intravenous injection treatment. b Time-course bioluminescence images of orthotopic GL261 tumor-bearing mice treated with PBS, EMV@GeNPs, CatNbots, NE@EDGNs, and Trojanbots (n = 5 mice per group). c Quantified luminescence levels of mice using the Lumina IVIS III system (n = 5 mice per group). d Body weight profiles (n = 5 mice per group). e Survival curves of mice (n = 5 mice per group) (exact P value: PBS vs. Trojanbots, P = 0.0003, EMV @ GeNP vs. Trojanbot, P = 0.0005, CatNbot vs. Trojanbot, P = 0.0022, NE @ EDGN vs. Trojanbot, P = 0.2517). f H&E images of the whole brains excised from the representative mice in treatments as described above, Histological analysis using the TUNEL (Green: apoptotic cells; Blue: Hoechst-stained cell nuclei) and Ki67 assay (Green: proliferating cells; Blue: Hoechst-stained cell nuclei), CD31, HIF-1α, and N-cadherin. The histological analyses were representative of data from three mice. g–k The fluorescence statistics derived from the histological analyses shown in (f) (n = 3 mice per group) (exact P value of h: PBS vs. Trojanbot P = 5.65E−8, exact P value of j: PBS vs. Trojanbot P = 6.91E−8, EMV@GeNP vs. Trojanbot P = 1.258E−7, exact P value of k: PBS vs. Trojanbot P = 9.00532E−5). l Representative flow cytometry results showing different groups of CD45+CD3+T cells in tumor tissues of GBM. For the gating strategy for T-cell analysis, refer to Supplementary Fig. 35. m Quantitative analysis of CD3+CD8+ cytotoxic Helper T cells (n = 3 mice per group). n Quantitative analysis of CD3+CD4+ Helper T cells (n = 3 mice per group). Data are presented as mean ± SD of three independent experiments (g–k, m, n) and five independent experiments (c–e). P-values are determined by one-way ANOVA and Tukey multiple comparisons tests in (c, e, g–k, m, n). Source data are provided as a Source Data file.CC BY-NC-ND · PubMed Central

Verification

Claims the paper makes

The claims and statistics of this paper haven’t been checked yet.

Run the check — free, no account needed. It reads the open-access text and checks the sources it cites.

A few free checks a day · papers already verified open instantly · results are public

Claims other papers make about this one

Each is checked against this paper’s own text: does it say what the citing paper says it does?

Self-check

Percentages, sums and reported differences re-computed from the paper’s own numbers.

The self-check needs the paper’s full text.

Citations

Cites

Show all 2 references

Research works printed but not linked: 68

  1. Aldape, K. et al. Challenges to curing primary brain tumours. Nat. Rev. Clin. Oncol. 16, 509–520 (2019). · DOI · Paper page
  2. Di Mascolo, D. et al. Conformable hierarchically engineered polymeric micromeshes enabling combinatorial therapies in brain tumours. Nat. Nanotechnol. 16, 820–829 (2021). · DOI
  3. Weller, M. et al. Glioma. Nat. Rev. Dis. Prim. 10, 33 (2024). · DOI
  4. Lu, G. H. et al. Engineered biomimetic nanoparticles achieve targeted delivery and efficient metabolism-based synergistic therapy against glioblastoma. Nat. Commun. 13, 4214 (2022). · DOI
  5. Gao, J. J. et al. Precision drug delivery to the central nervous system using engineered nanoparticles. Nat. Rev. Mater. 9, 567–588 (2024). · DOI
  6. Tang, W. et al. Emerging blood–brain-barrier-crossing nanotechnology for brain cancer theranostics. Chem. Soc. Rev. 48, 2967–3014 (2019). · DOI
  7. Arvanitis, C. D., Ferraro, G. B. & Jain, R. K. The blood–brain barrier and blood–tumour barrier in brain tumours and metastases. Nat. Rev. Cancer 20, 26–41 (2020). · DOI
  8. Mao, M., Wu, Y. J. & He, Q. Recent advances in targeted drug delivery for the treatment of glioblastoma. Nanoscale 16, 8689–8707 (2024). · DOI
  9. Gao, C. Y. et al. Biomedical micro-/nanomotors: from overcoming biological barriers to in vivo imaging. Adv. Mater. 33, 2000512 (2021). · DOI
  10. Wang, X. J. et al. Bioinspired adaptive microdrugs enhance the chemotherapy of malignant glioma: beyond their nanodrugs. Adv. Mater. 36, 2405165 (2024). · DOI
  11. Chen, S. Q. et al. Enhanced tumour penetration and prolonged circulation in the blood of polyzwitterion-drug conjugates with cell-membrane affinity. Nat. Biomed. Eng. 5, 1019–1037 (2021). · DOI
  12. Li, S. L., Jiang, P., Jiang, F. L. & Liu, Y. Recent advances in nanomaterial-based nanoplatforms for chemodynamic cancer therapy. Adv. Funct. Mater. 31, 2100243 (2021). · DOI
  13. Meng, W. R., Hao, Y. Y., He, C. S., Li, L. & Zhu, G. Q. Exosome-orchestrated hypoxic tumor microenvironment. Mol. Cancer 18, 57 (2019). · DOI
  14. Huang, J. C. et al. Extracellular matrix and its therapeutic potential for cancer treatment. Signal Transduct. Target. Ther. 6, 153 (2021). · DOI · Paper page
  15. Kim, J. et al. Advanced materials for micro/nanorobotics. Chem. Soc. Rev. 53, 9190–9253 (2024). · DOI
  16. Zhou, H. J., Mayorga-Martinez, C. C., Pané, S., Zhang, L. & Pumera, M. Magnetically driven micro and nanorobots. Chem. Rev. 121, 4999–5041 (2021). · DOI
  17. Han, H. et al. Imaging-guided bioresorbable acoustic hydrogel microrobots. Sci. Robot. 9, 3593 (2024). · DOI
  18. Wu, Z. G., Chen, Y., Mukasa, D., Pak, O. S. & Gao, W. Medical micro/nanorobots in complex media. Chem. Soc. Rev. 49, 8088–8112 (2020). · DOI
  19. Lu, H. J. et al. A bioinspired multilegged soft millirobot that functions in both dry and wet conditions. Nat. Commun. 9, 3944 (2018). · DOI
  20. Chen, J. Y. et al. Enhancing aortic valve drug delivery with PAR2-targeting magnetic nano-cargoes for calcification alleviation. Nat. Commun. 15, 557 (2024). · DOI
  21. Wang, S. H. et al. Hydrogen-powered microswimmers for precise and active hydrogen therapy towards acute ischemic stroke. Adv. Funct. Mater. 31, 202009475 (2021).
  22. Yang, Z. L. et al. Ultrasmall enzyme-powered janus nanomotor working in blood circulation system. ACS Nano 17, 6023–6035 (2023). · DOI
  23. Simo, C. et al. Urease-powered nanobots for radionuclide bladder cancer therapy. Nat. Nanotechnol. 19, 554–564 (2024). · DOI
  24. Serra-Casablancas, M. et al. Catalase-powered nanobots for overcoming the mucus barrier. ACS Nano 18, 16701–16714 (2024). · DOI
  25. Gu, Z. Q. et al. Autonomous nanorobots with powerful thrust under dry solid-contact conditions by photothermal shock. Nat. Commun. 14, 7663 (2023). · DOI
  26. Villa, K. & Pumera, M. Fuel-free light-driven micro/nanomachines: artificial active matter mimicking nature. Chem. Soc. Rev. 48, 4966–4978 (2019). · DOI
  27. Ma, Z. C. et al. Femtosecond laser programmed artificial musculoskeletal systems. Nat. Commun. 11, 4536 (2020). · DOI
  28. Liang, Q. L. et al. The softness of tumour-cell-derived microparticles regulates their drug-delivery efficiency. Nat. Biomed. Eng. 3, 729–740 (2019). · DOI
  29. Gao, C. et al. Treatment of atherosclerosis by macrophage-biomimetic nanoparticles via targeted pharmacotherapy and sequestration of proinflammatory cytokines. Nat. Commun. 11, 2622 (2020). · DOI
  30. Zou, Y. et al. Cancer cell-mitochondria hybrid membrane coated Gboxin loaded nanomedicines for glioblastoma treatment. Nat. Commun. 14, 4557 (2023). · DOI
  31. Gao, C. Y., Zhou, C., Lin, Z. H., Yang, M. C. & He, Q. Surface wettability-directed propulsion of glucose-powered nanoflask motors. ACS Nano 13, 12758–12766 (2019). · DOI
  32. Fan, R. R. et al. Engineering MMP-2 activated nanoparticles carrying B7-H3 bispecific antibodies for ferroptosis-enhanced glioblastoma immunotherapy. ACS Nano 17, 9126–9139 (2023). · DOI
  33. Li, Z. X. et al. Biohybrid microrobots regulate colonic cytokines and the epithelium barrier in inflammatory bowel disease. Sci. Robot. 9, eaat2007 (2024). · DOI
  34. Soto, F., Wang, J., Ahmed, R. & Demirci, U. Medical micro/nanorobots in precision medicine. Adv. Sci. 7, 2002203 (2020). · DOI
  35. Chen, B. et al. Cell-based micro/nano-robots for biomedical applications: a review. Small 20, 2304607 (2024). · DOI
  36. Ye, J. M. et al. Biomimetic dual-driven heterojunction nanomotors for targeted catalytic immunotherapy of glioblastoma. Adv. Funct. Mater 35, 2416265 (2024). · DOI
  37. Sun, J. W., Mathesh, M., Li, W. & Wilson, D. A. Enzyme-powered nanomotors with controlled size for biomedical applications. ACS Nano 13, 10191–10200 (2019). · DOI
  38. Mathesh, M., Sun, J. W., van der Sandt, F. & Wilson, D. A. Supramolecular nanomotors with “pH taxis” for active drug delivery in the tumor microenvironment. Nanoscale 12, 22495–22501 (2020). · DOI
  39. Zhang, F. Y. et al. Nanoparticle-modified microrobots for in vivo antibiotic delivery to treat acute bacterial pneumonia. Nat. Mater. 21, 1324–1332 (2022). · DOI
  40. de Avila, B. E. F. et al. Hybrid biomembrane-functionalized nanorobots for concurrent removal of pathogenic bacteria and toxins. Sci. Robot. 3, eaat0485 (2018). · DOI
  41. Yong, J. L., Mellick, A. S., Whitelock, J., Wang, J. S. & Liang, K. A Biomolecular toolbox for precision nanomotors. Adv. Mater. 35, 2205746 (2023). · DOI
  42. Xue, J. W. et al. Neutrophil-mediated anticancer drug delivery for suppression of postoperative malignant glioma recurrence. Nat. Nanotechnol. 12, 692–700 (2017). · DOI
  43. Wu, M. Y. et al. MR imaging tracking of inflammation-activatable engineered neutrophils for targeted therapy of surgically treated glioma. Nat. Commun. 9, 4777 (2018). · DOI
  44. Chang, Y. et al. CAR-neutrophil mediated delivery of tumor-microenvironment responsive nanodrugs for glioblastoma chemo-immunotherapy. Nat. Commun. 14, 2266 (2023). · DOI
  45. Li, M. et al. Chemotaxis-driven delivery of nano-pathogenoids for complete eradication of tumors post-phototherapy. Nat. Commun. 11, 1126 (2020). · DOI
  46. Wu, J. F. et al. Dual-responsive nanorobot-based marsupial robotic system for intracranial cross-scale targeting drug delivery. Adv. Mater. 36, 2306876 (2024). · DOI
  47. Chang, X. W. et al. Enhanced manipulation of tumor microenvironments by nanomotor for synergistic therapy of malignant tumor. Biomaterials 290, 121853 (2022). · DOI
  48. de Avila, B. E. F. et al. Nanomotor-enabled pH-responsive intracellular delivery of caspase-3: toward rapid cell apoptosis. ACS Nano 11, 5367–5374 (2017). · DOI
  49. Chen, H. et al. A nitric-oxide driven chemotactic nanomotor for enhanced immunotherapy of glioblastoma. Nat. Commun. 14, 941 (2023). · DOI
  50. Gao, C. Y. et al. Stem cell membrane-coated nanogels for highly efficient in vivo tumor targeted drug delivery. Small 12, 4056–4062 (2016). · DOI
  51. Xuan, M. J., Shao, J. X., Lin, X. K., Dai, L. R. & He, Q. Self-propelled janus mesoporous silica nanomotors with sub-100 nm diameters for drug encapsulation and delivery. Chemphyschem 15, 2255–2260 (2014). · DOI
  52. Shao, J. X. et al. Chemotaxis-guided hybrid neutrophil micromotors for targeted drug transport. Angew. Chem.-Int. Ed. 56, 12935–12939 (2017). · DOI
  53. Michael, M. & Vermeren, S. A neutrophil-centric view of chemotaxis. Essays Biochem. 63, 607–618 (2019). · DOI
  54. Kolaczkowska, E. & Kubes, P. Neutrophil recruitment and function in health and inflammation. Nat. Rev. Immunol. 13, 159–175 (2013). · DOI · Paper page
  55. de Oliveira, S., Rosowski, E. E. & Huttenlocher, A. Neutrophil migration in infection and wound repair: going forward in reverse. Nat. Rev. Immunol. 16, 378–391 (2016). · DOI · Paper page
  56. Howse, J. R. et al. Self-motile colloidal particles: from directed propulsion to random walk. Phys. Rev. Lett. 99, 048102 (2007). · DOI
  57. Li, J. W. et al. Water-soluble and degradable gelatin/polyaniline assemblies with a high photothermal conversion efficiency for ph-switchable precise photothermal therapy. ACS Appl. Mater. Interfaces 14, 52670–52683 (2022). · DOI
  58. Helms, H. C. et al. In vitro models of the blood-brain barrier: an overview of commonly used brain endothelial cell culture models and guidelines for their use. J. Cereb. Blood Flow. Metab. 36, 862–890 (2016). · DOI · Paper page
  59. Hyun, Y. M., Choe, Y. H., Park, S. A. & Kim, M. LFA-1 (CD11a/CD18) and Mac-1 (CD11b/CD18) distinctly regulate neutrophil extravasation through hotspots I and II. Exp. Mol. Med. 51, 1–13 (2019). · DOI
  60. Chauhan, V. P. & Jain, R. K. Strategies for advancing cancer nanomedicine. Nat. Mater. 12, 958–962 (2013). · DOI
  61. Cho, Y. & Doh, J. The extracellular matrix in solid tumor immunotherapy. Trends Immunol. 45, 705–714 (2024). · DOI
  62. Zhou, C. et al. Torque-driven orientation motion of chemotactic colloidal motors. Angew. Chem.-Int. Ed. 61, e202116013 (2022). · DOI
  63. Yan, Y. L. et al. Suppression of ITPKB degradation by Trim25 confers TMZ resistance in glioblastoma through ROS homeostasis. Signal Transduct. Target. Ther. 9, 58 (2024). · DOI
  64. Zaher, A., Petronek, M. S., Allen, B. G. & Mapuskar, K. A. Balanced duality: H2O2-based therapy in cancer and its protective effects on non-malignant tissues. Int. J. Mol. Sci. 25, 8885 (2024). · DOI
  65. Wang, H. et al. Synergistic chemoimmunotherapy augmentation via sequential nanocomposite hydrogel-mediated reprogramming of cancer-associated fibroblasts in osteosarcoma. Adv. Mater. 36, 2309591 (2024). · DOI
  66. Robins, E. et al. Conversion of effector CD4+ T cells to a CD8+ MHC II-recognizing lineage. Cell. Mol. Immunol. 18, 150–161 (2021). · DOI
  67. Hameedat, F. et al. Engineering nanomaterials for glioblastoma nanovaccination. Nat. Rev. Mater. 9, 628–642 (2024). · DOI
  68. Wilhelm, S. et al. Analysis of nanoparticle delivery to tumours. Nat. Rev. Mater. 1, 16014 (2016). · DOI · Paper page

Cited by

Sorted by citations

Metadata

Authors
Gao, Y., Mao, M., Li, Y., Xuan, M., Wu, Y., & He, Q.
Venue
Nature Communications
Published
2025-06-06
Volume
16
Issue
1
ISSN
2041-1723
Cited by
42
References
2
Language
en
Funders
  • National Natural Science Foundation of China (22193033, U23A20342)
  • the Key R&D Program of Heilongjiang Province, China
  • China Postdoctoral Science Foundation (2024M764205)
  • the Postdoctoral Fellowship Program of CPSF

About these checks

Registry, retraction, Cites and statistics results are computed, not judged, with one exception: a printed reference that no index lists is read once by a model before it counts as a citation error. Claims are extracted by a model and kept only when their quote appears verbatim in the text; each cited source is then checked, with a model’s help, for whether it says what the claim relies on. Those verdicts can be wrong — read the claim’s quote and the cited source before relying on one.

Statistics and arithmetic are recomputed, not judged.

Confidence bands are shown only for fields calibrated on our annotated test set. None is calibrated yet, so no band is shown.

What counts as a claim ›How we measure confidence ›How we check this ›

Are you an author, or do you see a problem with this page? Request a review