

The DOI matches its Crossref record; 68 of the 68 references it cites were found in a registry or an index.
Harnessing protein language model for structure-based discovery of highly efficient and robust PET hydrolases
Open accessPublished version of a preprint
Abstract
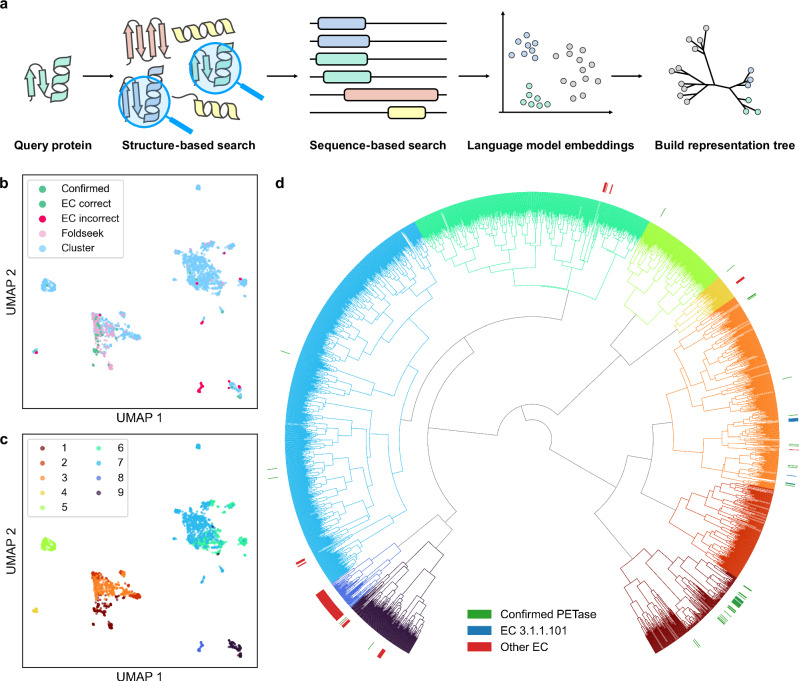
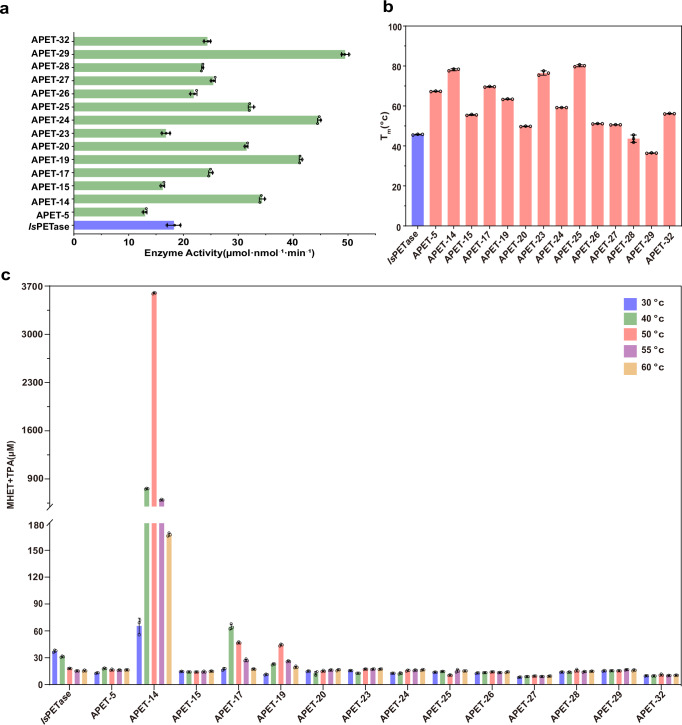
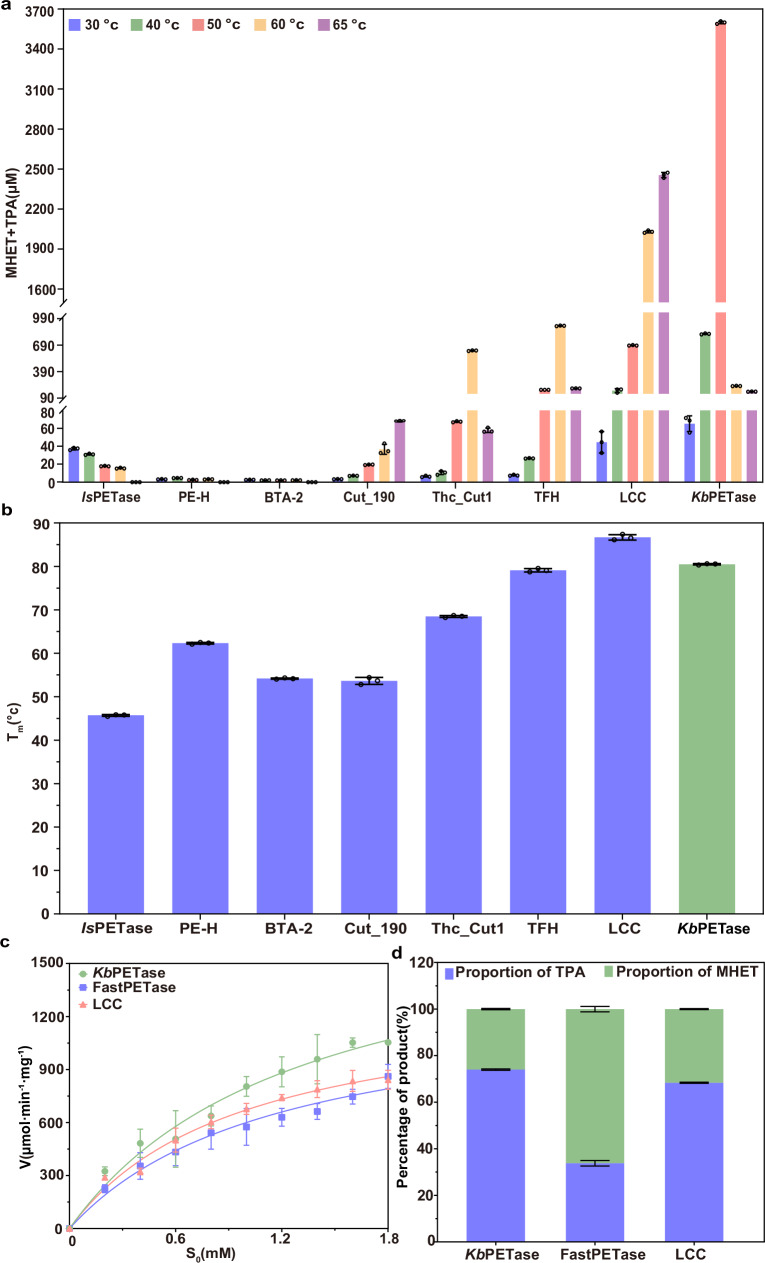
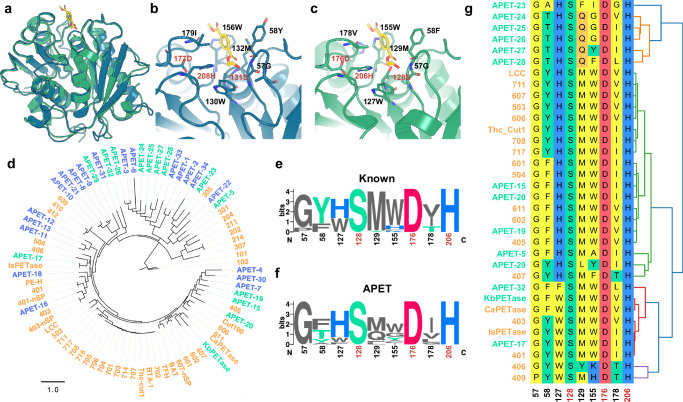
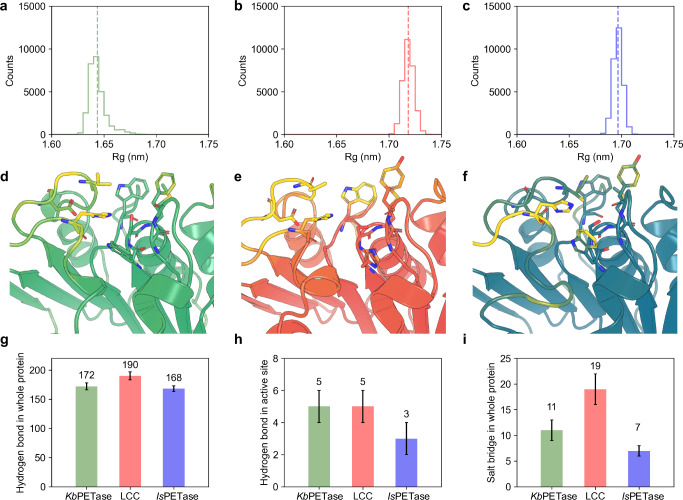
Plastic waste, particularly polyethylene terephthalate (PET), presents significant environmental challenges, driving extensive research into enzymatic biodegradation. However, existing PET hydrolases (PETases) are limited by narrow sequence diversity and suboptimal performance. This study introduces VenusMine, a protein discovery pipeline that integrates protein language models (PLMs) with a representation tree to identify PETases based on structural similarity using sequence information. Using the crystal structure of Is PETase as a template, VenusMine identifies and clusters target proteins. Candidates are further screened using PLM-based assessments of solubility and thermostability, leading to the selection of 34 proteins for biochemical validation. Results reveal that 14 candidates exhibit PET degradation activity across 30–60 °C. Notably, a PET hydrolase from Kibdelosporangium banguiense ( Kb PETase) demonstrates a melting temperature (T m ) 32 °C higher than Is PETase and exhibits the highest PET degradation activity within 30 – 65 °C among wild-type PETases. Kb PETase also surpasses FastPETase and LCC in catalytic efficiency. X-ray crystallography and molecular dynamics simulations show that Kb PETase possesses a conserved catalytic domain and enhanced intramolecular interactions, underpinning its improved functionality and thermostability. This work demonstrates a novel deep learning approach for discovering natural PETases with enhanced properties.
Overview
The claims and statistics of this paper haven’t been checked yet.
Run the check — free, no account needed. It reads the open-access text and checks the sources it cites.
Integrity signals
Registry
Cites
Statistics
Figures
Verification
Claims the paper makes
The claims and statistics of this paper haven’t been checked yet.
Run the check — free, no account needed. It reads the open-access text and checks the sources it cites.
Self-check
Percentages, sums and reported differences re-computed from the paper’s own numbers.
The self-check needs the paper’s full text.
Citations
Cites
Highly accurate protein structure prediction with AlphaFold
Jumper, J., Evans, R., Pritzel, A., Green, T., Figurnov, M., Ronneberger, O., Tunyasuvunakool, K., Bates, R., Žídek, A., Potapenko, A., et al. (2021) · Nature · doi:10.1038/s41586-021-03819-2 · Cited by 43,764
Production, use, and fate of all plastics ever made
Geyer, R., Jambeck, J. R., & Law, K. L. (2017) · Science Advances · doi:10.1126/sciadv.1700782 · Cited by 18,606
Plastic waste inputs from land into the ocean
Jambeck, J. R., Geyer, R., Wilcox, C., Siegler, T. R., Perryman, M., Andrady, A., Narayan, R., & Law, K. L. (2015) · Science · doi:10.1126/science.1260352 · Cited by 13,163
Varadi, M., Anyango, S., Deshpande, M., Nair, S., Natassia, C., Yordanova, G., Yuan, D., Stroe, O., Wood, G., Laydon, A., et al. (2022) · Nucleic Acids Research · doi:10.1093/nar/gkab1061 · Cited by 7,850
Evolutionary-scale prediction of atomic level protein structure with a language model
Lin, Z., Akin, H., Rao, R., Hie, B., Zhu, Z., Lu, W., Smetanin, N., Verkuil, R., Kabeli, O., Shmueli, Y., et al. (2022) · doi:10.1101/2022.07.20.500902 · Cited by 5,990
Eriksen, M., Lebreton, L. C. M., Carson, H. S., Thiel, M., Moore, C. J., Borerro, J. C., Galgani, F., Ryan, P. G., & Reisser, J. (2014) · PLoS ONE · doi:10.1371/journal.pone.0111913 · Cited by 4,710
SignalP 5.0 improves signal peptide predictions using deep neural networks
Armenteros, J. J. A., Tsirigos, K. D., Sønderby, C. K., Petersen, T. N., Winther, O., Brunak, S., von HEIJNE, G., & Nielsen, H. (2019) · Nature Biotechnology · doi:10.1038/s41587-019-0036-z · Cited by 4,315
Improved protein structure prediction using potentials from deep learning
Senior, A. W., Evans, R., Jumper, J., Kirkpatrick, J., Sifre, L., Green, T., Qin, C., Žídek, A., Nelson, A. W. R., Bridgland, A., et al. (2020) · Nature · doi:10.1038/s41586-019-1923-7 · Cited by 3,378
A bacterium that degrades and assimilates poly(ethylene terephthalate)
Yoshida, S., Hiraga, K., Takehana, T., Taniguchi, I., Yamaji, H., Maeda, Y., Toyohara, K., Miyamoto, K., Kimura, Y., & Oda, K. (2016) · Science · doi:10.1126/science.aad6359 · Cited by 3,367
Predicted growth in plastic waste exceeds efforts to mitigate plastic pollution
Borrelle, S. B., Ringma, J., Law, K. L., Monnahan, C. C., Lebreton, L., McGivern, A., Murphy, E., Jambeck, J., Leonard, G. H., Hilleary, M. A., et al. (2020) · Science · doi:10.1126/science.aba3656 · Cited by 3,219
Cited by
Sorted by citations
Jahanshahi, D. A., Barzani, M. R. R., Bahram, M., Ariaeenejad, S., & Kavousi, K. (2025) · Ecotoxicology and Environmental Safety · doi:10.1016/j.ecoenv.2024.117640 · Cited by 41
Machine Learning-Guided Identification of PET Hydrolases from Natural Diversity
Norton‐Baker, B., Komp, E., Gado, J. E., Denton, M. C. R., Mathews, I. I., Murphy, N. P., Erickson, E., Storment, O. O., Sarangi, R., Gauthier, N. P., et al. (2025) · ACS Catalysis · doi:10.1021/acscatal.5c03460 · Cited by 36
The diversity of PET degrading enzymes: A systematic review of sequence, structure, and function
Ahituv, N., Freund, D., Mireles, R., & Noda‐García, L. (2025) · Protein Science · doi:10.1002/pro.70282 · Cited by 21
State-of-the-art advances in biotechnology for polyethylene terephthalate bio-depolymerization
Liu, Y., Zhou, J., Li, Y., Yan, X., Xu, A., Zhou, X., Liu, W., Xu, Y., Su, T., Wang, S., et al. (2025) · Green Carbon · doi:10.1016/j.greenca.2025.02.003 · Cited by 18
Lu, X., Cao, M., Ma, M., Wu, Y., Qu, M., Du, F., Ji, R., Duan, M., Dong, L., Liu, K., et al. (2025) · Food Bioengineering · doi:10.1002/fbe2.70029 · Cited by 12
Metadata
- Authors
- Wu, B., Zhong, B., Zheng, L., Huang, R., Jiang, S., Li, M., Hong, L., & Tan, P.
- Affiliations
- Shanghai Jiao Tong University (CN)
- Corresponding author
- Zheng, Lirong
- Hong, Liang
- Tan, Pan
- Venue
- Nature Communications
- Published
- 2025-07-05
- Volume
- 16
- Issue
- 1
- Pages
- 6211-6211
- ISSN
- 2041-1723 (ISSN-L)
- PMC
- PMC12228687
- OpenAlex
- W4412048048
- Cited by
- 50
- References
- 67
- Citations by year
- 2026: 39 · 2025: 11
- FWCI
- 14.93
- Type
- journal article
- Language
- en
- Open access
- gold
- doi.org
- Locations
- Nature Communications (publishedVersion, cc-by)
- bioRxiv (Cold Spring Harbor Laboratory) (acceptedVersion)
- Research Square (acceptedVersion, cc-by)
- Europe PMC (PubMed Central) (publishedVersion, cc-by)
- PubMed Central (publishedVersion, cc-by)
- PubMed (publishedVersion)
- DOAJ (DOAJ: Directory of Open Access Journals) (submittedVersion, cc-by-sa)
- Funders
- National Natural Science Foundation of China (12104295)
- Shanghai Municipal Education Commission
- Science and Technology Commission of Shanghai Municipality
- Shanghai Jiao Tong University (21X010200843)
- Centre Scientifique et Technique du Bâtiment
- National Key Research and Development Program of China
- Topics
- Life Sciences › Biochemistry, Genetics and Molecular Biology › Molecular Biology › Enzyme Catalysis and Immobilization
- Life Sciences › Biochemistry, Genetics and Molecular Biology › Biotechnology › Enzyme Production and Characterization
- Life Sciences › Biochemistry, Genetics and Molecular Biology › Molecular Biology › Protein Structure and Dynamics
- Keywords
- PET hydrolase, polyethylene terephthalate degradation, plastic waste biodegradation, protein language models, thermal stability, catalytic efficiency, protein solubility prediction
- MeSH terms
- Hydrolases, Polyethylene Terephthalates, Protein Conformation, Crystallography, X-Ray, Molecular Dynamics Simulation
About these checks
Registry, retraction, Cites and statistics results are computed, not judged, with one exception: a printed reference that no index lists is read once by a model before it counts as a citation error. Claims are extracted by a model and kept only when their quote appears verbatim in the text; each cited source is then checked, with a model’s help, for whether it says what the claim relies on. Those verdicts can be wrong — read the claim’s quote and the cited source before relying on one.
Statistics and arithmetic are recomputed, not judged.
Confidence bands are shown only for fields calibrated on our annotated test set. None is calibrated yet, so no band is shown.
What counts as a claim ›How we measure confidence ›How we check this ›
Are you an author, or do you see a problem with this page? Request a review
