Cited by 3Neurotransmitter Receptor Influence on BehaviorNeural and Behavioral Psychology StudiesNeural dynamics and brain function

The DOI matches its Crossref record; 88 of the 88 references it cites were found in a registry or an index.

Activity in human dorsal raphe nucleus signals changes in behavioural policy

Open access

Published version of a preprint

Abstract

The dorsal raphe nucleus (DRN) is an important source of serotonin to the human forebrain, however there is little consensus about its behavioural function. We build on recent results from animal models to demonstrate that activity in human DRN implements changes in behavioural policy that reflect the distribution of rewards in the environment. We use a foraging-inspired behavioural task to show that human participants change their policy to pursue or reject reward opportunities as a function of the average value of opportunities in the environment. Activity in DRN-but no other neuromodulatory nucleus-signals such policy changes. Patterns of multivariate activity in dorsal anterior cingulate cortex (dACC) and anterior insular cortex (AI), meanwhile, track the relative value of reward opportunities given the average value of the environment. We therefore suggest that DRN, dACC and AI form a circuit in which dACC/AI construct representations of reward opportunities given the current context, and DRN implements changes in behavioural policy based on these representations.

Overview

The claims and statistics of this paper haven’t been checked yet.

Run the check — free, no account needed. It reads the open-access text and checks the sources it cites.

A few free checks a day · papers already verified open instantly · results are public

Integrity signals

Registry

Crossref · 10.1038/s41467-026-68349-9

Cites

88 of 88 references verified0 citation errors · 0 not checkable

Statistics

Figures

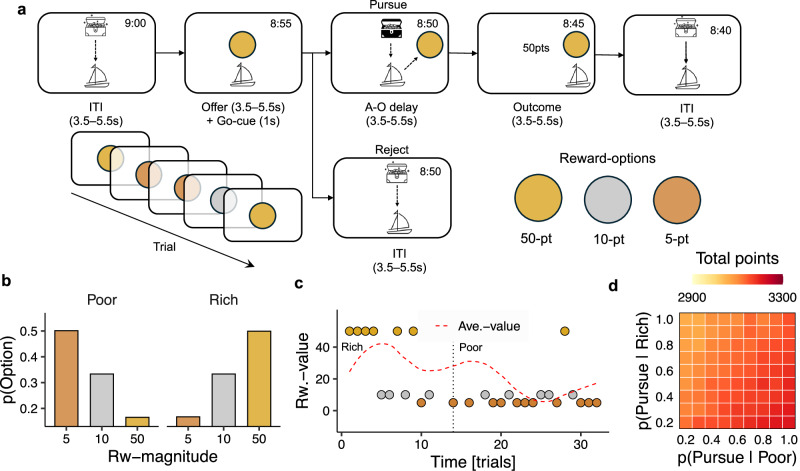
Fig. 1 A behavioural task for manipulating the richness of the environment. a Diagram of the behavioural task. Participants played the role of a ship’s captain, deciding whether to pursue or reject sequentially encountered treasure opportunities. Reward magnitude was indicated by gold, silver and bronze medallion stimuli. b Relative frequency of 5-point, 10-point and 50-point reward options in rich and poor environments, respectively. c Example sequence of rich and poor environments illustrating key reward statistics and their evolution over time. The dashed red line indicates the mean value of rewards over the preceding five trials (i.e., t−1:t−5). d Points-earned as a function of pursuit rates for the 10-point option in rich (Y axis) and poor (X axis) blocks. Task parameters ensure that the optimal strategy is to pursue the 10-point option in poor environments and reject it in rich environments.
Fig. 1 A behavioural task for manipulating the richness of the environment. a Diagram of the behavioural task. Participants played the role of a ship’s captain, deciding whether to pursue or reject sequentially encountered treasure opportunities. Reward magnitude was indicated by gold, silver and bronze medallion stimuli. b Relative frequency of 5-point, 10-point and 50-point reward options in rich and poor environments, respectively. c Example sequence of rich and poor environments illustrating key reward statistics and their evolution over time. The dashed red line indicates the mean value of rewards over the preceding five trials (i.e., t−1:t−5). d Points-earned as a function of pursuit rates for the 10-point option in rich (Y axis) and poor (X axis) blocks. Task parameters ensure that the optimal strategy is to pursue the 10-point option in poor environments and reject it in rich environments.CC BY · PubMed Central
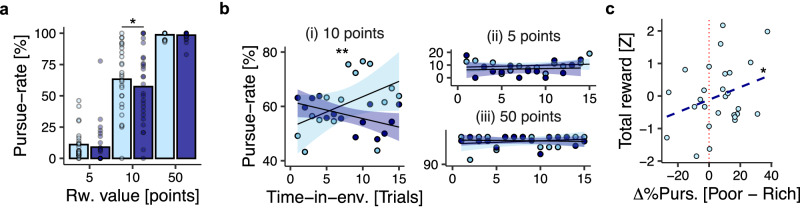
Fig. 2 Reward-guided decisions are modulated by the richness of the environment. a Pursue-rates for 5-point, 10-point, and 50-point reward options as a function of environment-type. Bars indicate sample-level mean pursue-rate; dots indicate participant-level mean pursue-rates. b Pursue-rates for 10-point (i), 5-point (ii) and 50-point (iii) options as a function of trial-within-environment in rich and poor blocks, respectively. Lines and shadings indicate regression-line ± SEM; dots indicate sample-level mean pursuit-rate as a function of trial-within-environment. c Relationship between behavioural change between environments for the 10-point option (X axis) and total points earned during the task (Y axis). Dots indicate observations from individual participants. In all panels, n = 27; *p < 0.05, **p < 0.01, ***p < 0.001 two-tailed.
Fig. 2 Reward-guided decisions are modulated by the richness of the environment. a Pursue-rates for 5-point, 10-point, and 50-point reward options as a function of environment-type. Bars indicate sample-level mean pursue-rate; dots indicate participant-level mean pursue-rates. b Pursue-rates for 10-point (i), 5-point (ii) and 50-point (iii) options as a function of trial-within-environment in rich and poor blocks, respectively. Lines and shadings indicate regression-line ± SEM; dots indicate sample-level mean pursuit-rate as a function of trial-within-environment. c Relationship between behavioural change between environments for the 10-point option (X axis) and total points earned during the task (Y axis). Dots indicate observations from individual participants. In all panels, n = 27; *p < 0.05, **p < 0.01, ***p < 0.001 two-tailed.CC BY · PubMed Central
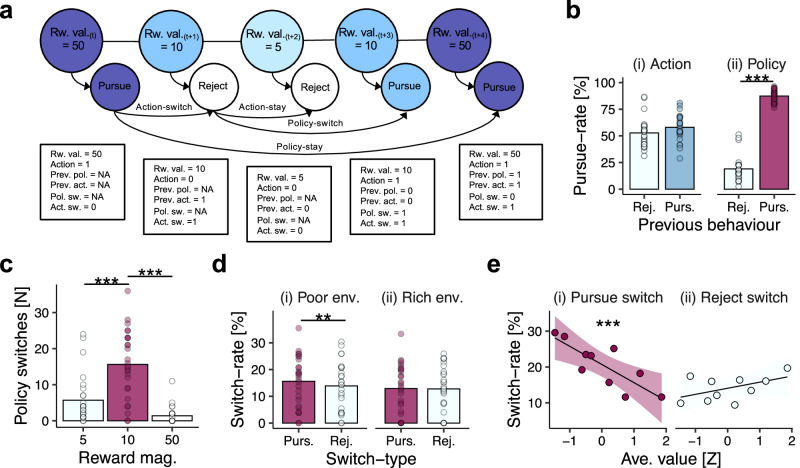
Fig. 3 Changes in behavioural policy are modulated by the richness of the environment. a Example sequence of trials and operationalisation of policy-related variables. Behaviour was characterised along two dimensions: (1) a policy dimension reflecting option-specific decisions to pursue-vs-reject the three available reward-options, and (2) an action dimension reflecting non-option-specific decisions to pursue-vs-reject an option regardless of the reward option available. Trials were then categorised as (i) policy-stay events if the pursue-vs-reject decision was consistent with the previous encounter, or (ii) policy-switch events if the pursue-vs-reject decision was different from the previous encounter. Similarly, trials were categorised as (i) action-stay if the pursue-vs-reject decision was the same as the preceding trial (regardless of reward option), and (ii) action-switch if the pursue-vs-reject decision changed. b Pursue-rates as a function of (i) previous action and (ii) previous policy. Bars indicate sample-mean pursuit-rate; dots indicate participant-level pursuit-rates. c Policy-switches frequency as a function of reward-option. Bars indicate the mean count of policy-switches per experimental session at the sample-level; dots indicate participant-specific counts. d Switch-rate for pursue-switches and reject-switches as a function of environment type. Data shown for the 10-point option only. Bars indicate sample-level mean switch-rate, dots indicate participant-level switch-rate. e Probability of (i) pursue-switches and (ii) reject-switches as a function of the average value of recent reward-options. Data shown for the 10-point option only. Lines and shadings indicate the regression line ± SEM. Points and error bars indicate mean ± SEM switch-rates in decile bins of average value. In all panels, n = 27; *p < 0.05, **p < 0.01, ***p < 0.001 two-tailed.
Fig. 3 Changes in behavioural policy are modulated by the richness of the environment. a Example sequence of trials and operationalisation of policy-related variables. Behaviour was characterised along two dimensions: (1) a policy dimension reflecting option-specific decisions to pursue-vs-reject the three available reward-options, and (2) an action dimension reflecting non-option-specific decisions to pursue-vs-reject an option regardless of the reward option available. Trials were then categorised as (i) policy-stay events if the pursue-vs-reject decision was consistent with the previous encounter, or (ii) policy-switch events if the pursue-vs-reject decision was different from the previous encounter. Similarly, trials were categorised as (i) action-stay if the pursue-vs-reject decision was the same as the preceding trial (regardless of reward option), and (ii) action-switch if the pursue-vs-reject decision changed. b Pursue-rates as a function of (i) previous action and (ii) previous policy. Bars indicate sample-mean pursuit-rate; dots indicate participant-level pursuit-rates. c Policy-switches frequency as a function of reward-option. Bars indicate the mean count of policy-switches per experimental session at the sample-level; dots indicate participant-specific counts. d Switch-rate for pursue-switches and reject-switches as a function of environment type. Data shown for the 10-point option only. Bars indicate sample-level mean switch-rate, dots indicate participant-level switch-rate. e Probability of (i) pursue-switches and (ii) reject-switches as a function of the average value of recent reward-options. Data shown for the 10-point option only. Lines and shadings indicate the regression line ± SEM. Points and error bars indicate mean ± SEM switch-rates in decile bins of average value. In all panels, n = 27; *p < 0.05, **p < 0.01, ***p < 0.001 two-tailed.CC BY · PubMed Central
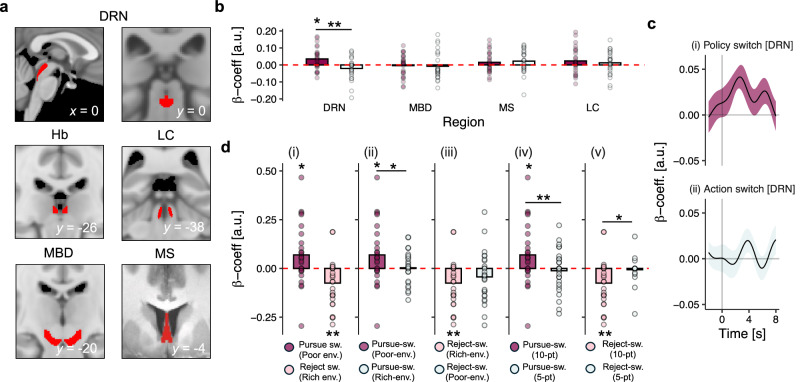
Fig. 4 Brain activity in dorsal raphe nucleus represents environment-driven changes in behavioural policy. a Anatomical regions of interest (ROIs) used in the fMRI analysis, including dorsal raphe nucleus (DRN); habenula (Hb); locus coeruleus (LC); substantia nigra and ventral tegmental area (MBD), and medial septal nucleus (MS). b Regression-weights for the effect of policy-switch and action-switch events in subcortical ROIs. c Timecourse of the effect size for (i) policy-switch events, and (ii) action-switch events. Time = 0 (x axis) indicates the onset of the reward-opportunity stimulus. Note that due to haemodynamic delay, policy-switch related activity in DRN likely occurs in ITI periods. d Regression-weights for the effect of policy-switch events on DRN activity in control analyses. (i) Effect of policy switches that are congruent with the environment—i.e., pursue-switches in poor environments and reject-switches in rich environments. (ii) Effect of pursue-switches in poor environments compared to pursue switches in rich environments; (iii) Effect of reject-switches in rich environments compared to reject-switches in poor environments. (iv) Effect of pursue-switches for the 10-point option compared to pursue-switches for the 5-point option in poor environments; (v) Effect of reject-switches for the 10-point option compared to reject-switches for the 5-point option in rich environments. c Lines and shadings indicate mean ± SE of regression-weight across participants. b, d Bars show sample-level mean peak regression weight; dots indicate participant-level peak regression weights. In all panels, n = 27; *p < 0.05, **p < 0.01, ***p < 0.001 two-tailed.
Fig. 4 Brain activity in dorsal raphe nucleus represents environment-driven changes in behavioural policy. a Anatomical regions of interest (ROIs) used in the fMRI analysis, including dorsal raphe nucleus (DRN); habenula (Hb); locus coeruleus (LC); substantia nigra and ventral tegmental area (MBD), and medial septal nucleus (MS). b Regression-weights for the effect of policy-switch and action-switch events in subcortical ROIs. c Timecourse of the effect size for (i) policy-switch events, and (ii) action-switch events. Time = 0 (x axis) indicates the onset of the reward-opportunity stimulus. Note that due to haemodynamic delay, policy-switch related activity in DRN likely occurs in ITI periods. d Regression-weights for the effect of policy-switch events on DRN activity in control analyses. (i) Effect of policy switches that are congruent with the environment—i.e., pursue-switches in poor environments and reject-switches in rich environments. (ii) Effect of pursue-switches in poor environments compared to pursue switches in rich environments; (iii) Effect of reject-switches in rich environments compared to reject-switches in poor environments. (iv) Effect of pursue-switches for the 10-point option compared to pursue-switches for the 5-point option in poor environments; (v) Effect of reject-switches for the 10-point option compared to reject-switches for the 5-point option in rich environments. c Lines and shadings indicate mean ± SE of regression-weight across participants. b, d Bars show sample-level mean peak regression weight; dots indicate participant-level peak regression weights. In all panels, n = 27; *p < 0.05, **p < 0.01, ***p < 0.001 two-tailed.CC BY · PubMed Central
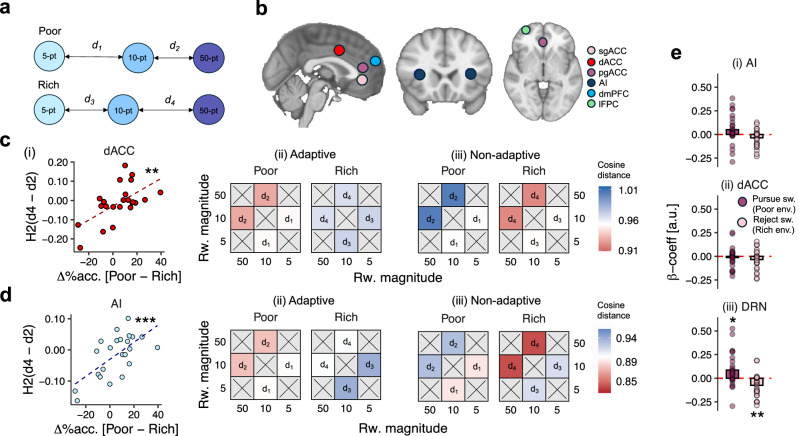
Fig. 5 Multivariate representations of value are modulated by the environment in dorsal anterior cingulate cortex and anterior insular cortex. a Diagram of key representational distances in the representational similarity analysis (RSA). b Cortical regions of interest (ROI) used in RSA included subgenual anterior cingulate cortex (sgACC), dorsal anterior cingulate cortex (dACC), pregenual anterior cingulate cortex (pgACC), anterior insular cortex (AI), dorsomedial prefrontal cortex (dmPFC) and lateral frontopolar cortex (lFPC). Colour scale corresponds to ROI identity. c RSA results in dACC. (i) Correlation between d4–d2 and behavioural change between environments. Points indicate participant-level observations; lines indicate line-of-best-fit. (ii) Representational distances between reward options as a function of environment type in (1) adaptive participants who changed their behaviour toward the 10-point option between environments, and (2) non-adaptive participants who did not. d RSA results in AI. (i) Correlation between d4–d2 and behavioural change between environments. Points indicate participant-level observations; lines indicate line-of-best-fit. (ii) Representational distances between reward options as a function of environment-type in adaptive and non-adaptive participants (c.f. c-ii). e Regression-weights for effect of congruent policy-switches in (i) AI, (ii) dACC and (iii) DRN. Bars indicate sample-level mean peak regression weight; dots indicate participant-level peak regression weights. In all panels, n = 27; *p < 0.05, **p < 0.01, ***p < 0.001 two-tailed.
Fig. 5 Multivariate representations of value are modulated by the environment in dorsal anterior cingulate cortex and anterior insular cortex. a Diagram of key representational distances in the representational similarity analysis (RSA). b Cortical regions of interest (ROI) used in RSA included subgenual anterior cingulate cortex (sgACC), dorsal anterior cingulate cortex (dACC), pregenual anterior cingulate cortex (pgACC), anterior insular cortex (AI), dorsomedial prefrontal cortex (dmPFC) and lateral frontopolar cortex (lFPC). Colour scale corresponds to ROI identity. c RSA results in dACC. (i) Correlation between d4–d2 and behavioural change between environments. Points indicate participant-level observations; lines indicate line-of-best-fit. (ii) Representational distances between reward options as a function of environment type in (1) adaptive participants who changed their behaviour toward the 10-point option between environments, and (2) non-adaptive participants who did not. d RSA results in AI. (i) Correlation between d4–d2 and behavioural change between environments. Points indicate participant-level observations; lines indicate line-of-best-fit. (ii) Representational distances between reward options as a function of environment-type in adaptive and non-adaptive participants (c.f. c-ii). e Regression-weights for effect of congruent policy-switches in (i) AI, (ii) dACC and (iii) DRN. Bars indicate sample-level mean peak regression weight; dots indicate participant-level peak regression weights. In all panels, n = 27; *p < 0.05, **p < 0.01, ***p < 0.001 two-tailed.CC BY · PubMed Central
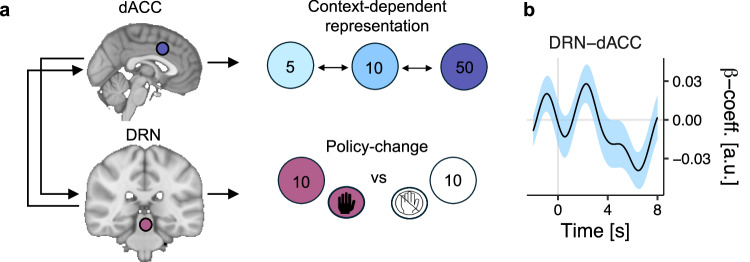
Fig. 6 A cortico-subcortical circuit for matching behavioural policies to the environment. a Diagram of proposed circuit interactions between the cortex and dorsal raphe nucleus (DRN) during reward-guided decision-making. In tandem with previous studies, we propose that regions of cortex like the dorsal anterior cingulate cortex (dACC) and anterior insula (AI) compute the relative value of reward options given the environment, and the DRN implements and/or facilitates changes in behavioural policy arising from relative value computations. b Psychophysiological interaction between dACC and DRN as a function of environment-type. Line and shading indicate mean ± SE of regression weight across participants; n = 27; *p < 0.05, **p < 0.01, ***p < 0.001 two-tailed.
Fig. 6 A cortico-subcortical circuit for matching behavioural policies to the environment. a Diagram of proposed circuit interactions between the cortex and dorsal raphe nucleus (DRN) during reward-guided decision-making. In tandem with previous studies, we propose that regions of cortex like the dorsal anterior cingulate cortex (dACC) and anterior insula (AI) compute the relative value of reward options given the environment, and the DRN implements and/or facilitates changes in behavioural policy arising from relative value computations. b Psychophysiological interaction between dACC and DRN as a function of environment-type. Line and shading indicate mean ± SE of regression weight across participants; n = 27; *p < 0.05, **p < 0.01, ***p < 0.001 two-tailed.CC BY · PubMed Central

Verification

Claims the paper makes

The claims and statistics of this paper haven’t been checked yet.

Run the check — free, no account needed. It reads the open-access text and checks the sources it cites.

A few free checks a day · papers already verified open instantly · results are public

Claims other papers make about this one

Each is checked against this paper’s own text: does it say what the citing paper says it does?

Self-check

Percentages, sums and reported differences re-computed from the paper’s own numbers.

The self-check needs the paper’s full text.

Citations

Cites

Show all 86 references

Research works printed but not linked: 3

  1. Stephens, D. W. & Krebs, J. R. Foraging Theory. (Princeton University Press, Princeton, New Jersey, 1986).
  2. Kleiner, M. et al. What’s new in psychtoolbox-3. Perception 36, 1–16 (2007).
  3. Mai, J. K., Majtanik, M. & Paxinos, G. Atlas of the Human Brain. (Academic Press, Amsterdam, 2016).

Cited by

Sorted by citations

Metadata

Authors
Priestley, L., Mahmoodi, A., Reith, W. D., Khalighinejad, N., & Rushworth, M. F. S.
Affiliations
  • University of Oxford (GB)
  • Sainsbury Wellcome Centre (GB)
Corresponding author
Priestley, Luke
Venue
Nature Communications
Published
2026-02-14
Volume
17
Issue
1
Pages
1665-1665
ISSN
2041-1723 (ISSN-L)
OpenAlex
W7128918923
Cited by
3
References
86
Citations by year
2026: 3
FWCI
7.28
Type
journal article
Language
en
Open access
Locations
  • Nature Communications (publishedVersion, cc-by)
  • bioRxiv (Cold Spring Harbor Laboratory) (acceptedVersion, cc-by-nc)
  • PubMed (publishedVersion)
  • PubMed Central (publishedVersion, cc-by)
  • DOAJ (DOAJ: Directory of Open Access Journals) (submittedVersion, cc-by-sa)
Funders
  • Wellcome Trust (221794/Z/20/Z)
  • Biotechnology and Biological Sciences Research Council (BB/W003392/1, BB/W008947/1)
Topics
  • Life Sciences › Neuroscience › Cellular and Molecular Neuroscience › Neurotransmitter Receptor Influence on Behavior
  • Life Sciences › Neuroscience › Cognitive Neuroscience › Neural and Behavioral Psychology Studies
  • Life Sciences › Neuroscience › Cognitive Neuroscience › Neural dynamics and brain function
Keywords
dorsal raphe nucleus, serotonin, behavioural policy, reward valuation, foraging task, dorsal anterior cingulate cortex, anterior insula, neuromodulation, reward allocation, decision-making, human brain activity
MeSH terms
Insular Cortex, Adult, Female, Gyrus Cinguli, Humans, Magnetic Resonance Imaging, Male, Reward, Young Adult, Dorsal Raphe Nucleus

About these checks

Registry, retraction, Cites and statistics results are computed, not judged, with one exception: a printed reference that no index lists is read once by a model before it counts as a citation error. Claims are extracted by a model and kept only when their quote appears verbatim in the text; each cited source is then checked, with a model’s help, for whether it says what the claim relies on. Those verdicts can be wrong — read the claim’s quote and the cited source before relying on one.

Statistics and arithmetic are recomputed, not judged.

Confidence bands are shown only for fields calibrated on our annotated test set. None is calibrated yet, so no band is shown.

What counts as a claim ›How we measure confidence ›How we check this ›

Are you an author, or do you see a problem with this page? Request a review