Cited by 103Telomeres, Telomerase, and SenescenceSkin Protection and AgingGenetics, Aging, and Longevity in Model Organisms

The DOI matches its Crossref record; 24 of the 24 references it cites were found in a registry or an index.

Organotypic human skin culture models constructed with senescent fibroblasts show hallmarks of skin aging

Open access

Abstract

Skin aging is driven by intrinsic and extrinsic factors impacting on skin functionality with progressive age. One factor of this multifaceted process is cellular senescence, as it has recently been identified to contribute to a declining tissue functionality in old age. In the skin, senescent cells have been found to markedly accumulate with age, and thus might impact directly on skin characteristics. Especially the switch from young, extracellular matrix-building fibroblasts to a senescence-associated secretory phenotype (SASP) could alter the microenvironment in the skin drastically and therefore promote skin aging. In order to study the influence of senescence in human skin, 3D organotypic cultures are a well-suited model system. However, only few “aged” skin- equivalent (SE) models are available, requiring complex and long-term experimental setups. Here, we adapted a previously published full-thickness SE model by seeding increasing ratios of stress-induced premature senescent versus normal fibroblasts into the collagen matrix, terming these SE “senoskin”. Immunohistochemistry stainings revealed a shift in the balance between proliferation (Ki67) and differentiation (Keratin 10 and Filaggrin) of keratinocytes within our senoskin equivalents, as well as partial impairment of skin barrier function and changed surface properties. Monitoring of cytokine levels of known SASP factors confirmedly showed an upregulation in 2D cultures of senescent cells and at the time of seeding into the skin equivalent. Surprisingly, we find a blunted response of cytokines in the senoskin equivalent over time during 3D differentiation.

Overview

The claims and statistics of this paper haven’t been checked yet.

Run the check — free, no account needed. It reads the open-access text and checks the sources it cites.

A few free checks a day · papers already verified open instantly · results are public

Integrity signals

Registry

Crossref · 10.1038/s41514-020-0042-x

Cites

24 of 24 references verified0 citation errors · 0 not checkable

Statistics

Figures

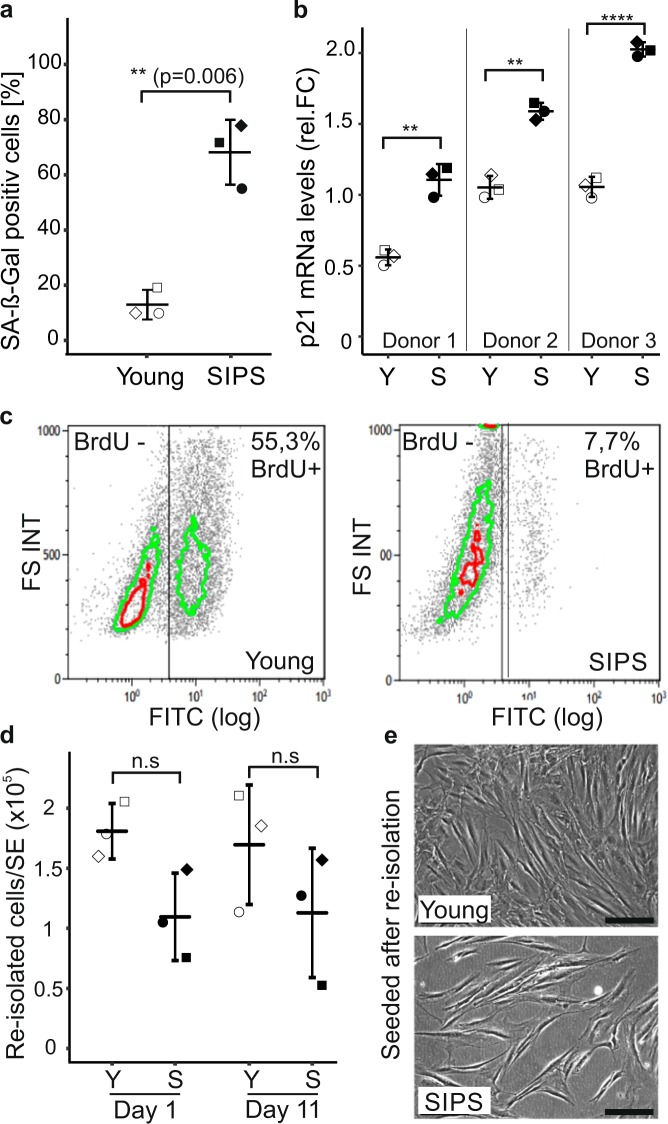
Fig. 1 Senescent fibroblasts survive in a 3D environment. a Quantification of senescence-associated beta-galactosidase (SA-β-Gal). Human dermal fibroblasts (HDF) were seeded at a density of 3500 cells/cm2 and stressed twice for 5 consecutive days with 100 µM H2O2 each (SIPS). Cells were stained for SA-β-Gal after recovery for 3 days. The percentage of SA beta-gal-positive cells was evaluated by counting images of >100 cells per condition; proliferating cells (Young) served as a control. Three biological replicates are shown; error bars indicate SD. Statistical analysis was performed using unpaired t test. n.s ≥ 0.05; *p < 0.05; **p < 0.01. Scale bar = 100 µm. b Quantification of p21 mRNA levels via qPCR. Senescent human fibroblasts were harvested, and p21 mRNA levels were analyzed by real-time PCR. Quiescent cells served as a control. GAPDH was used as housekeeping gene to normalize values. Relative foldchange was calculated by setting the mean p21 value of quiescent cells to 1. Three independent biological replicates from three different donors are shown; error bars indicate SD. Statistical analysis was performed using unpaired t test. n.s ≥ 0.05; *p < 0.05; **p < 0.01. c Induction of growth arrest by SIPS treatment. Cells were incubated for 24 h with medium containing 10 µM BrdU followed by immunolabeling with murine anti-BrdU, a FITC-labeled secondary antibody, and subsequent flow cytometric measurement. Data from one representative experiment are shown. The experiment was repeated three times each in three different donors with similar results. d, e Survival of senescent cells in skin equivalents (SEs). SEs were prepared with 100% young (Young) or 100% senescent cells (SIPS) according to the protocol. The dermal part was harvested on days 1 and 11 of the experiment, and the collagen matrix was subsequently dissolved by incubation with collagenase for 1 h at 37 °C. d The re-isolated cells were counted manually, and the total amount of cells per skin equivalent was calculated. e For re-seeding, an aliquot of the re-isolated sample was transferred into a six-well plate and incubated in fresh media for 3 days at 37 °C, 7% CO2 before pictures were taken. Three independent replicates are shown; error bars indicate SD. Statistical analysis was performed using unpaired t test. n.s ≥ 0.05; *p < 0.05; **p < 0.01. Scale bar = 100 µm.
Fig. 1 Senescent fibroblasts survive in a 3D environment. a Quantification of senescence-associated beta-galactosidase (SA-β-Gal). Human dermal fibroblasts (HDF) were seeded at a density of 3500 cells/cm2 and stressed twice for 5 consecutive days with 100 µM H2O2 each (SIPS). Cells were stained for SA-β-Gal after recovery for 3 days. The percentage of SA beta-gal-positive cells was evaluated by counting images of >100 cells per condition; proliferating cells (Young) served as a control. Three biological replicates are shown; error bars indicate SD. Statistical analysis was performed using unpaired t test. n.s ≥ 0.05; *p < 0.05; **p < 0.01. Scale bar = 100 µm. b Quantification of p21 mRNA levels via qPCR. Senescent human fibroblasts were harvested, and p21 mRNA levels were analyzed by real-time PCR. Quiescent cells served as a control. GAPDH was used as housekeeping gene to normalize values. Relative foldchange was calculated by setting the mean p21 value of quiescent cells to 1. Three independent biological replicates from three different donors are shown; error bars indicate SD. Statistical analysis was performed using unpaired t test. n.s ≥ 0.05; *p < 0.05; **p < 0.01. c Induction of growth arrest by SIPS treatment. Cells were incubated for 24 h with medium containing 10 µM BrdU followed by immunolabeling with murine anti-BrdU, a FITC-labeled secondary antibody, and subsequent flow cytometric measurement. Data from one representative experiment are shown. The experiment was repeated three times each in three different donors with similar results. d, e Survival of senescent cells in skin equivalents (SEs). SEs were prepared with 100% young (Young) or 100% senescent cells (SIPS) according to the protocol. The dermal part was harvested on days 1 and 11 of the experiment, and the collagen matrix was subsequently dissolved by incubation with collagenase for 1 h at 37 °C. d The re-isolated cells were counted manually, and the total amount of cells per skin equivalent was calculated. e For re-seeding, an aliquot of the re-isolated sample was transferred into a six-well plate and incubated in fresh media for 3 days at 37 °C, 7% CO2 before pictures were taken. Three independent replicates are shown; error bars indicate SD. Statistical analysis was performed using unpaired t test. n.s ≥ 0.05; *p < 0.05; **p < 0.01. Scale bar = 100 µm.CC BY · PubMed Central
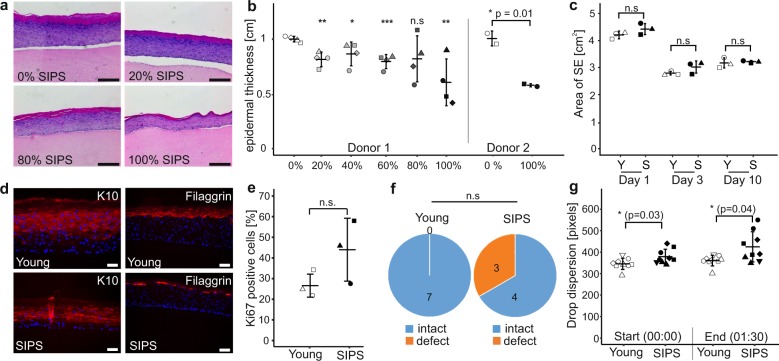
Fig. 2 Senescent fibroblasts induce hallmarks of skin aging in a 3D model. a, b Reduction of epidermal thickness in senoskin equivalents. Senoskin equivalents were built by gradually replacing proliferating with senescent fibroblasts. a Representative H&E sections of Donor 1 are shown. Scale bar 200 µm. b For each sample, relative thickness of the whole skin-equivalent section (5–7 images each) was measured using ImageJ, and mean thickness was calculated. On the left side of the graph, four independent replicates were counted for each condition in a blinded fashion; on the right side, the experiment was repeated twice in a second fibroblast donor. Statistical analysis was performed for Donor 1 using ANOVA and Dunnett post hoc test against control (0% SIPS). For Donor 2, unpaired t test was used. Error bars indicate SD. n.s ≥ 0.05; *p < 0.05; **p < 0.01. c Contractibility of the dermis is not affected by the addition of senescent fibroblasts. SEs were built either with proliferating (Young) or senescent fibroblasts (SIPS). Pictures of the SEs were taken daily, and contraction of the dermis was evaluated by measuring the total area via ImageJ. Three independent replicates from one donor are shown. Statistical analysis was performed using unpaired t test; error bars indicate SD. n.s ≥ 0.05; *p < 0.05; **p < 0.01. d Evaluation of differentiation markers in senoskin equivalents. SEs were prepared according to the protocol and analyzed for the early differentiation marker Cytokeratin 10 (d, left) and late differentiation marker Filaggrin (d, right). Representative images of one experiment are shown. Scale bar 50 µm. e Evaluation of the proliferation marker Ki67 in senoskin equivalents. SEs were prepared according to the protocol, and Ki67-positive cells were counted in three independent replicates in a blinded fashion. Percentage versus total cells in the stratum basale are given. Statistical analysis was performed using unpaired t test; error bars indicate SD. n.s ≥ 0.05; *p < 0.05; **p < 0.01. f Integrity of barrier function. SEs were prepared according to the protocol and analyzed for barrier integrity by adding a drop of biotin on top of the sample for 1 h (37 °C, 7% CO2). The SEs were then embedded in paraffin, sectioned, and counterstained with a streptavidin-Alexa488 conjugate. Integrity of barrier function was evaluated in a blinded fashion, and converted into a yes/no statement. The results from seven independent replicates from one fibroblast donor are shown. Statistical analysis was performed using Fisher’s exact test, n.s ≥ 0.05. g Evaluation of surface properties using contact-angle measurement. Skin-equivalent biopsies (6 mm) were punched out and fixed on the contact- angle measurement stage. Via a syringe, 5 µl of water was added as a drop on top of the SE, and flow/leakage was recorded via camera for 1:30 min. Pictures at the start of the experiment (0:00 min) and at the end (1:30 min) were captured, and the area of the droplet was quantified via ImageJ. Nine independent replicates from one fibroblast donor are shown. Statistical analysis was performed using unpaired t test; error bars indicate SD. n.s ≥ 0.05; *p < 0.05; **p < 0.01.
Fig. 2 Senescent fibroblasts induce hallmarks of skin aging in a 3D model. a, b Reduction of epidermal thickness in senoskin equivalents. Senoskin equivalents were built by gradually replacing proliferating with senescent fibroblasts. a Representative H&E sections of Donor 1 are shown. Scale bar 200 µm. b For each sample, relative thickness of the whole skin-equivalent section (5–7 images each) was measured using ImageJ, and mean thickness was calculated. On the left side of the graph, four independent replicates were counted for each condition in a blinded fashion; on the right side, the experiment was repeated twice in a second fibroblast donor. Statistical analysis was performed for Donor 1 using ANOVA and Dunnett post hoc test against control (0% SIPS). For Donor 2, unpaired t test was used. Error bars indicate SD. n.s ≥ 0.05; *p < 0.05; **p < 0.01. c Contractibility of the dermis is not affected by the addition of senescent fibroblasts. SEs were built either with proliferating (Young) or senescent fibroblasts (SIPS). Pictures of the SEs were taken daily, and contraction of the dermis was evaluated by measuring the total area via ImageJ. Three independent replicates from one donor are shown. Statistical analysis was performed using unpaired t test; error bars indicate SD. n.s ≥ 0.05; *p < 0.05; **p < 0.01. d Evaluation of differentiation markers in senoskin equivalents. SEs were prepared according to the protocol and analyzed for the early differentiation marker Cytokeratin 10 (d, left) and late differentiation marker Filaggrin (d, right). Representative images of one experiment are shown. Scale bar 50 µm. e Evaluation of the proliferation marker Ki67 in senoskin equivalents. SEs were prepared according to the protocol, and Ki67-positive cells were counted in three independent replicates in a blinded fashion. Percentage versus total cells in the stratum basale are given. Statistical analysis was performed using unpaired t test; error bars indicate SD. n.s ≥ 0.05; *p < 0.05; **p < 0.01. f Integrity of barrier function. SEs were prepared according to the protocol and analyzed for barrier integrity by adding a drop of biotin on top of the sample for 1 h (37 °C, 7% CO2). The SEs were then embedded in paraffin, sectioned, and counterstained with a streptavidin-Alexa488 conjugate. Integrity of barrier function was evaluated in a blinded fashion, and converted into a yes/no statement. The results from seven independent replicates from one fibroblast donor are shown. Statistical analysis was performed using Fisher’s exact test, n.s ≥ 0.05. g Evaluation of surface properties using contact-angle measurement. Skin-equivalent biopsies (6 mm) were punched out and fixed on the contact- angle measurement stage. Via a syringe, 5 µl of water was added as a drop on top of the SE, and flow/leakage was recorded via camera for 1:30 min. Pictures at the start of the experiment (0:00 min) and at the end (1:30 min) were captured, and the area of the droplet was quantified via ImageJ. Nine independent replicates from one fibroblast donor are shown. Statistical analysis was performed using unpaired t test; error bars indicate SD. n.s ≥ 0.05; *p < 0.05; **p < 0.01.CC BY · PubMed Central
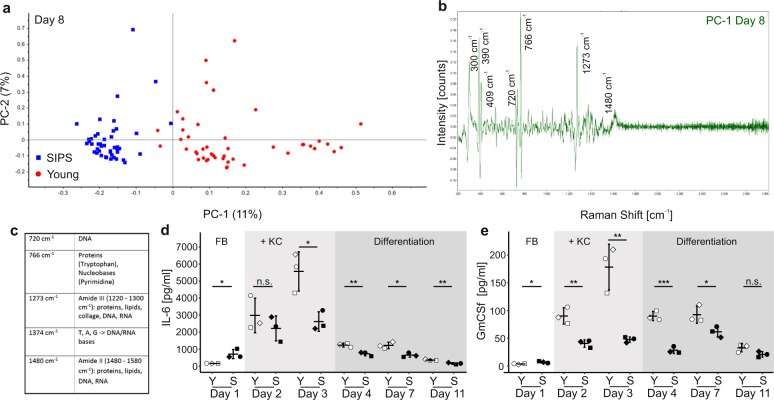
Fig. 3 Distinct changes in the chemical composition of senoskin supernatants. a–c Raman microspectroscopy discriminates between supernatants from young and senoskin models. Raman spectra were enhanced using gold nanoparticles, which were dried overnight on a glass slide, before supernatants from young or senoskin equivalents (from day 8, differentiation phase) were added. Spectra were acquired with a 785-nm laser over a range of 400–3000 cm−1. A total of 15 spectra per sample were collected; three biological samples were measured per condition. The first derivative was calculated, and after unit vector normalization, spectra were subjected to principal component analysis (PCA, a). In b, the main differences in Raman spectra of supernatants from senoskins and young skin equivalents are visualized as peaks. Panel c gives an overview of the most prominent bands and their corresponding major components. d, e Cytokine pattern in supernatants of sensoskin equivalents. IL-6 (d) and GmCSF (e) levels were analyzed in supernatants from young and senoskin equivalents via ELISA. Samples were taken on days 1, 2, 3, 4, 7, and 11, whereas the first three time points reflect the growing phase of the experiment. Keratinocytes are added on day 2. On day 4, differentiation of KCs is induced via generation of an air–liquid interface. Per condition, three independent replicates from one donor are shown. Statistical analysis was performed using unpaired t test (Bonferroni corrected); error bars indicate SD. n.s ≥ 0.05; *p < 0.05; **p < 0.01.
Fig. 3 Distinct changes in the chemical composition of senoskin supernatants. a–c Raman microspectroscopy discriminates between supernatants from young and senoskin models. Raman spectra were enhanced using gold nanoparticles, which were dried overnight on a glass slide, before supernatants from young or senoskin equivalents (from day 8, differentiation phase) were added. Spectra were acquired with a 785-nm laser over a range of 400–3000 cm−1. A total of 15 spectra per sample were collected; three biological samples were measured per condition. The first derivative was calculated, and after unit vector normalization, spectra were subjected to principal component analysis (PCA, a). In b, the main differences in Raman spectra of supernatants from senoskins and young skin equivalents are visualized as peaks. Panel c gives an overview of the most prominent bands and their corresponding major components. d, e Cytokine pattern in supernatants of sensoskin equivalents. IL-6 (d) and GmCSF (e) levels were analyzed in supernatants from young and senoskin equivalents via ELISA. Samples were taken on days 1, 2, 3, 4, 7, and 11, whereas the first three time points reflect the growing phase of the experiment. Keratinocytes are added on day 2. On day 4, differentiation of KCs is induced via generation of an air–liquid interface. Per condition, three independent replicates from one donor are shown. Statistical analysis was performed using unpaired t test (Bonferroni corrected); error bars indicate SD. n.s ≥ 0.05; *p < 0.05; **p < 0.01.CC BY · PubMed Central

Verification

Claims the paper makes

The claims and statistics of this paper haven’t been checked yet.

Run the check — free, no account needed. It reads the open-access text and checks the sources it cites.

A few free checks a day · papers already verified open instantly · results are public

Claims other papers make about this one

Each is checked against this paper’s own text: does it say what the citing paper says it does?

Self-check

Percentages, sums and reported differences re-computed from the paper’s own numbers.

The self-check needs the paper’s full text.

Citations

Cites

Show all 24 references

Cited by

Sorted by citations

See all 103

Metadata

Authors
Weinmüllner, R., Zbiral, B., Becirovic, A., Stelzer, E. M., Nagelreiter, F., Schosserer, M., Lämmermann, I., Liendl, L., Lang, M., Terlecki-Zaniewicz, L., Andriotis, O., Mildner, M., Golabi, B., Waidhofer-Söllner, P., Schedle, K., Emsenhuber, G., Thurner, P. J., Tschachler, E., Gruber, F., & Grillari, J.
Affiliations
  • BOKU University (AT)
  • Austrian Cluster for Tissue Regeneration (AT)
  • TU Wien (AT)
  • Medical University of Vienna (AT)
  • Ludwig Boltzmann Institute for Traumatology, The Research Center in Cooperation with AUVA (AT)
Corresponding author
Grillari, Johannes
Venue
npj Aging and Mechanisms of Disease
Published
2020-03-06
Volume
6
Issue
1
Pages
4-4
ISSN
2056-3973 (ISSN-L)
OpenAlex
W3009524618
Cited by
103
References
24
Citations by year
2026: 5 · 2025: 22 · 2024: 18 · 2023: 19 · 2022: 11 · 2021: 22 · 2020: 6
FWCI
8.72
Type
journal article
Language
en
Open access
Locations
  • npj Aging and Mechanisms of Disease (publishedVersion, cc-by)
  • PubMed Central (publishedVersion, cc-by)
  • PubMed (publishedVersion)
  • DOAJ (DOAJ: Directory of Open Access Journals) (submittedVersion, cc-by-sa)
Funders
  • Austrian Science Fund (FWF: I2514)
  • Christian Doppler Forschungsgesellschaft
  • PhD Programme BioToP – ‘Biomolecular technolgy of proteins’
Topics
  • Life Sciences › Biochemistry, Genetics and Molecular Biology › Cell Biology › Telomeres, Telomerase, and Senescence
  • Health Sciences › Medicine › Dermatology › Skin Protection and Aging
  • Life Sciences › Biochemistry, Genetics and Molecular Biology › Aging › Genetics, Aging, and Longevity in Model Organisms
Keywords
skin aging, cellular senescence, senescence-associated secretory phenotype, stress-induced premature senescence, fibroblasts, keratinocytes, skin barrier function, cytokines, extracellular matrix

About these checks

Registry, retraction, Cites and statistics results are computed, not judged, with one exception: a printed reference that no index lists is read once by a model before it counts as a citation error. Claims are extracted by a model and kept only when their quote appears verbatim in the text; each cited source is then checked, with a model’s help, for whether it says what the claim relies on. Those verdicts can be wrong — read the claim’s quote and the cited source before relying on one.

Statistics and arithmetic are recomputed, not judged.

Confidence bands are shown only for fields calibrated on our annotated test set. None is calibrated yet, so no band is shown.

What counts as a claim ›How we measure confidence ›How we check this ›

Are you an author, or do you see a problem with this page? Request a review