Cited by 1Effects of Radiation ExposureGenetics, Aging, and Longevity in Model OrganismsTelomeres, Telomerase, and Senescence

The DOI matches its Crossref record; 5 of the 5 references it cites were found in a registry or an index.

Spontaneous p53 activation in middle-aged C57BL/6 mice mitigates the lifespan-extending adaptive response induced by low-dose ionizing radiation

Open access

Published version of a preprint

Abstract

Understanding the biological effects of low-dose (<100 mGy) ionizing radiation (LDR) is technically challenging. We investigated age-dependent LDR effects using adaptive response experiments in young (7-to 12-week-old) and middle-aged (40-to 62-week-old) C57BL/6 mice. Compared with 3 Gy irradiation, 0.02 Gy preirradiation followed by 3 Gy irradiation prolonged life in young mice but not middle-aged mice. Preirradiation also suppressed irradiation-induced 53BP1 repair foci in the small intestines, splenic apoptosis, and p53 activity in young mice but not middle-aged mice. Young p53 +/− C57BL/6 mice did not show these adaptive responses, indicating that insufficient p53 function in young mice mitigated the adaptive responses. Interestingly, p53 activation in middle-aged mice spontaneously became approximately 4.5-fold greater than that in young mice, possibly masking LDR stresses. Furthermore, adaptive responses in young mice, but not in middle-aged mice, suppressed some senescence-associated secretory phenotype (SASP) factors ( IL-6, CCL2 , CCL5 , CXCL1 ). Thus, LDR-induced adaptive responses associated with specific SASP factors may be attenuated by a combination of reduced DNA damage sensor/transducer function and chronic p53 activation in middle-aged mice.

Overview

The claims and statistics of this paper haven’t been checked yet.

Run the check — free, no account needed. It reads the open-access text and checks the sources it cites.

A few free checks a day · papers already verified open instantly · results are public

Integrity signals

Registry

Crossref · 10.1038/s41514-023-00123-3

Cites

5 of 5 references verified0 citation errors · 0 not checkable

Statistics

Figures

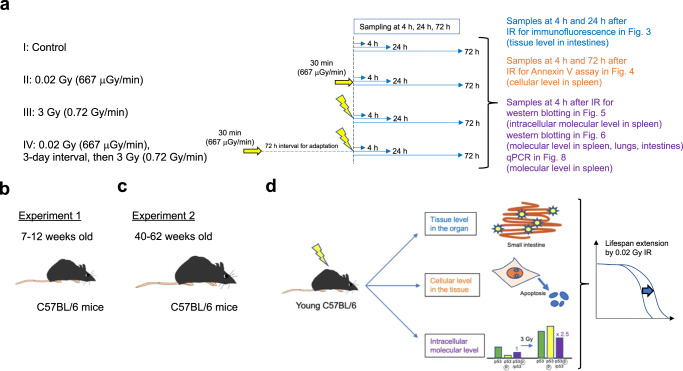
Fig. 1 Overview of the experimental process for determining the adaptive response in C57BL/6 mice. a Four different conditions were set: I. Nonirradiated controls; II. 0.02 Gy (100 µGy/min)-irradiated mice; III. 3 Gy (0.72 Gy/min)-irradiated mice; and IV. 0.02 Gy-preirradiated, 72-h interval, 3 Gy-irradiated mice. The timing of sacrifice for the four groups was the same. Specifically, group IV mice were preirradiated with 0.02 Gy at 3 days before 3 Gy irradiation, and both group III mice and group IV mice were irradiated with 3 Gy on the day of sacrifice. After the last IR exposure, we collected samples at 4 h, 24 h, and 72 h and analyzed them. The experiment at the tissue level in the intestines (blue) was conducted 4 h and 24 h after the final IR exposure. The experiment at the cellular level in the spleen (orange) was conducted 4 h and 72 h after the final IR exposure. The experiment at the intracellular molecular level (purple) was conducted 4 h after the final IR exposure. The time scale is not exactly drawn. The same experiments were conducted in (b) 7 to 12-week-old (young) C57BL/6 mice as experiment 1 and (c) 40 to 62-week-old (middle-aged) C57BL/6 mice as experiment 2. d Comparison of these mice to assess the different biological outcomes at the tissue, cellular, and intracellular molecular levels. These outcomes can be discussed in the context of the lifespan-extending adaptive response induced by very low-dose IR.
Fig. 1 Overview of the experimental process for determining the adaptive response in C57BL/6 mice. a Four different conditions were set: I. Nonirradiated controls; II. 0.02 Gy (100 µGy/min)-irradiated mice; III. 3 Gy (0.72 Gy/min)-irradiated mice; and IV. 0.02 Gy-preirradiated, 72-h interval, 3 Gy-irradiated mice. The timing of sacrifice for the four groups was the same. Specifically, group IV mice were preirradiated with 0.02 Gy at 3 days before 3 Gy irradiation, and both group III mice and group IV mice were irradiated with 3 Gy on the day of sacrifice. After the last IR exposure, we collected samples at 4 h, 24 h, and 72 h and analyzed them. The experiment at the tissue level in the intestines (blue) was conducted 4 h and 24 h after the final IR exposure. The experiment at the cellular level in the spleen (orange) was conducted 4 h and 72 h after the final IR exposure. The experiment at the intracellular molecular level (purple) was conducted 4 h after the final IR exposure. The time scale is not exactly drawn. The same experiments were conducted in (b) 7 to 12-week-old (young) C57BL/6 mice as experiment 1 and (c) 40 to 62-week-old (middle-aged) C57BL/6 mice as experiment 2. d Comparison of these mice to assess the different biological outcomes at the tissue, cellular, and intracellular molecular levels. These outcomes can be discussed in the context of the lifespan-extending adaptive response induced by very low-dose IR.CC BY · PubMed Central
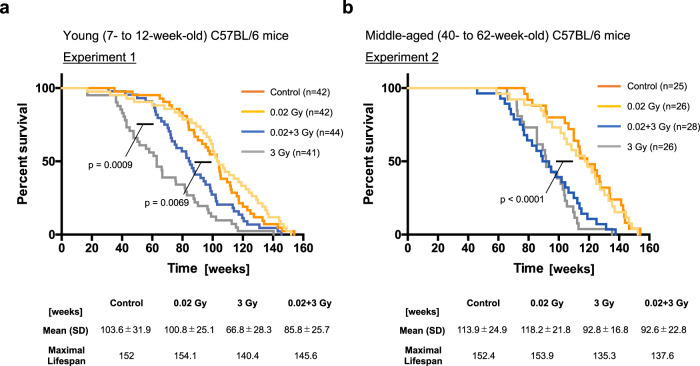
Fig. 2 Kaplan‒Meier survival curves of experiments 1 and 2. Moribund mice were euthanized via cervical dislocation and necropsied. Gehan‒Breslow‒Wilcoxon tests were used to calculate the significance of the survival curves. Each experiment was conducted several times with different numbers of mice, and the total result is shown. Time 0 indicates the point at which the mouse was born. a Kaplan‒Meier survival curves of the young (7- to 12-week-old) control C57BL/6 mice (n = 42), 0.02 Gy-exposed mice (n = 42), 0.02 Gy + 3 Gy-exposed mice (n = 44) and 3 Gy-exposed mice (n = 41) are shown. The number of cohorts in each group was eight for the control group, four for the 0.02 Gy group, eight for the 3 Gy group, and four for the 0.02 + 3 Gy group. b Kaplan‒Meier survival curves of the middle-aged (40- to 62-week-old) control C57BL/6 mice (n = 25), 0.02 Gy-exposed mice (n = 26), 0.02 Gy + 3 Gy-exposed mice (n = 28) and 3 Gy-exposed mice (n = 26). The number of cohorts in each group was four for the control group, three for the 0.02 Gy group, five for the 3 Gy group, and four for the 0.02 + 3 Gy group.
Fig. 2 Kaplan‒Meier survival curves of experiments 1 and 2. Moribund mice were euthanized via cervical dislocation and necropsied. Gehan‒Breslow‒Wilcoxon tests were used to calculate the significance of the survival curves. Each experiment was conducted several times with different numbers of mice, and the total result is shown. Time 0 indicates the point at which the mouse was born. a Kaplan‒Meier survival curves of the young (7- to 12-week-old) control C57BL/6 mice (n = 42), 0.02 Gy-exposed mice (n = 42), 0.02 Gy + 3 Gy-exposed mice (n = 44) and 3 Gy-exposed mice (n = 41) are shown. The number of cohorts in each group was eight for the control group, four for the 0.02 Gy group, eight for the 3 Gy group, and four for the 0.02 + 3 Gy group. b Kaplan‒Meier survival curves of the middle-aged (40- to 62-week-old) control C57BL/6 mice (n = 25), 0.02 Gy-exposed mice (n = 26), 0.02 Gy + 3 Gy-exposed mice (n = 28) and 3 Gy-exposed mice (n = 26). The number of cohorts in each group was four for the control group, three for the 0.02 Gy group, five for the 3 Gy group, and four for the 0.02 + 3 Gy group.CC BY · PubMed Central
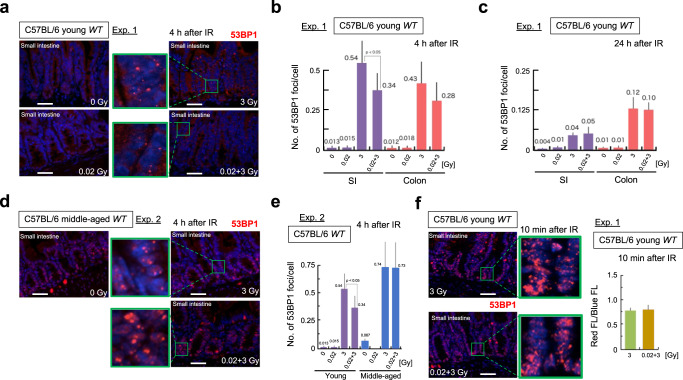
Fig. 3 DNA damage kinetics after IR exposure in mouse intestines in experiment 1 and experiment 2. Scale bars 0.1 mm. a Representative images of 53BP1 foci (red) and DAPI (blue) at 4 h after IR exposure in the crypts of young C57BL/6 mice. The enlarged images are shown in green next to the original images. b Numbers of 53BP1 foci per cell at 4 h after IR exposure in young C57BL/6 mice. Five mice per condition were used, and data were obtained at 10 randomly selected sites. The data show the mean (s.d.). The p values were determined by the two-tailed t test. c Numbers of 53BP1 foci per cell at 24 h after IR in young C57BL/6 mice. Five mice per condition were used, and the data were obtained at 10 randomly selected sites. The data show the mean (s.d.). The p values were determined by the two-tailed t test. d Representative images of 53BP1 foci (red) and DAPI (blue) at 4 h after IR exposure in the crypts of middle-aged C57BL/6 mice. e Comparison of the numbers of 53BP1 foci per cell at 4 h after IR exposure in young and middle-aged C57BL/6 mice. Five mice per condition were used, and the data were obtained at 10 randomly selected sites. The data show the mean (s.d.). The p values were determined by the two-tailed t test. f The numbers of 53BP1 foci per cell at 10 min (immediately) after IR exposure in young C57BL/6 mice. The numbers of 53BP1 foci (red FL) per cell (blue FL) at 10 min after IR 3 Gy and 0.02 + 3 Gy in young C57BL/6 mice are shown. Five mice per condition were used, and the data were obtained at 10 randomly selected sites.
Fig. 3 DNA damage kinetics after IR exposure in mouse intestines in experiment 1 and experiment 2. Scale bars 0.1 mm. a Representative images of 53BP1 foci (red) and DAPI (blue) at 4 h after IR exposure in the crypts of young C57BL/6 mice. The enlarged images are shown in green next to the original images. b Numbers of 53BP1 foci per cell at 4 h after IR exposure in young C57BL/6 mice. Five mice per condition were used, and data were obtained at 10 randomly selected sites. The data show the mean (s.d.). The p values were determined by the two-tailed t test. c Numbers of 53BP1 foci per cell at 24 h after IR in young C57BL/6 mice. Five mice per condition were used, and the data were obtained at 10 randomly selected sites. The data show the mean (s.d.). The p values were determined by the two-tailed t test. d Representative images of 53BP1 foci (red) and DAPI (blue) at 4 h after IR exposure in the crypts of middle-aged C57BL/6 mice. e Comparison of the numbers of 53BP1 foci per cell at 4 h after IR exposure in young and middle-aged C57BL/6 mice. Five mice per condition were used, and the data were obtained at 10 randomly selected sites. The data show the mean (s.d.). The p values were determined by the two-tailed t test. f The numbers of 53BP1 foci per cell at 10 min (immediately) after IR exposure in young C57BL/6 mice. The numbers of 53BP1 foci (red FL) per cell (blue FL) at 10 min after IR 3 Gy and 0.02 + 3 Gy in young C57BL/6 mice are shown. Five mice per condition were used, and the data were obtained at 10 randomly selected sites.CC BY · PubMed Central
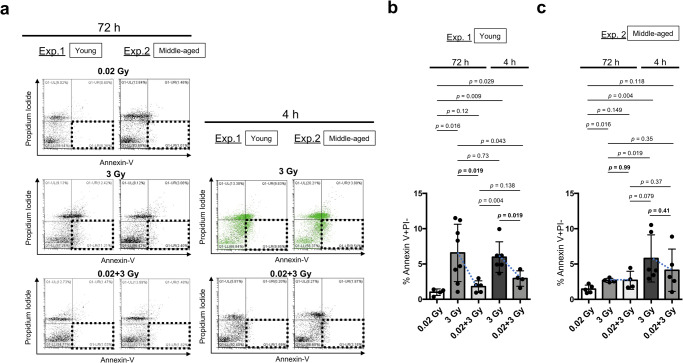
Fig. 4 Apoptosis induction in splenocytes after IR exposure in experiment 1 and experiment 2. a Representative images of apoptosis induction (PI negative, Annexin-V positive; dotted squares) in all the examined groups based on FACS analysis. The apoptosis induction ratio at 72 h after 0.02 Gy irradiation was used as a control. We observed continuous apoptosis in young C57BL/6 mice 72 h after 3 Gy. To visually distinguish the adaptive response between 3 Gy and 0.02 + 3 Gy at 4 h after IR, the results for the 3 Gy-exposed group at 4 h after IR group are shown in green. b Percentages of apoptosis induction (PI negative, Annexin-V positive) in young C57BL/6 mice subjected to different treatments (four mice: 72 h after 0.02 Gy, eight mice: 72 h after 3 Gy, five mice: 72 h after 0.02 + 3 Gy, six mice: 4 h after 3 Gy, and four mice: 4 h after 0.02 + 3 Gy). The data show the mean (s.d.). The p values were determined by Welch’s t test or Mann–Whitney U test. c The percentages of apoptosis induction (PI negative, Annexin-V positive) in middle-aged C57BL/6 mice subjected to different treatments (five mice: 72 h after 0.02 Gy, four mice: 72 h after 3 Gy, four mice: 72 h after 0.02 + 3 Gy, six mice: 4 h after 3 Gy, and five mice: 4 h after 0.02 + 3 Gy). The data show the mean (s.d.). The p values were determined by Welch’s t test or Mann–Whitney U test.
Fig. 4 Apoptosis induction in splenocytes after IR exposure in experiment 1 and experiment 2. a Representative images of apoptosis induction (PI negative, Annexin-V positive; dotted squares) in all the examined groups based on FACS analysis. The apoptosis induction ratio at 72 h after 0.02 Gy irradiation was used as a control. We observed continuous apoptosis in young C57BL/6 mice 72 h after 3 Gy. To visually distinguish the adaptive response between 3 Gy and 0.02 + 3 Gy at 4 h after IR, the results for the 3 Gy-exposed group at 4 h after IR group are shown in green. b Percentages of apoptosis induction (PI negative, Annexin-V positive) in young C57BL/6 mice subjected to different treatments (four mice: 72 h after 0.02 Gy, eight mice: 72 h after 3 Gy, five mice: 72 h after 0.02 + 3 Gy, six mice: 4 h after 3 Gy, and four mice: 4 h after 0.02 + 3 Gy). The data show the mean (s.d.). The p values were determined by Welch’s t test or Mann–Whitney U test. c The percentages of apoptosis induction (PI negative, Annexin-V positive) in middle-aged C57BL/6 mice subjected to different treatments (five mice: 72 h after 0.02 Gy, four mice: 72 h after 3 Gy, four mice: 72 h after 0.02 + 3 Gy, six mice: 4 h after 3 Gy, and five mice: 4 h after 0.02 + 3 Gy). The data show the mean (s.d.). The p values were determined by Welch’s t test or Mann–Whitney U test.CC BY · PubMed Central
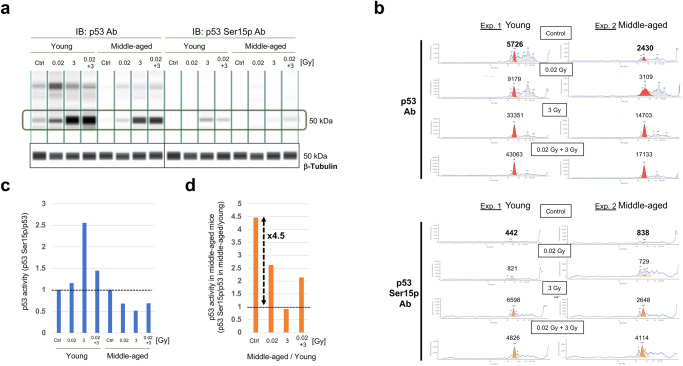
Fig. 5 Quantification of p53 activity in the spleen at 4 h after IR by simple western blotting in experiment 1 and experiment 2. To avoid individual differences, the same amount of protein was obtained from four independent mice under each condition. a Simple western blotting images of p53 (left) and p53 with serine 15 phosphorylation (Ser15p, right) under four different conditions in young and middle-aged C57BL/6 mice. Simple western blotting images of β-Tubulin as determined using the same samples from four different conditions in young and middle-aged C57BL/6 mice as a loading control. b Quantification of p53 (upper, red) and p53 Ser15p (lower, orange) under four different conditions (control, 0.02 Gy, 3 Gy, and 0.02 + 3 Gy) in young (left) and middle-aged (right) C57BL/6 mice. c Relative p53 activity was calculated as the p53 Ser15p level divided by the total p53 expression level in young (left) and middle-aged (right) C57BL/6 mice. Specifically, we calculated 442/5726 (=0.077), 821/9179 (=0.089), 6598/33351 (=0.198), and 4826/43063 (=0.112) for the control group, 0.02 Gy group, 3 Gy group, 0.02 + 3 Gy group, respectively, in young mice. Then, we normalized to obtain 1 for the control group, 1.16 (0.089/0.077) for the 0.02 Gy group, 2.57 (0.198/0.077) for the 3 Gy group, and 1.45 (0.112/0.077) for the 0.02 + 3 Gy group, to assess the effects of the adaptive response. d As we noticed spontaneous p53 activation in middle-aged C57BL/6 mice, we calculated the relative p53 activation in middle-aged C57BL/6 mice compared with young C57BL/6 mice. Specifically, we calculated 442/5726 (=0.077) and 838/2430 (=0.345) for young and middle-aged control samples, respectively. Then, we calculated 4.48 (0.345/0.077) as the relative activation in middle-aged mice compared with young mice.
Fig. 5 Quantification of p53 activity in the spleen at 4 h after IR by simple western blotting in experiment 1 and experiment 2. To avoid individual differences, the same amount of protein was obtained from four independent mice under each condition. a Simple western blotting images of p53 (left) and p53 with serine 15 phosphorylation (Ser15p, right) under four different conditions in young and middle-aged C57BL/6 mice. Simple western blotting images of β-Tubulin as determined using the same samples from four different conditions in young and middle-aged C57BL/6 mice as a loading control. b Quantification of p53 (upper, red) and p53 Ser15p (lower, orange) under four different conditions (control, 0.02 Gy, 3 Gy, and 0.02 + 3 Gy) in young (left) and middle-aged (right) C57BL/6 mice. c Relative p53 activity was calculated as the p53 Ser15p level divided by the total p53 expression level in young (left) and middle-aged (right) C57BL/6 mice. Specifically, we calculated 442/5726 (=0.077), 821/9179 (=0.089), 6598/33351 (=0.198), and 4826/43063 (=0.112) for the control group, 0.02 Gy group, 3 Gy group, 0.02 + 3 Gy group, respectively, in young mice. Then, we normalized to obtain 1 for the control group, 1.16 (0.089/0.077) for the 0.02 Gy group, 2.57 (0.198/0.077) for the 3 Gy group, and 1.45 (0.112/0.077) for the 0.02 + 3 Gy group, to assess the effects of the adaptive response. d As we noticed spontaneous p53 activation in middle-aged C57BL/6 mice, we calculated the relative p53 activation in middle-aged C57BL/6 mice compared with young C57BL/6 mice. Specifically, we calculated 442/5726 (=0.077) and 838/2430 (=0.345) for young and middle-aged control samples, respectively. Then, we calculated 4.48 (0.345/0.077) as the relative activation in middle-aged mice compared with young mice.CC BY · PubMed Central
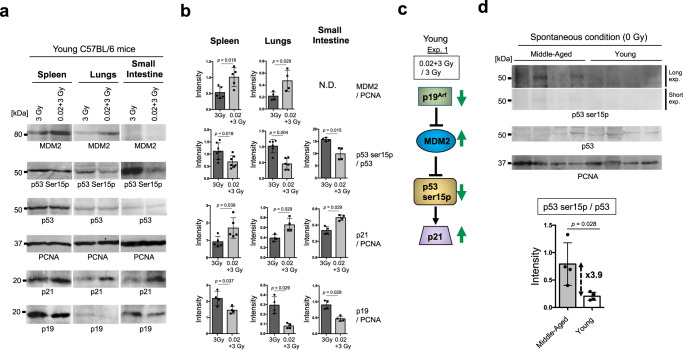
Fig. 6 p53 activity and proteins involved upstream and downstream of the p53 pathway in the spleen, lungs and SI at 4 h post-IR exposure were quantified by standard western blotting in experiment 1. a Western blotting images of MDM2 (top), p53 Ser15p (second from top), p53 (third from top), PCNA (third from bottom), p21 (second from bottom), and p19ARF (bottom) in young C57BL/6 mice under 3 Gy or 0.02 + 3 Gy conditions. b Quantification of p53 Ser15p divided by p53 under 3 Gy or 0.02 + 3 Gy conditions. Quantification of p19ARF, MDM2, and p21 divided by PCNA under 3 Gy or 0.02 + 3 Gy conditions. The data show the mean (s.d.). The p values were determined by Welch’s t test or Mann–Whitney U test. c Simplified model of the p53 activation pathway. In the p53 upstream pathway, MDM2 can ubiquitinate p53 for degradation by the proteome16, which is inhibited by p19ARF15. p21 is activated by p5318. Arrow: activation; Bar: inhibition. The green arrows indicate the changes in the 0.02 + 3 Gy group compared with the 3 Gy group in the young C57BL/6 mice. d Western blotting images of p53 Ser15p (top: long exposure; middle top: short exposure), p53 (middle bottom), and PCNA (bottom) in four independent samples from aged and young C57BL/6 mice under spontaneous conditions. All blots derive from the same experiment and were processed in parallel. Quantification of p53 Ser15p divided by p53 under spontaneous conditions. The data show the mean (s.d.). The p values were determined by Mann–Whitney U test.
Fig. 6 p53 activity and proteins involved upstream and downstream of the p53 pathway in the spleen, lungs and SI at 4 h post-IR exposure were quantified by standard western blotting in experiment 1. a Western blotting images of MDM2 (top), p53 Ser15p (second from top), p53 (third from top), PCNA (third from bottom), p21 (second from bottom), and p19ARF (bottom) in young C57BL/6 mice under 3 Gy or 0.02 + 3 Gy conditions. b Quantification of p53 Ser15p divided by p53 under 3 Gy or 0.02 + 3 Gy conditions. Quantification of p19ARF, MDM2, and p21 divided by PCNA under 3 Gy or 0.02 + 3 Gy conditions. The data show the mean (s.d.). The p values were determined by Welch’s t test or Mann–Whitney U test. c Simplified model of the p53 activation pathway. In the p53 upstream pathway, MDM2 can ubiquitinate p53 for degradation by the proteome16, which is inhibited by p19ARF15. p21 is activated by p5318. Arrow: activation; Bar: inhibition. The green arrows indicate the changes in the 0.02 + 3 Gy group compared with the 3 Gy group in the young C57BL/6 mice. d Western blotting images of p53 Ser15p (top: long exposure; middle top: short exposure), p53 (middle bottom), and PCNA (bottom) in four independent samples from aged and young C57BL/6 mice under spontaneous conditions. All blots derive from the same experiment and were processed in parallel. Quantification of p53 Ser15p divided by p53 under spontaneous conditions. The data show the mean (s.d.). The p values were determined by Mann–Whitney U test.CC BY · PubMed Central
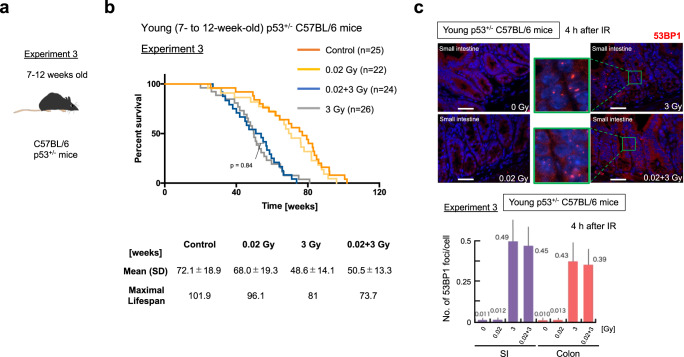
Fig. 7 Evaluation of p53 function for adaptive responses in young C57BL/6 mice using heterogeneously p53-inactivated C57BL/6 mice. The experiments were conducted in (a) 7 to 12-week-old young p53+/− C57BL/6 mice as experiment 3. b Kaplan‒Meier survival curves of experiments 3. Gehan‒Breslow‒Wilcoxon tests were used to calculate the significance of the survival curves. Each experiment was conducted several times with different numbers of mice, and the total result is shown. Time 0 indicates the point at which the mouse was born. c Representative images of 53BP1 foci (red) and DAPI (blue) at 4 h after IR exposure in the crypts of young p53+/− C57BL/6 mice. Scale bars 0.1 mm. The enlarged images are shown in green next to the original images. The numbers of 53BP1 foci per cell at 4 h after IR exposure in young p53+/− C57BL/6 mice are shown below the images. Five mice per condition were used, and data were obtained at 10 randomly selected sites. The data show the mean (s.d.). The p values were determined by the two-tailed t test.
Fig. 7 Evaluation of p53 function for adaptive responses in young C57BL/6 mice using heterogeneously p53-inactivated C57BL/6 mice. The experiments were conducted in (a) 7 to 12-week-old young p53+/− C57BL/6 mice as experiment 3. b Kaplan‒Meier survival curves of experiments 3. Gehan‒Breslow‒Wilcoxon tests were used to calculate the significance of the survival curves. Each experiment was conducted several times with different numbers of mice, and the total result is shown. Time 0 indicates the point at which the mouse was born. c Representative images of 53BP1 foci (red) and DAPI (blue) at 4 h after IR exposure in the crypts of young p53+/− C57BL/6 mice. Scale bars 0.1 mm. The enlarged images are shown in green next to the original images. The numbers of 53BP1 foci per cell at 4 h after IR exposure in young p53+/− C57BL/6 mice are shown below the images. Five mice per condition were used, and data were obtained at 10 randomly selected sites. The data show the mean (s.d.). The p values were determined by the two-tailed t test.CC BY · PubMed Central
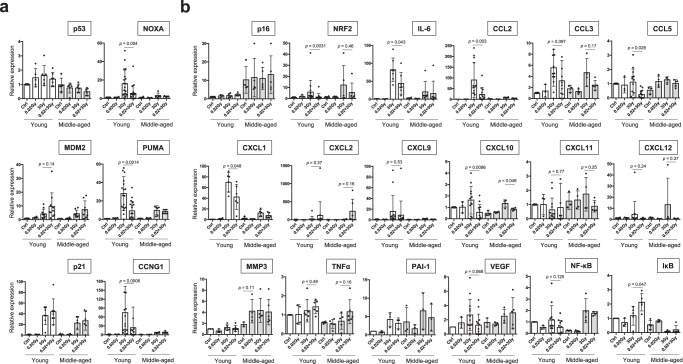
Fig. 8 Relative mRNA expression levels of p53-related genes and SASP genes in the spleen. All mRNA expression was calculated relative to the expression of housekeeping gene (GAPDH), and the mRNA expression levels in young control mice are shown as 1. Each dot indicates the result for an individual mouse. The data show the mean (s.d.). The p values were determined by Welch’s t test or Mann–Whitney U test. a mRNA expression levels of p53-related factors, with MDM2 and p21 as direct regulators, CCNG1 as a cell cycle factor, and NOXA and PUMA as apoptosis-inducing factors. b mRNA expression levels of the senescence biomarker p16, the hormesis-related transcription factor NRF2, and SASP markers (IL-6, CCL2, CCL3, CCL5, CXCL1, CXCL2, CXCL9, CXCL10, CXCL11, MMP3, NF-κB, PAI-1, TNFα, VEGF) along with the NF-κB inhibitor IκB.
Fig. 8 Relative mRNA expression levels of p53-related genes and SASP genes in the spleen. All mRNA expression was calculated relative to the expression of housekeeping gene (GAPDH), and the mRNA expression levels in young control mice are shown as 1. Each dot indicates the result for an individual mouse. The data show the mean (s.d.). The p values were determined by Welch’s t test or Mann–Whitney U test. a mRNA expression levels of p53-related factors, with MDM2 and p21 as direct regulators, CCNG1 as a cell cycle factor, and NOXA and PUMA as apoptosis-inducing factors. b mRNA expression levels of the senescence biomarker p16, the hormesis-related transcription factor NRF2, and SASP markers (IL-6, CCL2, CCL3, CCL5, CXCL1, CXCL2, CXCL9, CXCL10, CXCL11, MMP3, NF-κB, PAI-1, TNFα, VEGF) along with the NF-κB inhibitor IκB.CC BY · PubMed Central
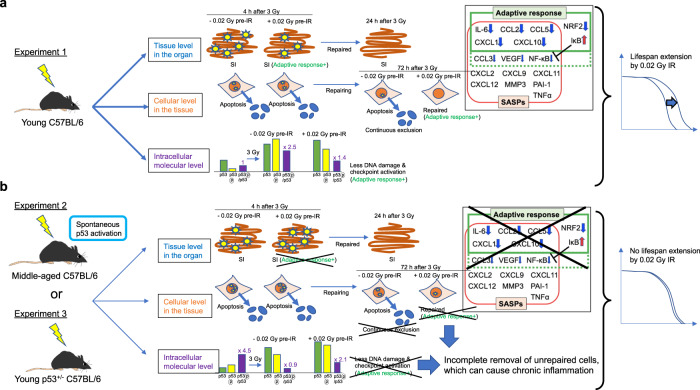
Fig. 9 Graphical summary of the findings obtained in this study. a The reduced DNA damage at the tissue level (blue) and the subsequently reduced requirement of the DNA repair machinery at the intracellular molecular level (purple) may reflect adaptation to worse DNA damage in young C57BL/6 mice. In addition, continuous elimination of damaged cells by apoptosis at the cellular level in the tissue (orange) occurs in young C57BL/6 mice. Moreover, during the adaptive response in young mice, the mRNA levels of some SASP factors, such as IL-6, CCL2, and CXCL1, are decreased, while the mRNA levels of IκB, which is essential for NFκB suppression, are increased (boxed figure). Combined, these responses result in lifespan extension after exposure to very low doses of IR in young C57BL/6 mice (right). b Worse DNA damage at the tissue level (blue) but subsequent exhaustion of the DNA repair machinery at the intracellular molecular level (purple) may reflect much less adaptation to worse DNA damage in middle-aged C57BL/6 mice than in young C57BL/6 mice. Continuous elimination of damaged cells by apoptosis at the cellular level (orange) is not observed in middle-aged C57BL/6 mice. Combined, these results suggest that there is no lifespan extension induced by very low doses of IR in middle-aged C57BL/6 mice as a consequence of the chronic inflammation of unrepaired cells (right).
Fig. 9 Graphical summary of the findings obtained in this study. a The reduced DNA damage at the tissue level (blue) and the subsequently reduced requirement of the DNA repair machinery at the intracellular molecular level (purple) may reflect adaptation to worse DNA damage in young C57BL/6 mice. In addition, continuous elimination of damaged cells by apoptosis at the cellular level in the tissue (orange) occurs in young C57BL/6 mice. Moreover, during the adaptive response in young mice, the mRNA levels of some SASP factors, such as IL-6, CCL2, and CXCL1, are decreased, while the mRNA levels of IκB, which is essential for NFκB suppression, are increased (boxed figure). Combined, these responses result in lifespan extension after exposure to very low doses of IR in young C57BL/6 mice (right). b Worse DNA damage at the tissue level (blue) but subsequent exhaustion of the DNA repair machinery at the intracellular molecular level (purple) may reflect much less adaptation to worse DNA damage in middle-aged C57BL/6 mice than in young C57BL/6 mice. Continuous elimination of damaged cells by apoptosis at the cellular level (orange) is not observed in middle-aged C57BL/6 mice. Combined, these results suggest that there is no lifespan extension induced by very low doses of IR in middle-aged C57BL/6 mice as a consequence of the chronic inflammation of unrepaired cells (right).CC BY · PubMed Central

Verification

Claims the paper makes

The claims and statistics of this paper haven’t been checked yet.

Run the check — free, no account needed. It reads the open-access text and checks the sources it cites.

A few free checks a day · papers already verified open instantly · results are public

Self-check

Percentages, sums and reported differences re-computed from the paper’s own numbers.

The self-check needs the paper’s full text.

Citations

Cites

Research works printed but not linked: 45

  1. Tang, F. R., Loke, W. K. & Khoo, B. C. Low-dose or low-dose-rate ionizing radiation–induced bioeffects in animal models. J. Radiat. Res. 58, 165–182 (2017). · DOI
  2. Shadley, J. D., Afzal, V. & Wolff, S. Characterization of the adaptive response to ionizing radiation induced by low doses of X rays to human lymphocytes. Radiat. Res. 111, 511–517 (1987). · DOI
  3. Mattson, M. P. Hormesis defined. Ageing Res. Rev. 7, 1–7 (2008). · DOI · Paper page
  4. Day, T. K. et al. Extremely low priming doses of X radiation induce an adaptive response for chromosomal inversions in pKZ1 mouse prostate. Radiat. Res. 166, 757–766 (2006). · DOI
  5. Okazaki, R., Ootsuyama, A. & Norimura, T. TP53 and TP53-related genes associated with protection from apoptosis in the radioadaptive response. Radiat. Res. 167, 51–57 (2007). · DOI
  6. Okazaki, R. Role of p53 in regulating radiation responses. Life (Basel) 12, 1099 (2022).
  7. Kakinuma, S., Yamauchi, K., Amasaki, Y., Nishimura, M. & Shimada, Y. Low-dose radiation attenuates chemical mutagenesis in vivo. J. Radiat. Res. 50, 401–405 (2009). · DOI
  8. Canman, C. E. et al. Activation of the ATM kinase by ionizing radiation and phosphorylation of p53. Science 281, 1677–1679 (1998). · DOI · Paper page
  9. Yogosawa, S. & Yoshida, K. Tumor suppressive role for kinases phosphorylating p53 in DNA damage-induced apoptosis. Cancer Sci. 109, 3376–3382 (2018). · DOI
  10. Armata, H. L., Garlick, D. S. & Sluss, H. K. The ataxia telangiectasia-mutated target site Ser18 is required for p53-mediated tumor suppression. Cancer Res. 67, 11696–11703 (2007). · DOI
  11. Feng, Z. et al. Declining p53 function in the aging process: a possible mechanism for the increased tumor incidence in older populations. Proc. Natl Acad. Sci. USA. 104, 16633–16638 (2007). · DOI · Paper page
  12. Royds, J. A. & Iacopetta, B. p53 and disease: when the guardian angel fails. Cell Death Differ. 13, 1017–1026 (2016). · DOI
  13. Donehower, L. A. et al. Mice deficient for p53 are developmentally normal but susceptible to spontaneous tumours. Nature 356, 215–221 (1992). · DOI · Paper page
  14. Kohzaki, M., Ootsuyama, A., Umata, T. & Okazaki, R. Comparison of the fertility of tumor suppressor gene-deficient C57BL/6 mouse strains reveals stable reproductive aging and novel pleiotropic gene. Sci. Rep. 11, 12357 (2021). · DOI
  15. Sherr, C. J. The INK4a/ARF network in tumour suppression. Nat. Rev. Mol. Cell Biol. 2, 731–737 (2001). · DOI
  16. Zhang, Y., Xiong, Y. & Yarbrough, W. G. ARF promotes MDM2 degradation and stabilizes p53: ARF-INK4a locus deletion impairs both the Rb and p53 tumor suppression pathways. Cell 92, 725–734 (1998). · DOI · Paper page
  17. Momand, J., Zambetti, G. P., Olson, D. C., George, D. & Levine, A. J. The mdm-2 oncogene product forms a complex with the p53 protein and inhibits p53-mediated transactivation. Cell 69, 1237–1245 (1992). · DOI · Paper page
  18. el-Deiry, W. S. et al. WAF1, a potential mediator of p53 tumor suppression. Cell 75, 817–825 (1993). · DOI · Paper page
  19. Aubrey, B. J., Kelly, G. L., Janic, A., Herold, M. J. & Strasser, A. How does p53 induce apoptosis and how does this relate to p53-mediated tumour suppression? Cell Death Differ. 25, 104–113 (2018). · DOI · Paper page
  20. McBride, W. H. & Schaue, D. Radiation‐induced tissue damage and response. J. Pathol. 250, 647–655 (2020). · DOI · Paper page
  21. Otsuka, K. & Suzuki, K. Differences in radiation dose response between small and large intestinal crypts. Radiat. Res. 186, 302–314 (2016). · DOI
  22. Schultz, L. B., Chehab, N. H., Malikzay, A. & Halazonetis, T. D. p53 binding protein 1 (53BP1) is an early participant in the cellular response to DNA double-strand breaks. J. Cell Biol. 151, 1381–1390 (2000). · DOI
  23. Greene, M. A. & Loeser, R. F. Aging-related inflammation in osteoarthritis. Osteoarthritis Cartilage 23, 1966–1971 (2015). · DOI
  24. Coppé, J. P., Desprez, P. Y., Krtolica, A. & Campisi, J. The senescence-associated secretory phenotype: the dark side of tumor suppression. Annu. Rev. Pathol. 5, 99–118 (2010). · DOI · Paper page
  25. Feinendegen, L. E. Evidence for beneficial low level radiation effects and radiation hormesis. Br. J. Radiol. 78, 3–7 (2005). · DOI
  26. Rayess, H., Wang, M. B. & Srivatsan, E. S. Cellular senescence and tumor suppressor gene p16. Int. J. Cancer 130, 1715–1725 (2012). · DOI · Paper page
  27. Olivieri, G., Bodycote, J. & Wolff, S. Adaptive response of human lymphocytes to low concentrations of radioactive thymidine. Science 223, 594–597 (1984). · DOI
  28. Wolff, S. The adaptive response in radiobiology: evolving insights and implications. Environ. Health Perspect. 106, 277–283 (1998).
  29. Preston, R. J. Bystander effects, genomic instability, adaptive response, and cancer risk assessment for radiation and chemical exposures. Toxicol. Appl. Pharmacol. 207, 550–556 (2205). · DOI
  30. Jiang, B. et al. Adaptive response in mice exposed to 900 MHz radiofrequency fields: primary DNA damage. PLoS One 7, e32040 (2012). · DOI
  31. Yonezawa, M. Induction of radio-resistance by low dose X-irradiation. Yakugaku Zasshi 126, 833–840 (2006). · DOI
  32. Ito, M. et al. Low-dose whole-body irradiation induced radioadaptive response in C57BL/6 mice. J. Radiat. Res. 48, 455–460 (2007). · DOI
  33. Carlisle, S. M., Burchart, P. A. & Mitchel, R. E. J. Cancer and non-cancer risks in normal and cancer-prone Trp53 heterozygous mice exposed to high-dose radiation. Radiat. Res. 173, 40–48 (2010). · DOI
  34. Ikushima, T., Aritomi, H. & Morisita, J. Radioadaptive response: efficient repair of radiation-induced DNA damage in adapted cells. Mutat. Res. 358, 193–198 (1996). · DOI
  35. Barcellos-Hoff, M. H. How do tissues respond to damage at the cellular level? The role of cytokines in irradiated tissues. Radiat. Res. 150, S109–S120 (1998). · DOI
  36. Harrington, N. P., Chambers, K. A., Ross, W. M. & Filion, L. G. Radiation damage and immune suppression in splenic mononuclear cell populations. Clin. Exp. Immunol. 107, 417–424 (1997). · DOI
  37. Kohzaki, M. et al. Long bones exhibit adaptive responses to chronic low-dose-rate ionizing radiation despite its lifespan-shortening and carcinogenic effects on C57BL/6 Mice. JBMR Plus 6, e10688 (2022). · DOI
  38. Abbas, T. & Dutta, A. p21 in cancer: intricate networks and multiple activities. Nat. Rev. Cancer 9, 400–414 (2009). · DOI · Paper page
  39. Tovar, C. et al. MDM2 small-molecule antagonist RG7112 activates p53 signaling and regresses human tumors in preclinical cancer models. Cancer Res. 73, 2587–2597 (2013). · DOI · Paper page
  40. Wu, D. & Prives, C. Relevance of the p53-MDM2 axis to aging. Cell Death Differ. 25, 169–179 (2018). · DOI · Paper page
  41. Roos, W. P., Thomas, A. D. & Kaina, B. DNA damage and the balance between survival and death in cancer biology. Nat. Rev. Cancer 16, 20–33 (2016). · DOI · Paper page
  42. Dantuma, N. P. & van Attikum, H. Spatiotemporal regulation of posttranslational modifications in the DNA damage response. EMBO J. 35, 6–23 (2016). · DOI
  43. Leroi, A. M. et al. What evidence is there for the existence of individual genes with antagonistic pleiotropic effects? Mech. Ageing Dev. 126, 421–429 (2005). · DOI
  44. Rufini, A., Tucci, P., Celardo, I. & Melino, G. Senescence and aging: the critical roles of p53. Oncogene 32, 5129 (2013). · DOI · Paper page
  45. Liu, T., Zhang, L., Joo, D. & Sun, S. C. NF-κB signaling in inflammation. Signal. Transduct. Target Ther. 2, 17023 (2017). · DOI · Paper page

Metadata

Authors
Kohzaki, M., Suzuki, K., Ootsuyama, A., & Okazaki, R.
Affiliations
  • University of Occupational and Environmental Health Japan (JP)
  • Nagasaki University (JP)
Corresponding author
Kohzaki, Masaoki
Venue
npj Aging
Published
2023-11-07
Volume
9
Issue
1
Pages
26-26
ISSN
2731-6068 (ISSN-L)
OpenAlex
W4388456034
Cited by
1
References
5
Citations by year
2024: 1
FWCI
0.16
Type
journal article
Language
en
Open access
Locations
  • npj Aging (publishedVersion, cc-by)
  • Research Square (acceptedVersion, cc-by)
  • PubMed Central (publishedVersion, cc-by)
  • PubMed (publishedVersion)
Funders
  • GlaxoSmithKline Japan
  • University of Occupational and Environmental Health (031404)
  • Ministry of Education, Culture, Sports, Science and Technology (15K21565, 18K07774, 20K12172)
  • Research Promotion Foundation
  • Kaibara Morikazu Medical Science Promotion Foundation
  • Hitachi Global Foundation
  • Japan Society for the Promotion of Science (18K07774, 20K12172, 15K21565, 23K28231)
Topics
  • Health Sciences › Medicine › Radiology, Nuclear Medicine and Imaging › Effects of Radiation Exposure
  • Life Sciences › Biochemistry, Genetics and Molecular Biology › Aging › Genetics, Aging, and Longevity in Model Organisms
  • Life Sciences › Biochemistry, Genetics and Molecular Biology › Cell Biology › Telomeres, Telomerase, and Senescence
Keywords
low-dose radiation, adaptive radiation response, p53 activation, aging, lifespan extension, senescence-associated secretory phenotype, DNA damage response, apoptosis, interleukin-6, MCP-1, RANTES, CXCL1, C57BL/6 mice

About these checks

Registry, retraction, Cites and statistics results are computed, not judged, with one exception: a printed reference that no index lists is read once by a model before it counts as a citation error. Claims are extracted by a model and kept only when their quote appears verbatim in the text; each cited source is then checked, with a model’s help, for whether it says what the claim relies on. Those verdicts can be wrong — read the claim’s quote and the cited source before relying on one.

Statistics and arithmetic are recomputed, not judged.

Confidence bands are shown only for fields calibrated on our annotated test set. None is calibrated yet, so no band is shown.

What counts as a claim ›How we measure confidence ›How we check this ›

Are you an author, or do you see a problem with this page? Request a review