

The DOI matches its Crossref record; 68 of the 68 references it cites were found in a registry or an index.
Analysis of microbial compositions: a review of normalization and differential abundance analysis
Open accessAbstract
Increasingly, researchers are discovering associations between microbiome and a wide range of human diseases such as obesity, inflammatory bowel diseases, HIV, and so on. The first step towards microbiome wide association studies is the characterization of the composition of human microbiome under different conditions. Determination of differentially abundant microbes between two or more environments, known as differential abundance (DA) analysis, is a challenging and an important problem that has received considerable interest during the past decade. It is well documented in the literature that the observed microbiome data (OTU/SV table) are relative abundances with an excess of zeros. Since relative abundances sum to a constant, these data are necessarily compositional. In this article we review some recent methods for DA analysis and describe their strengths and weaknesses.
Overview
The claims and statistics of this paper haven’t been checked yet.
Run the check — free, no account needed. It reads the open-access text and checks the sources it cites.
Integrity signals
Registry
Cites
Statistics
Figures
Verification
Claims the paper makes
The claims and statistics of this paper haven’t been checked yet.
Run the check — free, no account needed. It reads the open-access text and checks the sources it cites.
Claims other papers make about this one
Each is checked against this paper’s own text: does it say what the citing paper says it does?
In the citing paper
“A recent approach called differential ranking is robust to the choice of the alr reference feature, and ranks produced from relative abundances are identical to the ranks of absolute abundances66,67.”
From Longitudinal gut microbiome changes in immune checkpoint blockade-treated advanced melanoma (2024) · cites this paper as [66]
Self-check
Percentages, sums and reported differences re-computed from the paper’s own numbers.
The self-check needs the paper’s full text.
Citations
Cites
Controlling the False Discovery Rate: A Practical and Powerful Approach to Multiple Testing
Benjamini, Y., & Hochberg, Y. (1995) · Journal of the Royal Statistical Society Series B: Statistical Methodology · doi:10.1111/j.2517-6161.1995.tb02031.x · Cited by 109,482 · cited 2×
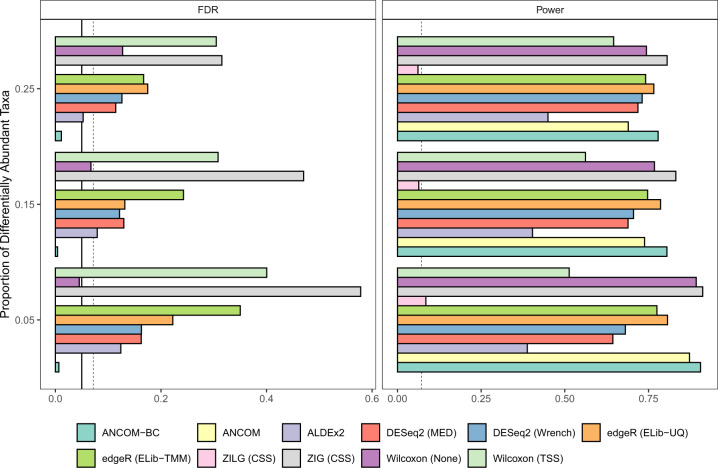
“By default, ANCOM-BC implements Holm-Bonferroni 70 method and other DA methods implement BH procedure 57 to adjust for multiple comparisons.”
MethodModerated estimation of fold change and dispersion for RNA-seq data with DESeq2
Love, M. I., Huber, W., & Anders, S. (2014) · Genome Biology · doi:10.1186/s13059-014-0550-8 · Cited by 95,106 · cited 3×
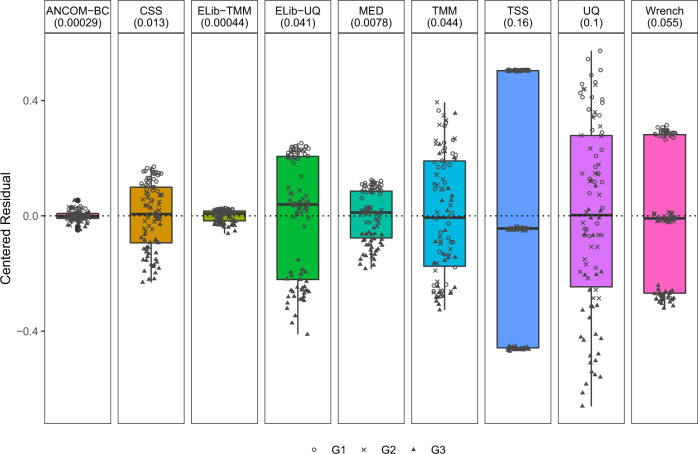
“Some commonly used normalization methods include Cumulative-Sum Scaling (CSS) implemented in metagenome-Seq 21 , Median (MED) in DESeq2 41 , Upper Quartile (UQ) 42 and Trimmed Mean of M-values (TMM) 43 in edgeR 44 and Wrench 45 , and Total-Sum Scaling (TSS) which simply transforms the abundance…”
InfluentialRobinson, M. D., McCarthy, D. J., & Smyth, G. K. (2010) · Bioinformatics · doi:10.1093/bioinformatics/btp616 · Cited by 41,364
DADA2: High–resolution sample inference from Illumina amplicon data
Callahan, B. J., McMurdie, P. J., Rosen, M. J., Han, A. W., Johnson, A. J. A., & Holmes, S. P. (2016) · Nature Methods · doi:10.1038/nmeth.3869 · Cited by 35,698
Reproducible, interactive, scalable and extensible microbiome data science using QIIME 2
Bolyen, E., Rideout, J. R., Dillon, M. R., Bokulich, N. A., Abnet, C. C., Al-Ghalith, G. A., Alexander, H., Alm, E. J., Arumugam, M., Asnicar, F., et al. (2019) · Nature Biotechnology · doi:10.1038/s41587-019-0209-9 · Cited by 23,742
A Simple Sequentially Rejective Multiple Test Procedure
(1979) · Scandinavian Journal of Statistics · doi:10.2307/4615733 · Cited by 21,526 · cited 1×
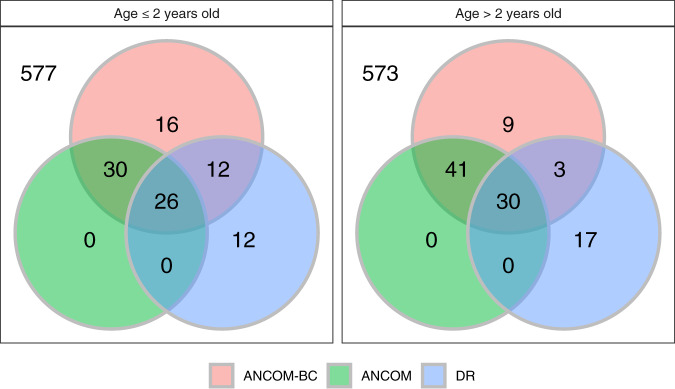
“The sample sizes in the two age categories (≤2 years, >2 years) for Malawi (MA), USA (US) and Venezuela (VEN) are (47, 36), (50, 260), and (27, 70), respectively.”
BackgroundUPARSE: highly accurate OTU sequences from microbial amplicon reads
Edgar, R. C. (2013) · Nature Methods · doi:10.1038/nmeth.2604 · Cited by 16,770
Metagenomic biomarker discovery and explanation
Segata, N., Izard, J., Waldron, L., Gevers, D., Miropolsky, L., Garrett, W. S., & Huttenhower, C. (2011) · Genome Biology · doi:10.1186/gb-2011-12-6-r60 · Cited by 16,192
Differential expression analysis for sequence count data
Anders, S., & Huber, W. (2010) · Genome Biology · doi:10.1186/gb-2010-11-10-r106 · Cited by 15,581
A scaling normalization method for differential expression analysis of RNA-seq data
Robinson, M. D., & Oshlack, A. (2010) · Genome Biology · doi:10.1186/gb-2010-11-3-r25 · Cited by 7,876
Research works printed but not linked: 1
- Gotelli, N. J. & Colwell, R. K. Estimating species richness. Biol. Divers. Front. Meas. Assess. 12, 39–54 (2011).
Cited by
Sorted by citations
Microbiome differential abundance methods produce different results across 38 datasets
Nearing, J. T., Douglas, G. M., Hayes, M. G., MacDonald, J., Desai, D., McCormick, N. E., Jones, C. M. A., Wright, R., Dhanani, A. S., Comeau, A., et al. (2022) · Nature Communications · doi:10.1038/s41467-022-28034-z · Cited by 1,050
Best practices in metabarcoding of fungi: From experimental design to results
Tedersoo, L., Bahram, M., Zinger, L., Nilsson, R. H., Kennedy, P. G., Yang, T., Anslan, S., & Mikryukov, V. S. (2022) · Molecular Ecology · doi:10.1111/mec.16460 · Cited by 402
Schloss, P. D. (2024) · mSphere · doi:10.1128/msphere.00354-23 · Cited by 234
“The second, Nudge CLR, added a pseudo-count of 1 divided by the total number of sequences in a sample to each OTU in the sample (19, 24).”
BackgroundMethodInfluentialYang, L., & Chen, J. (2022) · Microbiome · doi:10.1186/s40168-022-01320-0 · Cited by 200
“Discussion Differential abundance analysis (DAA) is one of the most fundamental statistical tools for microbiome data analysis [63].”
Host-diet-gut microbiome interactions influence human energy balance: a randomized clinical trial
Corbin, K. D., Carnero, E. Á., Dirks, B., IGUDESMAN, D. A., Yi, F., Marcus, A. K., Davis, T. L., Pratley, R. E., Rittmann, B. E., Krajmalnik‐Brown, R., et al. (2023) · Nature Communications · doi:10.1038/s41467-023-38778-x · Cited by 193
Metadata
- Authors
- Lin, H., & Peddada, S. D.
- Affiliations
- National Institutes of Health (US)
- Corresponding author
- Peddada, Shyamal Das
- Venue
- npj Biofilms and Microbiomes
- Published
- 2020-12-02
- Volume
- 6
- Issue
- 1
- Pages
- 60-60
- ISSN
- 2055-5008 (ISSN-L)
- PMC
- PMC7710733
- OpenAlex
- W3109541743
- Cited by
- 341
- References
- 68
- Citations by year
- 2026: 57 · 2025: 73 · 2024: 67 · 2023: 77 · 2022: 55 · 2021: 11
- FWCI
- 3.45
- Type
- journal article
- Language
- en
- Open access
- gold
- doi.org
- Locations
- npj Biofilms and Microbiomes (publishedVersion, cc-by)
- PubMed Central (publishedVersion, cc-by)
- PubMed (publishedVersion)
- Funders
- University of Pittsburgh
- Topics
- Life Sciences › Biochemistry, Genetics and Molecular Biology › Molecular Biology › Gut microbiota and health
- Physical Sciences › Environmental Science › Ecology › Microbial Community Ecology and Physiology
- Life Sciences › Biochemistry, Genetics and Molecular Biology › Molecular Biology › Genomics and Phylogenetic Studies
- Keywords
- microbiome, differential abundance, compositional data, normalization, zero-inflated data, OTU table, sequencing read counts, human microbiome
- MeSH terms
- Gastrointestinal Microbiome, Bacteria, Humans, Models, Theoretical, Mouth, Phylogeny
About these checks
Registry, retraction, Cites and statistics results are computed, not judged, with one exception: a printed reference that no index lists is read once by a model before it counts as a citation error. Claims are extracted by a model and kept only when their quote appears verbatim in the text; each cited source is then checked, with a model’s help, for whether it says what the claim relies on. Those verdicts can be wrong — read the claim’s quote and the cited source before relying on one.
Statistics and arithmetic are recomputed, not judged.
Confidence bands are shown only for fields calibrated on our annotated test set. None is calibrated yet, so no band is shown.
What counts as a claim ›How we measure confidence ›How we check this ›
Are you an author, or do you see a problem with this page? Request a review
