

The DOI matches its Crossref record; 68 of the 68 references it cites were found in a registry or an index.
Analysis of microbial compositions: a review of normalization and differential abundance analysis
Open accessAbstract
Increasingly, researchers are discovering associations between microbiome and a wide range of human diseases such as obesity, inflammatory bowel diseases, HIV, and so on. The first step towards microbiome wide association studies is the characterization of the composition of human microbiome under different conditions. Determination of differentially abundant microbes between two or more environments, known as differential abundance (DA) analysis, is a challenging and an important problem that has received considerable interest during the past decade. It is well documented in the literature that the observed microbiome data (OTU/SV table) are relative abundances with an excess of zeros. Since relative abundances sum to a constant, these data are necessarily compositional. In this article we review some recent methods for DA analysis and describe their strengths and weaknesses.
Overview
The claims and statistics of this paper haven’t been checked yet.
Run the check — free, no account needed. It reads the open-access text and checks the sources it cites.
Integrity signals
Registry
Cites
Statistics
Figures
Verification
Claims the paper makes
The claims and statistics of this paper haven’t been checked yet.
Run the check — free, no account needed. It reads the open-access text and checks the sources it cites.
Claims other papers make about this one
Each is checked against this paper’s own text: does it say what the citing paper says it does?
In the citing paper
“A recent approach called differential ranking is robust to the choice of the alr reference feature, and ranks produced from relative abundances are identical to the ranks of absolute abundances66,67.”
From Longitudinal gut microbiome changes in immune checkpoint blockade-treated advanced melanoma (2024) · cites this paper as [66]
Self-check
Percentages, sums and reported differences re-computed from the paper’s own numbers.
The self-check needs the paper’s full text.
Citations
Cites
Controlling the False Discovery Rate: A Practical and Powerful Approach to Multiple Testing
Benjamini, Y., & Hochberg, Y. (1995) · Journal of the Royal Statistical Society Series B: Statistical Methodology · doi:10.1111/j.2517-6161.1995.tb02031.x · Cited by 109,482 · cited 2×
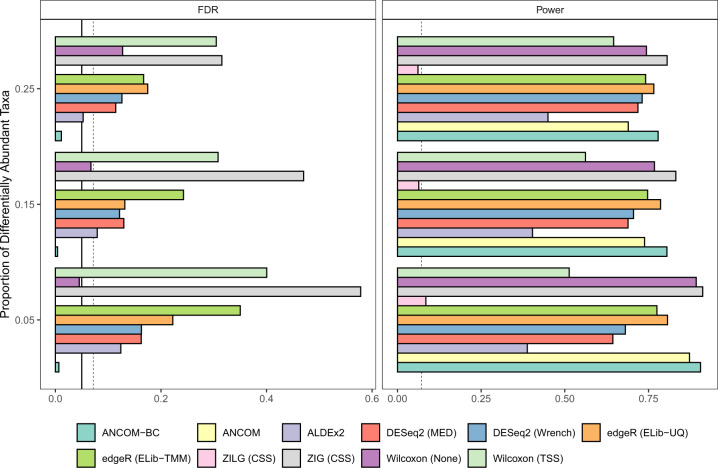
“By default, ANCOM-BC implements Holm-Bonferroni 70 method and other DA methods implement BH procedure 57 to adjust for multiple comparisons.”
MethodModerated estimation of fold change and dispersion for RNA-seq data with DESeq2
Love, M. I., Huber, W., & Anders, S. (2014) · Genome Biology · doi:10.1186/s13059-014-0550-8 · Cited by 95,106 · cited 3×
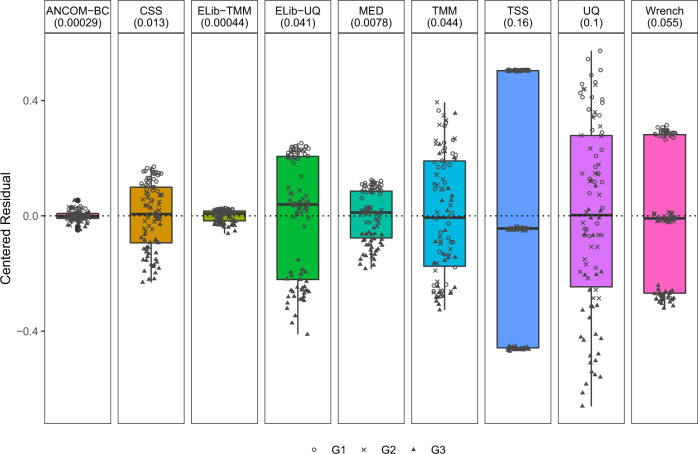
“Some commonly used normalization methods include Cumulative-Sum Scaling (CSS) implemented in metagenome-Seq 21 , Median (MED) in DESeq2 41 , Upper Quartile (UQ) 42 and Trimmed Mean of M-values (TMM) 43 in edgeR 44 and Wrench 45 , and Total-Sum Scaling (TSS) which simply transforms the abundance…”
InfluentialRobinson, M. D., McCarthy, D. J., & Smyth, G. K. (2010) · Bioinformatics · doi:10.1093/bioinformatics/btp616 · Cited by 41,364
DADA2: High–resolution sample inference from Illumina amplicon data
Callahan, B. J., McMurdie, P. J., Rosen, M. J., Han, A. W., Johnson, A. J. A., & Holmes, S. P. (2016) · Nature Methods · doi:10.1038/nmeth.3869 · Cited by 35,698
Reproducible, interactive, scalable and extensible microbiome data science using QIIME 2
Bolyen, E., Rideout, J. R., Dillon, M. R., Bokulich, N. A., Abnet, C. C., Al-Ghalith, G. A., Alexander, H., Alm, E. J., Arumugam, M., Asnicar, F., et al. (2019) · Nature Biotechnology · doi:10.1038/s41587-019-0209-9 · Cited by 23,742
A Simple Sequentially Rejective Multiple Test Procedure
(1979) · Scandinavian Journal of Statistics · doi:10.2307/4615733 · Cited by 21,526 · cited 1×
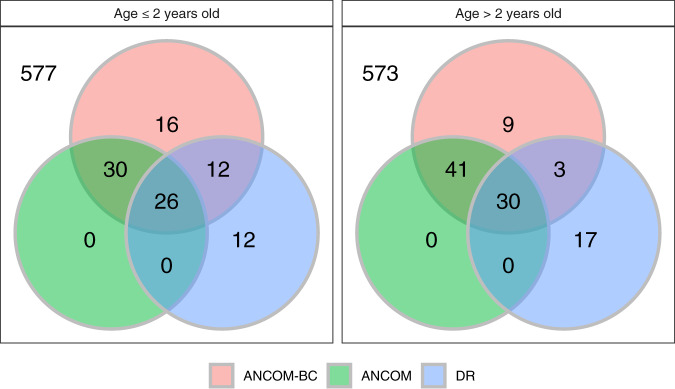
“The sample sizes in the two age categories (≤2 years, >2 years) for Malawi (MA), USA (US) and Venezuela (VEN) are (47, 36), (50, 260), and (27, 70), respectively.”
BackgroundUPARSE: highly accurate OTU sequences from microbial amplicon reads
Edgar, R. C. (2013) · Nature Methods · doi:10.1038/nmeth.2604 · Cited by 16,770
Metagenomic biomarker discovery and explanation
Segata, N., Izard, J., Waldron, L., Gevers, D., Miropolsky, L., Garrett, W. S., & Huttenhower, C. (2011) · Genome Biology · doi:10.1186/gb-2011-12-6-r60 · Cited by 16,192
Differential expression analysis for sequence count data
Anders, S., & Huber, W. (2010) · Genome Biology · doi:10.1186/gb-2010-11-10-r106 · Cited by 15,581
A scaling normalization method for differential expression analysis of RNA-seq data
Robinson, M. D., & Oshlack, A. (2010) · Genome Biology · doi:10.1186/gb-2010-11-3-r25 · Cited by 7,876
Research works printed but not linked: 1
- Gotelli, N. J. & Colwell, R. K. Estimating species richness. Biol. Divers. Front. Meas. Assess. 12, 39–54 (2011).
Cited by
Sorted by citations
Microbiome differential abundance methods produce different results across 38 datasets
Nearing, J. T., Douglas, G. M., Hayes, M. G., MacDonald, J., Desai, D., McCormick, N. E., Jones, C. M. A., Wright, R., Dhanani, A. S., Comeau, A., et al. (2022) · Nature Communications · doi:10.1038/s41467-022-28034-z · Cited by 1,050
Best practices in metabarcoding of fungi: From experimental design to results
Tedersoo, L., Bahram, M., Zinger, L., Nilsson, R. H., Kennedy, P. G., Yang, T., Anslan, S., & Mikryukov, V. S. (2022) · Molecular Ecology · doi:10.1111/mec.16460 · Cited by 402
Schloss, P. D. (2024) · mSphere · doi:10.1128/msphere.00354-23 · Cited by 234
“The second, Nudge CLR, added a pseudo-count of 1 divided by the total number of sequences in a sample to each OTU in the sample (19, 24).”
BackgroundMethodInfluentialYang, L., & Chen, J. (2022) · Microbiome · doi:10.1186/s40168-022-01320-0 · Cited by 200
“Discussion Differential abundance analysis (DAA) is one of the most fundamental statistical tools for microbiome data analysis [63].”
Host-diet-gut microbiome interactions influence human energy balance: a randomized clinical trial
Corbin, K. D., Carnero, E. Á., Dirks, B., IGUDESMAN, D. A., Yi, F., Marcus, A. K., Davis, T. L., Pratley, R. E., Rittmann, B. E., Krajmalnik‐Brown, R., et al. (2023) · Nature Communications · doi:10.1038/s41467-023-38778-x · Cited by 193
Linear and nonlinear correlation estimators unveil undescribed taxa interactions in microbiome data
Huang, L., Eggesbø, M. Å., & Peddada, S. (2022) · Nature Communications · doi:10.1038/s41467-022-32243-x · Cited by 167
“From (7), we estimate yij by ŷij = ðoij o jÞ d si s : Thus, from (6),”
BackgroundSelf-citationLongitudinal gut microbiome changes in immune checkpoint blockade-treated advanced melanoma
Björk, J. R., Bolte, L. A., Maltez Thomas, A., Lee, K. A., Rossi, N., Wind, T. T., Smit, L. M., Armanini, F., Asnicar, F., Blanco-Miguez, A., et al. (2024) · Nature Medicine · doi:10.1038/s41591-024-02803-3 · Cited by 156
“A recent approach called differential ranking is robust to the choice of the alr reference feature, and ranks produced from relative abundances are identical to the ranks of absolute abundances 66,67 .”
Letchumanan, G., Abdullah, N., Marlini, M., Baharom, N., Lawley, B., Omar, M. R., Mohideen, F. B. S., Addnan, F. H., Fariha, M. M. N., Ismail, Z., et al. (2022) · Frontiers in Cellular and Infection Microbiology · doi:10.3389/fcimb.2022.943427 · Cited by 158
“Differences in sampling fractions may also tend to introduce false positives and false negatives (Lin and Peddada, 2020).”
BackgroundMachine learning approaches in microbiome research: challenges and best practices
Παπουτσόγλου, Γ., Tarazona, S., Lopes, M. B., Klammsteiner, T., Ibrahimi, E., Eckenberger, J., Novielli, P., Tonda, A. P., Mihajlović, A., Shigdel, R., et al. (2023) · Frontiers in Microbiology · doi:10.3389/fmicb.2023.1261889 · Cited by 153
“But choosing the most effective one is difficult (McMurdie and Holmes, 2014; Weiss et al., 2017; Pereira et al., 2018; Lin and Peddada, 2020) because of the possible over- or under-estimation of fraction of zero counts and distortion of feature correlations across samples due to the data sparsity and differences in se…”
BackgroundThe best practice for microbiome analysis using R
Wen, T., Niu, G., Chen, T., Shen, Q., Yuan, J., & Liu, Y.-X. (2023) · Protein & Cell · doi:10.1093/procel/pwad024 · Cited by 139
Regueira‐Iglesias, A., Balsa‐Castro, C., Blanco‐Pintos, T., & Tomás, I. (2023) · Molecular Oral Microbiology · doi:10.1111/omi.12434 · Cited by 146
Impact of Plant-Based Meat Alternatives on the Gut Microbiota of Consumers: A Real-World Study
Toribio-Mateas, M. A., Bester, A., & Klimenko, N. S. (2021) · Foods · doi:10.3390/foods10092040 · Cited by 118
Statistical challenges in longitudinal microbiome data analysis
Kodikara, S., Ellul, S., & Cao, K. L. (2022) · Briefings in Bioinformatics · doi:10.1093/bib/bbac273 · Cited by 95
“Data produced by both these sequencing methods have many analytical challenges, due to the nature of the microbiome data, which are sparse, over-dispersed, of high dimension, multi-collinear, multivariate and highly variable [9, 22, 43, 63, 76].”
BackgroundWaste not, want not: revisiting the analysis that called into question the practice of rarefaction
Schloss, P. D. (2023) · mSphere · doi:10.1128/msphere.00355-23 · Cited by 88
Ojala, T., Häkkinen, A.-E., Kankuri, E. M., & Kankainen, M. (2023) · Trends in Genetics · doi:10.1016/j.tig.2023.05.004 · Cited by 81
“Noteworthy normalization approaches with good performance in past metagenome evaluations [77,78] include the trimmed mean of m-value (TMM) normalization method [79], relative log expression method [80], and analysis of compositions of microbiomes with bias correction (ANCOM-BC) [81].”
Applications and Comparison of Dimensionality Reduction Methods for Microbiome Data
Armstrong, G., Rahman, G., Martino, C., McDonald, D. T., González, A., Mishne, G., & Knight, R. D. (2022) · Frontiers in Bioinformatics · doi:10.3389/fbinf.2022.821861 · Cited by 70
“Although this task is often addressed with differential abundance methods, those methods make specific statistical assumptions and may not correspond to the group separation observed in an exploratory analysis performed with any dimensionality reduction method (Lin and Peddada, 2020).”
MethodInvestigating differential abundance methods in microbiome data: A benchmark study
Cappellato, M., Baruzzo, G., & Camillo, B. D. (2022) · PLoS Computational Biology · doi:10.1371/journal.pcbi.1010467 · Cited by 73
“The performances shown in Lin et al. [13] also demonstrate that different normalisation methods have a limited impact on recall, but more evident on the precision.”
BackgroundMethodResultInfluentialStatistical normalization methods in microbiome data with application to microbiome cancer research
Xia, Y. (2023) · Gut Microbes · doi:10.1080/19490976.2023.2244139 · Cited by 76
Gut microbiota predicts severity and reveals novel metabolic signatures in acute pancreatitis
Ammer-Herrmenau, C., Antweiler, K. L., Asendorf, T., Beyer, G., Buchholz, S. M., Cameron, S., Capurso, G., Damm, M., Dang, L., Frost, F., et al. (2024) · Gut · doi:10.1136/gutjnl-2023-330987 · Cited by 67
“32 33 MaAslin2 is based on generalised linear and mixed model and allows multivariate analysis.”
BackgroundMetagenomic Analysis Using Phylogenetic Placement—A Review of the First Decade
Czech, L., Stamatakis, A., Dunthorn, M., & Barbera, P. (2022) · Frontiers in Bioinformatics · doi:10.3389/fbinf.2022.871393 · Cited by 69
“normalization (Weiss et al., 2017; Du et al., 2018; Lin and Peddada, 2020) can be applied, although future work is needed to establish those in the context of phylogenetic placement.”
BackgroundA review of normalization and differential abundance methods for microbiome counts data
Swift, D. D., Cresswell, K. G., Johnson, R., Stilianoudakis, S., & Wei, X. (2022) · Wiley Interdisciplinary Reviews Computational Statistics · doi:10.1002/wics.1586 · Cited by 65
“To address compositionality and to allow for differential absolute abundance analysis, H. Lin and Peddada (2020b) proposed the recently developed Analysis of Compositions of Microbiomes with Bias Correction (ANCOM-BC), a two-stage method that begins with a normalization step.”
BackgroundMethodResultInfluentialChameleon-like microbes promote microecological differentiation of Daqu.
Yang, L., Fan, W., & Xu, Y. (2022) · Food microbiology · doi:10.1016/j.fm.2022.104144 · Cited by 58
Deep learning methods in metagenomics: a review
Roy, G., Prifti, E., Belda, E., & Zucker, J. (2024) · Microbial Genomics · doi:10.1099/mgen.0.001231 · Cited by 73
“…the choices made to handle the specific nature of metagenomic data in terms of compositionality by means of different data transformations [184, 185], the use of different approaches to estimate absolute abundances of metagenomic features [186] or the different strategies that can be adopted…”
MethodA Survey of Statistical Methods for Microbiome Data Analysis
Lutz, K. C., Jiang, S., Neugent, M. L., Nisco, N. J. D., Zhan, X., & Li, Q. (2022) · Frontiers in Applied Mathematics and Statistics · doi:10.3389/fams.2022.884810 · Cited by 64
“One issue here is that FDR increases when either sample size or effect size increases [20].”
InfluentialTsenkova, M., Brauer, M., Pozdeev, V. I., Kasakin, M. F., Busi, S. B., Schmoetten, M., Cheung, D., Meyers, M., Rodriguez, F., Gaigneaux, A., et al. (2025) · Nature Communications · doi:10.1038/s41467-025-56678-0 · Cited by 58
Relative abundance data can misrepresent heritability of the microbiome
Bruijning, M., Ayroles, J. F., Henry, L. P., Koskella, B., Meyer, K., & Metcalf, C. J. E. (2023) · Microbiome · doi:10.1186/s40168-023-01669-w · Cited by 52
“It is beyond the scope of this paper to provide a comprehensive overview of all available methods, but we refer the interested reader to [41, 51, 62, 63] for studies applying such methods to microbial data.”
BackgroundData pre-processing for analyzing microbiome data – A mini review
Zhou, R., Ng, S. K., Sung, J. J. �., Goh, W. W. B., & Wong, S. H. (2023) · Computational and Structural Biotechnology Journal · doi:10.1016/j.csbj.2023.10.001 · Cited by 56
“Normalization is important due to over-dispersion and uneven sampling depths, and it should be performed prior to downstream analysis of microbiome data [75].”
BackgroundThe role of microbial ecology in improving the performance of anaerobic digestion of sewage sludge
Krohn, C. C., Khudur, L. S., Dias, D. A., van den Akker, B., Rees, C. A., Crosbie, N. D., Surapaneni, A., O’Carroll, D. M., Stuetz, R. M., Batstone, D. J., et al. (2022) · Frontiers in Microbiology · doi:10.3389/fmicb.2022.1079136 · Cited by 51
“There are a range of other approaches to quantify differences in abundances of microbial groups, including ALDEx and ANCOM, which were recently reviewed elsewhere (Lin and Peddada, 2020; Nearing et al., 2022).”
BackgroundWang, C., Segal, L. N., Hu, J., Zhou, B., Hayes, R. B., Ahn, J., & Li, H. (2022) · Microbiome · doi:10.1186/s40168-022-01310-2 · Cited by 47
“We propose to employ the existing sophisticated microbial association tests [1, 3, 4, 31–33] to identify microbial taxa associated with disease using the discovery samples.”
MethodResultInfluentialHamamah, S., Iatcu, O. C., & Covașă, M. (2024) · Nutrients · doi:10.3390/nu17010143 · Cited by 52
Jovel, J., Nimaga, A., Jordan, T., O’Keefe, S. L., Patterson, J., Thiesen, A., Hotte, N., Bording‐Jorgensen, M., Subedi, S., Hamilton, J., et al. (2022) · Frontiers in Microbiology · doi:10.3389/fmicb.2022.829378 · Cited by 46
“To statistically analyze differences in bacterial taxa abundance between groups (control vs. DSS-treated), we modeled observed abundance using a negative binomial distribution after scaling the data to account for sampling depth (Lin and Peddada, 2020).”
MethodMulti-omics time-series analysis in microbiome research: a systematic review
Sherwani, M. K., Ruuskanen, M. O., Feldner-Busztin, D., Firbas, P., Boza, G., Móréh, Á., Borman, T., Erawijantari, P. P., Scheuring, I., Gopalakrishnan, S., et al. (2025) · Briefings in Bioinformatics · doi:10.1093/bib/bbaf502 · Cited by 48
“Pearson and Spearman correlations are subject to this bias,unless specifically corrected for it [164].”
Aya, V., Jiménez, P., Muñoz, E., & Ramírez, J. D. (2023) · BMC Geriatrics · doi:10.1186/s12877-023-04066-y · Cited by 48
“The outcomes of interest for this review are: -Gut Microbiota Abundance: one term frequently used in gut microbiota research is absolute abundance, which refers to the "unobservable actual abundance of a taxon in a unit volume of an ecosystem, such as the gut" [79].”
BackgroundBenchmarking differential abundance analysis methods for correlated microbiome sequencing data
Yang, L., & Chen, J. (2022) · Briefings in Bioinformatics · doi:10.1093/bib/bbac607 · Cited by 40
Gut microbiome signatures and host colonization with multidrug-resistant bacteria
Isles, N. S., Mu, A., Kwong, J. C., Howden, B. P., & Stinear, T. P. (2022) · Trends in Microbiology · doi:10.1016/j.tim.2022.01.013 · Cited by 39
Methodological Considerations in Longitudinal Analyses of Microbiome Data: A Comprehensive Review
Lyu, R., Qu, Y., Divaris, K., & Wu, D. (2023) · Genes · doi:10.3390/genes15010051 · Cited by 41
“Then, by considering the log-ratios of all taxa with respect to a common reference taxon or a suitable function of all taxa, these methods explicitly eliminate the effect of the sampling fraction [51].”
MethodUhl, B., Krah, F., Baldrián, P., Brandl, R., Hagge, J., Müller, J. C., Thorn, S., Tláskal, V., & Bässler, C. (2022) · Biological Conservation · doi:10.1016/j.biocon.2022.109569 · Cited by 39
Microbiome Alterations in Alcohol Use Disorder and Alcoholic Liver Disease
Litwinowicz, K., & Gamian, A. (2023) · International Journal of Molecular Sciences · doi:10.3390/ijms24032461 · Cited by 38
Palmieri, O., Castellana, S., Biscaglia, G., Panza, A., Latiano, A., Fontana, R., Guerra, M., Corritore, G., Latiano, T. P., Martino, G., et al. (2021) · Cells · doi:10.3390/cells10113243 · Cited by 37
The maternal prenatal and offspring early‐life gut microbiome of childhood asthma phenotypes
Lee‐Sarwar, K. A., Chen, Y., Chen, Y. Y., Kozyrskyj, A. L., Mandhane, P. J., Turvey, S. E., Subbarao, P., Bisgaard, H. F., Stokholm, J., Chawes, B., et al. (2022) · Allergy · doi:10.1111/all.15516 · Cited by 37
Primary nasal influenza infection rewires tissue-scale memory response dynamics
Kazer, S. W., Matysiak, C., Langan, E. M., Messou, M.-A., LaSalle, T. J., O’Leary, E., Marbourg, J. M., Naughton, K. A., von Andrian, U. H., & Ordovás-Montañés, J. (2024) · Immunity · doi:10.1016/j.immuni.2024.06.005 · Cited by 39
Lee, Y., Cappellato, M., & Camillo, B. D. (2022) · GigaScience · doi:10.1093/gigascience/giad083 · Cited by 36
Luo, K., Chen, G., Zhang, Y., Moon, J., Xing, J., Peters, B. A., Usyk, M., Wang, Z., Hu, G., Li, J., et al. (2024) · Nature Metabolism · doi:10.1038/s42255-023-00961-1 · Cited by 38
Ahrens, A. P., Sanchez-Padilla, D. E., Drew, J. C., Oli, M. W., Roesch, L. F. W., & Triplett, E. W. (2022) · Scientific Reports · doi:10.1038/s41598-022-18020-2 · Cited by 35
Sepich‐Poore, G. D., Guccione, C., Laplane, L., Pradeu, T., Curtius, K., & Knight, R. (2022) · BioEssays · doi:10.1002/bies.202100252 · Cited by 33
IGUDESMAN, D. A., Crandell, J., Corbin, K. D., Hooper, J., Thomas, J. M., Bulik, C. M., Pence, B. W., Pratley, R. E., Kosorok, M. R., Maahs, D. M., et al. (2022) · Journal of Nutrition · doi:10.1016/j.tjnut.2022.12.017 · Cited by 34
Association between bacteria other than Helicobacter pylori and the risk of gastric cancer
Gunathilake, M. N., Lee, J., Choi, I. J., Kim, Y., & Kim, J. (2021) · Helicobacter · doi:10.1111/hel.12836 · Cited by 31
Boopathi, S., Meenatchi, R., Brindangnanam, P., Sudhakaran, G., Coumar, M. S., & Arockiaraj, J. (2023) · Aquaculture · doi:10.1016/j.aquaculture.2023.739829 · Cited by 30
Kang, S., Kim, H., Kim, S., Kim, J., Park, S., Lee, C.-W., Kim, K. O., Seo, G. S., Kim, M. S., Cha, J. M., et al. (2023) · Microorganisms · doi:10.3390/microorganisms11071665 · Cited by 29
How Diet and Lifestyle Can Fine-Tune Gut Microbiomes for Healthy Aging
Tamayo, M., Olivares, M., Ruas‐Madiedo, P., Margollés, A., Espı́n, J. C., Medina, I., Moreno-Arribas, M. V., Canals, S., Mirasso, C. R., Ortín, S., et al. (2024) · Annual Review of Food Science and Technology · doi:10.1146/annurev-food-072023-034458 · Cited by 33
Isobe, K., Oka, H., Watanabe, T., Tateno, R., Senoo, K., & Shibata, H. (2021) · Soil Biology and Biochemistry · doi:10.1016/j.soilbio.2021.108499 · Cited by 32
Kudo, H., Sugiura, T., Higashi, S., Oka, K., Takahashi, M., Kamiya, S., Tamura, Y., & Usui, M. (2021) · Frontiers in Veterinary Science · doi:10.3389/fvets.2021.736996 · Cited by 28
“To identify unique microbial genera for both healthy and endometritis groups, ANOVA-Like Differential Expression 2 (ALDEx2), estimates of the composition of biological features from the number of reads transformed to central log ratio (clr), was performed (26, 27).”
MethodElementary methods provide more replicable results in microbial differential abundance analysis
Pelto, J., Auranen, K. J., Kujala, J. V., & Lahti, L. (2025) · Briefings in Bioinformatics · doi:10.1093/bib/bbaf130 · Cited by 36
“Nevertheless, it is well-known that analyzing simple TSS normalized counts can lead to spurious results if the total absolute abundances differ systematically between the experimental groups [5, 9, 34, 35].”
Gontijo, J. B., Paula, F. S., Venturini, A. M., Yoshiura, C. A., Borges, C. D., de Moura, J. M. S., Bohannan, B. J. M., Nüsslein, K. R., Rodrigues, J. L. M., & Tsai, S. M. (2021) · Molecular Ecology · doi:10.1111/mec.15912 · Cited by 26
“The ASV counts classified in the same taxonomic groups were summarised and normalised to withinsample relative abundance (TSS - total sum scaling method, Lin & Peddada, 2020).”
MethodLim, J. J., Diener, C., Wilson, J. G., Valenzuela, J. J., Baliga, N. S., & Gibbons, S. M. (2023) · Nature Communications · doi:10.1038/s41467-023-41424-1 · Cited by 24
Karagiannis, T. T., Monti, S., & Sebastiani, P. (2022) · Frontiers in Genetics · doi:10.3389/fgene.2022.855076 · Cited by 26
Turrini, P., Chebbi, A., Riggio, F. P., & Visca, P. (2024) · Frontiers in Microbiology · doi:10.3389/fmicb.2024.1370520 · Cited by 26
Huang, Z., Ni, Y., Yu, Q., Li, J., Fan, L., & Eskin, N. A. M. (2022) · Advances in Colloid and Interface Science · doi:10.1016/j.cis.2022.102663 · Cited by 25
Cifuentes, S. G., Prado, M. B., Fornasini, M., Cohen, H., Baldeon, M. E., & Cárdenas, P. (2022) · Helicobacter · doi:10.1111/hel.12870 · Cited by 25
The Impact of Probiotic Bifidobacterium on Liver Diseases and the Microbiota
Hizo, G. H., & Rampelotto, P. H. (2024) · Life · doi:10.3390/life14020239 · Cited by 24
“The first methodologies researchers used to identify biomarkers were the Kruskal–Wallis and Mann–Whitney tests to detect significant differences in the microbiota among sample groups [77].”
MethodWang, B., Sun, F., & Luan, Y. (2024) · Scientific Reports · doi:10.1038/s41598-024-57670-2 · Cited by 26
“Comparisons of normalization methods have been performed in the context of data distributions 14,15 and differential analysis 16–20 .”
MethodLyte, J. M., Seyoum, M. M., Ayala, D., Kers, J. G., Caputi, V., Johnson, T. J., Zhang, L., Rehberger, J. M., Zhang, G., Dridi, S., et al. (2025) · Poultry Science · doi:10.1016/j.psj.2025.105242 · Cited by 25
“It has been recommended to use multiple differential abundance methods to help ensure robust biological interpretations (Lin and Peddada, 2020; Nearing et al., 2022).”
Comprehensive evaluation of methods for differential expression analysis of metatranscriptomics data
Cho, H., Qu, Y., Li, C., Tang, B., Lyu, R., Lin, B. M., Roach, J. M., Azcárate-Peril, M. A., Ribeiro, A. A., Love, M. I., et al. (2023) · Briefings in Bioinformatics · doi:10.1093/bib/bbad279 · Cited by 23
Cao, S., Shaw, E. L., Quarles, W. R., Sasaki, G. Y., Dey, P., Hodges, J. K., Pokala, A., Zeng, M., & Bruno, R. S. (2022) · Nutrients · doi:10.3390/nu14081545 · Cited by 21
“ANCOM II was implemented with R software using published source code [48].”
MethodPamela Thomson, M., Santibáñez, R., Rodríguez-Salas, C., Flores-Yáñez, C., & Garrido, D. A. (2022) · PeerJ · doi:10.7717/peerj.12695 · Cited by 22
Linkens, A. M. A., van Best, N., Niessen, P., Wijckmans, N. E. G., de Goei, E. E. C., Scheijen, J. L. J. M., DONGEN, M. C. J. M. V., van Gool, C. J., de Vos, W. M., Houben, A. J. H. M., et al. (2022) · International Journal of Molecular Sciences · doi:10.3390/ijms23105328 · Cited by 20
Microbiological profile of peri‐implantitis: Analyses of microbiome within dental implants
Kensara, A. A., Saito, H., Mongodin, E. F., & Masri, R. M. (2023) · Journal of Prosthodontics · doi:10.1111/jopr.13653 · Cited by 22
Zhang, Y., Schlüter, J., Zhang, L., Cao, X., Jenq, R. R., Feng, H., Haines, J. L., & Zhang, L. (2024) · Computational and Structural Biotechnology Journal · doi:10.1016/j.csbj.2024.11.003 · Cited by 23
Hildebrand, G., Honeker, L. K., Freire-Zapata, V., Ayala-Ortiz, C., Rajakaruna, S., Fudyma, J., Daber, L. E., AminiTabrizi, R., Chu, R. L., Toyoda, J. G., et al. (2023) · The Science of The Total Environment · doi:10.1016/j.scitotenv.2023.165689 · Cited by 19
Microbial diversity in Antarctic Dry Valley soils across an altitudinal gradient
Mashamaite, L., Lebre, P. H., Varliero, G., Maphosa, S., Ortiz, M., Hogg, I. D., & Cowan, D. A. (2023) · Frontiers in Microbiology · doi:10.3389/fmicb.2023.1203216 · Cited by 22
“Significant differences in relative abundances of taxa at genus-level between low and high altitude groups was inferred using ANCOMBC 1.2.2 (Lin and Peddada, 2020).”
MethodInfluentialMicrobiological profile of peri‐implantitis: Analyses of peri‐implant microbiome
Kensara, A. A., Saito, H., Mongodin, E. F., & Masri, R. M. (2023) · Journal of Prosthodontics · doi:10.1111/jopr.13743 · Cited by 20
Wagner, S., Weber, M., Paul, L.-S., Grümpel-Schlüter, A., Kluess, J., Neuhaus, K., & Fuchs, T. M. (2025) · Frontiers in Microbiology · doi:10.3389/fmicb.2025.1481197 · Cited by 18
Martos, S., Busoms, S., Pérez‐Martín, L., Llugany, M., Cabot, C., & Poschenrieder, C. (2021) · Frontiers in Microbiology · doi:10.3389/fmicb.2021.639997 · Cited by 18
“…the observed abundances using negative binomial distribution after normalizing data with the corresponding scaling methods to account for differences in sampling fractions, recommended for small datasets (< 20 samples per group) (Paulson et al., 2013; Weiss et al., 2017; Lin and Peddada, 2020).”
MethodMaternal Psychosocial Stress Is Associated with Reduced Diversity in the Early Infant Gut Microbiome
Dutton, C. L., Maisha, F. M., Quinn, E. B., Morales, K. L. C., Moore, J. M., & Mulligan, C. J. (2023) · Microorganisms · doi:10.3390/microorganisms11040975 · Cited by 17
Xue, G., Zheng, Z., Liang, X., Zheng, Y., & Wu, H. (2023) · Microbiology Spectrum · doi:10.1128/spectrum.00409-23 · Cited by 17
“tant pathways such as energy homeostasis, nutrient intake, and immune balance (26, 27).”
BackgroundKim, M.-J., Kim, H., Jacobs, J. P., & Yang, H. (2024) · Gut and Liver · doi:10.5009/gnl230348 · Cited by 17
“23 These taxa were identified in a previous study using multiple differential abundance methods, including ANCOM-2 (https:// github.com/FrederickHuangLin/ANCOM, accessed on September 23, 2022) and MaAsLin2, which were adjusted for age, sex, and body mass index.”
MethodThiruppathy, D., Moyne, O., Marotz, C. A., Williams, M. R., Navarro, P., Zaramela, L. S., & Zengler, K. (2025) · Microbiome · doi:10.1186/s40168-025-02063-4 · Cited by 16
“Robust Aitchison distance does not assume the data are dense and is robust to missing data by treating it as unobserved through an adaptation of centered log-ratio transformation of the data (RCLR) [64, 65].”
Byers, A. K., Garrett, L. G., Armstrong, C., Dean, F., & Wakelin, S. A. (2023) · SOIL · doi:10.5194/soil-9-55-2023 · Cited by 19
“Analysis of Compositions of Microbiomes with Bias Correction (ANCOM-BC; Lin and Peddada, 2020) was used to identify microbial taxa which had a significant log-fold change between topsoil (0–30 cm) and subsoil layers (30–100 cm).”
MethodWang, S., Chen, A.-P., Chou, S., Kuo, C., & Lai, E. (2023) · mBio · doi:10.1128/mbio.00177-23 · Cited by 16
“The OTUs having w values at the 70th percentile or higher are considered significant (59, 60).”
BackgroundPaillet, T., Lamy-Besnier, Q., Figueroa, C., Petit, M., & Dugat‐Bony, É. (2024) · mSystems · doi:10.1128/msystems.00201-24 · Cited by 19
Chuang, A. W., Bates, K. A., Obregón, D., Estrada‐Peña, A., King, K. C., & Cabezas‐Cruz, A. (2022) · Scientific Reports · doi:10.1038/s41598-022-18269-7 · Cited by 15
IGUDESMAN, D. A., Crandell, J., Corbin, K. D., Muntis, F. R., Zaharieva, D. P., Casu, A., Thomas, J. M., Bulik, C. M., Carroll, I. M., Pence, B. W., et al. (2022) · Current Developments in Nutrition · doi:10.1093/cdn/nzac107 · Cited by 17
“We considered several approaches to normalize read counts (30, 31) and ultimately selected a previously published method using the following formula (32):”
MethodCoffey, E. L., Gomez, A. M., Ericsson, A. C., Burton, E. N., Granick, J. L., Lulıch, J. P., & Furrow, E. (2023) · BMC Microbiology · doi:10.1186/s12866-023-02815-y · Cited by 14
“However, this study was not designed to evaluate the accuracy or relative superiority of specific normalization techniques, and we direct readers to other resources for more indepth discussions of data normalization methods, considerations for their use, and their overall performance when evaluating microbial ecosyste…”
BackgroundLongDat: an R package for covariate-sensitive longitudinal analysis of high-dimensional data
Chen, C., Löber, U., & Forslund, S. K. (2023) · Bioinformatics Advances · doi:10.1093/bioadv/vbad063 · Cited by 14
Supervised learning and model analysis with compositional data
Huang, S., Ailer, E., Kilbertus, N., & Pfister, N. (2023) · PLoS Computational Biology · doi:10.1371/journal.pcbi.1011240 · Cited by 18
“A common fix is to add so-called pseudo-counts, a small non-zero constant, to all (zero) entries [20, 21].”
Monshizadeh, M., & Ye, Y. (2024) · Gut Microbes · doi:10.1080/19490976.2024.2302076 · Cited by 13
“35 This approach helps to mitigate the impact of extreme values and achieve a more balanced distribution of feature values.”
BackgroundCapturing the dynamics of microbial interactions through individual-specific networks
Yousefi, B., Melograna, F., Galazzo, G., van Best, N., Mommers, M., Penders, J., Schwikowski, B., & Steen, K. V. (2023) · Frontiers in Microbiology · doi:10.3389/fmicb.2023.1170391 · Cited by 17
Nguyễn, Q. A., Nguyen, L. N., Xu, Z., Luo, W., & Nghiem, L. D. (2021) · Journal of Membrane Science · doi:10.1016/j.memsci.2021.120034 · Cited by 14
Gut microbiome-based machine learning model for early colorectal cancer and adenoma screening
Tsai, Y.-J., Lyu, W.-N., Liao, N.-S., Chen, P., Tsai, M., & Chuang, E. Y.-Y. (2025) · Gut Pathogens · doi:10.1186/s13099-025-00750-z · Cited by 16
“0.3) [35] was used, which applies the Benjamini–Hochberg method to adjust for multiple comparisons.”
InfluentialMOCHI: a comprehensive cross-platform tool for amplicon-based microbiota analysis
Zheng, J.-J., Wang, P., Huang, T., Yang, Y.-J., Chiu, H., Sumazin, P., & Chen, T.-W. (2022) · Bioinformatics · doi:10.1093/bioinformatics/btac494 · Cited by 15
“Several algorithms have been devised to deal with the problems that raise in microbiome analysis (Lin and Peddada, 2020; Morton et al., 2019; Weiss et al., 2017).”
Packard, E. E., Durall, D. M., & Jones, M. D. (2023) · Fungal ecology · doi:10.1016/j.funeco.2023.101246 · Cited by 13
Abegaz, F., Abedini, D., White, F. T. G., Guerrieri, A., Zancarini, A., Dong, L., Westerhuis, J. A., van Eeuwijk, F. A., Bouwmeester, H. J., & Smilde, A. K. (2024) · Scientific Reports · doi:10.1038/s41598-024-62437-w · Cited by 14
“For microbiome studies, two forms of normalization have been used: rarefying and scaling 9,32 .”
BackgroundMethodBlankestijn, J. M., Lopez‐Rincon, A., Neerincx, A. H., Vijverberg, S. J. H., Hashimoto, S., Gorenjak, M., Sardón‐Prado, O., Corcuera, P., Korta‐Murua, J., Pino-Yanes, M. D. M., et al. (2023) · Pediatric Allergy and Immunology · doi:10.1111/pai.13919 · Cited by 12
Lv, H., Zhang, Z., Fu, B., Li, Z., Yin, T., Liu, C., Xu, B., Wang, D., Li, B., Hao, J., et al. (2024) · Frontiers in Cellular and Infection Microbiology · doi:10.3389/fcimb.2023.1296554 · Cited by 12
Host diet drives gut microbiome convergence between coral reef fishes and mammals
Degregori, S., Schiettekatte, N. M. D., Casey, J. M., Brandl, S. J., Mercière, A., Amato, K. R., Mazel, F., Parravicini, V., & Barber, P. H. (2024) · Molecular Ecology · doi:10.1111/mec.17520 · Cited by 13
“This ensured that we identified biologically meaningful microbial taxa while avoiding rare microbes that may erroneously show up in differential abundance analyses (Lin & Peddada, 2020).”
Selwyn, J. D., Despard, B. A., Vollmer, M. V., Trytten, E. C., & Vollmer, S. V. (2024) · Environmental Microbiology · doi:10.1111/1462-2920.16700 · Cited by 13
Oral biofilm composition and phenotype in caries-active and caries-free children
Boisen, G., Brogårdh‐Roth, S., Neilands, J., Mira, A., Carda‐Diéguez, M., & Davies, J. R. (2024) · Frontiers in Oral Health · doi:10.3389/froh.2024.1475361 · Cited by 12
Negative binomial factor regression with application to microbiome data analysis
Mishra, A. K., & Müller, C. L. (2022) · Statistics in Medicine · doi:10.1002/sim.9384 · Cited by 12
Applying Artificial Intelligence and machine learning in precision nutrition
Massara, P., Kirkland, J., Pagani, I., Huey, S. L., Hirsh, H., McDonald, D. T., Patel, L., Finkelstein, J. L., Gantz, M. G., Wang, F., et al. (2026) · Nature Communications · doi:10.1038/s41467-026-75004-w · Cited by 15
“…90 , and microbiome studies are often not directly comparable because of variation in sample collection, DNA extraction, sequencing platforms, taxonomic orfunctionalannotationpipelines,andthemixeduseofrelativeversus absolute abundance, which have markedly different statistical considerations 91 .”
Klanliang, K., Asahi, Y., Maezono, H., Sotozono, M., Kuriki, N., Machi, H., Ebisu, S., & Hayashi, M. (2022) · Scientific Reports · doi:10.1038/s41598-022-11477-1 · Cited by 11
Metadata
- Authors
- Lin, H., & Peddada, S. D.
- Affiliations
- National Institutes of Health (US)
- Corresponding author
- Peddada, Shyamal Das
- Venue
- npj Biofilms and Microbiomes
- Published
- 2020-12-02
- Volume
- 6
- Issue
- 1
- Pages
- 60-60
- ISSN
- 2055-5008 (ISSN-L)
- PMC
- PMC7710733
- OpenAlex
- W3109541743
- Cited by
- 341
- References
- 68
- Citations by year
- 2026: 57 · 2025: 73 · 2024: 67 · 2023: 77 · 2022: 55 · 2021: 11
- FWCI
- 3.45
- Type
- journal article
- Language
- en
- Open access
- gold
- doi.org
- Locations
- npj Biofilms and Microbiomes (publishedVersion, cc-by)
- PubMed Central (publishedVersion, cc-by)
- PubMed (publishedVersion)
- Funders
- University of Pittsburgh
- Topics
- Life Sciences › Biochemistry, Genetics and Molecular Biology › Molecular Biology › Gut microbiota and health
- Physical Sciences › Environmental Science › Ecology › Microbial Community Ecology and Physiology
- Life Sciences › Biochemistry, Genetics and Molecular Biology › Molecular Biology › Genomics and Phylogenetic Studies
- Keywords
- microbiome, differential abundance, compositional data, normalization, zero-inflated data, OTU table, sequencing read counts, human microbiome
- MeSH terms
- Gastrointestinal Microbiome, Bacteria, Humans, Models, Theoretical, Mouth, Phylogeny
About these checks
Registry, retraction, Cites and statistics results are computed, not judged, with one exception: a printed reference that no index lists is read once by a model before it counts as a citation error. Claims are extracted by a model and kept only when their quote appears verbatim in the text; each cited source is then checked, with a model’s help, for whether it says what the claim relies on. Those verdicts can be wrong — read the claim’s quote and the cited source before relying on one.
Statistics and arithmetic are recomputed, not judged.
Confidence bands are shown only for fields calibrated on our annotated test set. None is calibrated yet, so no band is shown.
What counts as a claim ›How we measure confidence ›How we check this ›
Are you an author, or do you see a problem with this page? Request a review
