

The DOI matches its Crossref record; 60 of the 60 references it cites were found in a registry or an index.
Fast and interpretable classification of small X-ray diffraction datasets using data augmentation and deep neural networks
Open accessAbstract
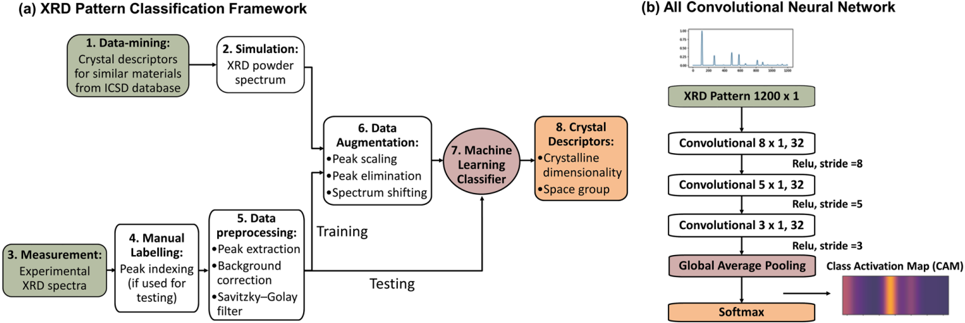
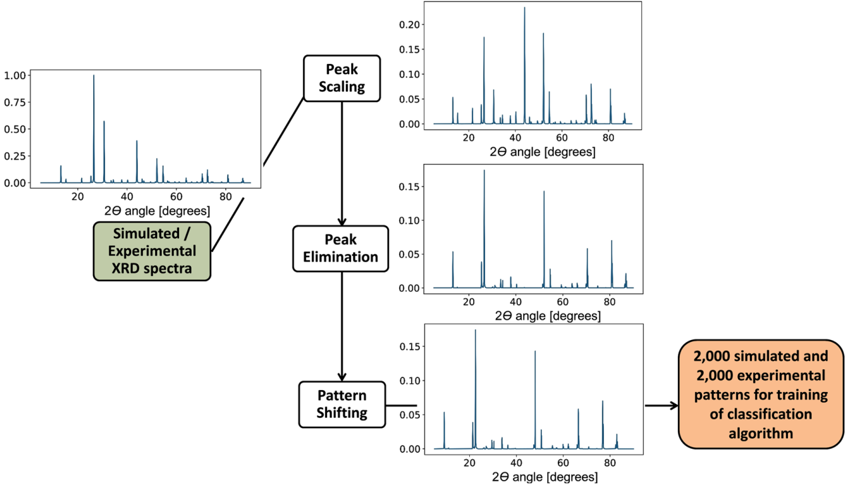
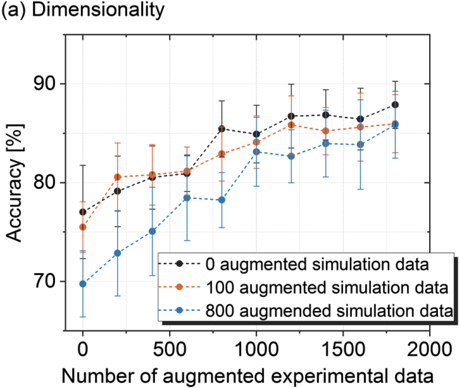
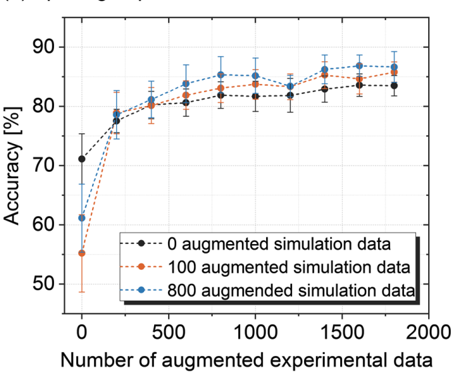
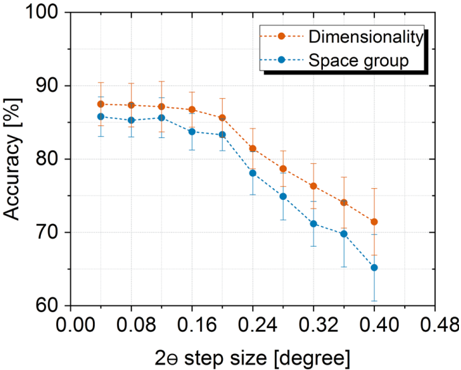
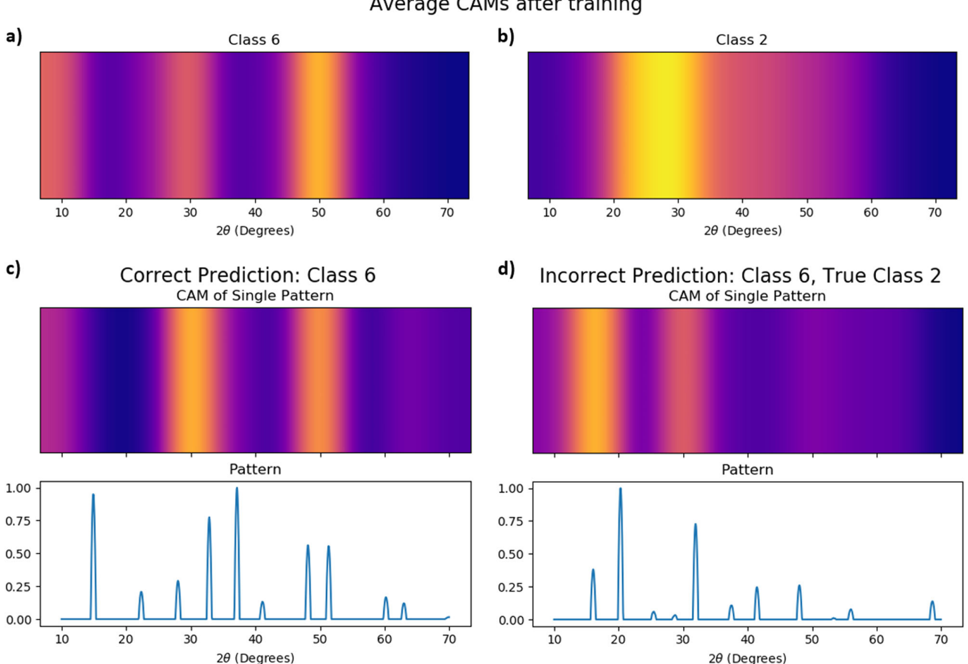
X-ray diffraction (XRD) data acquisition and analysis is among the most time-consuming steps in the development cycle of novel thin-film materials. We propose a machine learning-enabled approach to predict crystallographic dimensionality and space group from a limited number of thin-film XRD patterns. We overcome the scarce data problem intrinsic to novel materials development by coupling a supervised machine learning approach with a model-agnostic, physics-informed data augmentation strategy using simulated data from the Inorganic Crystal Structure Database (ICSD) and experimental data. As a test case, 115 thin-film metal-halides spanning three dimensionalities and seven space groups are synthesized and classified. After testing various algorithms, we develop and implement an all convolutional neural network, with cross-validated accuracies for dimensionality and space group classification of 93 and 89%, respectively. We propose average class activation maps, computed from a global average pooling layer, to allow high model interpretability by human experimentalists, elucidating the root causes of misclassification. Finally, we systematically evaluate the maximum XRD pattern step size (data acquisition rate) before loss of predictive accuracy occurs, and determine it to be 0.16° 2 θ , which enables an XRD pattern to be obtained and classified in 5.5 min or less.
Overview
The claims and statistics of this paper haven’t been checked yet.
Run the check — free, no account needed. It reads the open-access text and checks the sources it cites.
Integrity signals
Registry
Cites
Statistics
Figures

Verification
Claims the paper makes
The claims and statistics of this paper haven’t been checked yet.
Run the check — free, no account needed. It reads the open-access text and checks the sources it cites.
Self-check
Percentages, sums and reported differences re-computed from the paper’s own numbers.
The self-check needs the paper’s full text.
Citations
Cites
Scikit-learn: Machine Learning in Python
Pedregosa, F., Varoquaux, G., Gramfort, A., Michel, V., Thirion, B., Grisel, O., Blondel, M., Müller, A., Nothman, J., Louppe, G., et al. (2012) · arXiv · doi:10.48550/arxiv.1201.0490 · Cited by 71,016
SMOTE synthetic minority over-sampling technique
Chawla, N. V., Bowyer, K. W., Hall, L. O., & Kegelmeyer, W. P. (2002) · Journal of Artificial Intelligence Research · doi:10.1613/jair.953 · Cited by 32,865
The Elements of Statistical Learning
Hastie, T., Friedman, J., & Tibshirani, R. (2001) · Springer Series in Statistics · doi:10.1007/978-0-387-21606-5 · Cited by 24,162
A profile refinement method for nuclear and magnetic structures
Rietveld, H. M. (1969) · Journal of Applied Crystallography · doi:10.1107/s0021889869006558 · Cited by 17,524
Savitzky-Golay Smoothing Filters
Press, W. H., & Teukolsky, S. A. (1990) · Computers in Physics · doi:10.1063/1.4822961 · Cited by 11,670
Learning Deep Features for Discriminative Localization
Zhou, B., Khosla, A., Lapedriza, A., Oliva, A., & Torralba, A. (2016) · 2016 IEEE Conference on Computer Vision and Pattern Recognition (CVPR) · doi:10.1109/cvpr.2016.319 · Cited by 11,428
Efficient Hybrid Solar Cells Based on Meso-Superstructured Organometal Halide Perovskites
Lee, M. M., Teuscher, J., Miyasaka, T., Murakami, T. N., & Snaith, H. J. (2012) · Science · doi:10.1126/science.1228604 · Cited by 10,687
Eperon, G. E., Stranks, S. D., Menelaou, C., Johnston, M. B., Herz, L. M., & Snaith, H. J. (2014) · Energy & Environmental Science · doi:10.1039/c3ee43822h · Cited by 4,140
Striving for Simplicity: The All Convolutional Net
Springenberg, J. T., Dosovitskiy, A., Brox, T., & Riedmiller, M. (2014) · arXiv · doi:10.48550/arxiv.1412.6806 · Cited by 3,447
Baikie, T., Fang, Y., Kadro, J. M., Schreyer, M., Wei, F., Mhaisalkar, S. G., Graetzel, M., & White, T. J. (2013) · Journal of Materials Chemistry A · doi:10.1039/c3ta10518k · Cited by 2,534
Research works printed but not linked: 2
- Goodfellow, I., Bengio, Y., Courville, A. & Bengio, Y. Deep Learning. 1 (MIT Press, Cambridge, 2016).
- Kobayashi, S. & Inaba, K. X-ray thin-film measurement techniques. Mass Spectrosc. Equipped a Ski. Interface 28, 8 (2012).
Cited by
Recent advances and applications of deep learning methods in materials science
Choudhary, K., DeCost, B., Chen, C., Jain, A., Tavazza, F., Cohn, R., Park, C. W., Choudhary, A., Agrawal, A., Billinge, S. J. L., et al. (2022) · npj Computational Materials · doi:10.1038/s41524-022-00734-6 · Cited by 1,172
Self-citationBig-Data Science in Porous Materials: Materials Genomics and Machine Learning
Jablonka, K. M., Ongari, D., Moosavi, S. M., & Smit, B. (2020) · Chemical Reviews · doi:10.1021/acs.chemrev.0c00004 · Cited by 599
Explainable machine learning in materials science
Zhong, X., Gallagher, B., Liu, S., Kailkhura, B., Hiszpanski, A., & Han, T. Y.-J. (2022) · npj Computational Materials · doi:10.1038/s41524-022-00884-7 · Cited by 501
Interpretable and Explainable Machine Learning for Materials Science and Chemistry
Oviedo, F., Ferres, J. L., Buonassisi, T., & Butler, K. T. (2022) · Accounts of Materials Research · doi:10.1021/accountsmr.1c00244 · Cited by 435
Self-citationLiquid-phase sintering of lead halide perovskites and metal-organic framework glasses
Hou, J., Chen, P., Shukla, A., Krajnc, A., Wang, T., Li, X., Doasa, R., Tizei, L. H. G., Chan, B., Johnstone, D. N., et al. (2021) · Science · doi:10.1126/science.abf4460 · Cited by 280
Metadata
- Authors
- Oviedo, F., Ren, Z., Sun, S., Settens, C., Liu, Z., Hartono, N. T. P., Ramasamy, S., DeCost, B. L., Tian, S. I. P., Romano, G., Gilad Kusne, A., & Buonassisi, T.
- Affiliations
- Massachusetts Institute of Technology (US)
- Singapore-MIT Alliance for Research and Technology (SG)
- Agency for Science, Technology and Research (SG)
- National Institute of Standards and Technology (US)
- Corresponding author
- Oviedo, Felipe
- Ren, Zekun
- Buonassisi, Tonio
- ORCID
- Venue
- npj Computational Materials
- Published
- 2019-05-17
- Volume
- 5
- Issue
- 1
- ISSN
- 2057-3960 (ISSN-L)
- OpenAlex
- W2940802411
- Cited by
- 327
- References
- 57
- Citations by year
- 2026: 36 · 2025: 50 · 2024: 49 · 2023: 47 · 2022: 56 · 2021: 53 · 2020: 30 · 2019: 6
- FWCI
- 13.09
- Type
- journal article
- Language
- en
- Open access
- gold
- doi.org
- Licence
- cc-by
- creativecommons.org/licenses/by/4.0 (tdm)
- creativecommons.org/licenses/by/4.0 (vor)
- Locations
- npj Computational Materials (publishedVersion, cc-by)
- arXiv (Cornell University) (submittedVersion)
- DSpace@MIT (Massachusetts Institute of Technology) (submittedVersion, cc-by-nc)
- DOAJ (DOAJ: Directory of Open Access Journals) (submittedVersion)
- OSTI OAI (U.S. Department of Energy Office of Scientific and Technical Information) (submittedVersion)
- arXiv (Cornell University)
- Funders
- National Science Foundation (0819762)
- U.S. Department of Energy (DEEE0007535)
- Massachusetts Institute of Technology
- National Research Foundation
- Agency for Science, Technology and Research (A1898b0043)
- National Institute of Standards and Technology
- Division of Materials Research (DMR - 0819762, 0819762)
- Topics
- Physical Sciences › Materials Science › Materials Chemistry › Machine Learning in Materials Science
- Physical Sciences › Materials Science › Materials Chemistry › X-ray Diffraction in Crystallography
- Physical Sciences › Chemistry › Inorganic Chemistry › Crystal structures of chemical compounds
- Keywords
- thin films, metal halides, data augmentation, physics-informed data augmentation, simulated diffraction patterns, Inorganic Crystal Structure Database, convolutional neural networks, class activation maps, model interpretability, data acquisition rate, data scarcity
About these checks
Registry, retraction, Cites and statistics results are computed, not judged, with one exception: a printed reference that no index lists is read once by a model before it counts as a citation error. Claims are extracted by a model and kept only when their quote appears verbatim in the text; each cited source is then checked, with a model’s help, for whether it says what the claim relies on. Those verdicts can be wrong — read the claim’s quote and the cited source before relying on one.
Statistics and arithmetic are recomputed, not judged.
Confidence bands are shown only for fields calibrated on our annotated test set. None is calibrated yet, so no band is shown.
What counts as a claim ›How we measure confidence ›How we check this ›
Are you an author, or do you see a problem with this page? Request a review
How to cite
Cite CoChat for the checks on this page, and the paper for its own findings.
- This page
- CoChat. (2026). Citation check: Fast and interpretable classification of small X-ray diffraction datasets using data augmentation and deep neural networks. https://app.cochat.ai/papers/10.1038/s41524-019-0196-x
- The paper
- Oviedo, F., Ren, Z., Sun, S., Settens, C., Liu, Z., Hartono, N. T. P., Ramasamy, S., DeCost, B. L., Tian, S. I. P., Romano, G., Gilad Kusne, A., & Buonassisi, T. (2019). Fast and interpretable classification of small X-ray diffraction datasets using data augmentation and deep neural networks. npj Computational Materials. https://doi.org/10.1038/s41524-019-0196-x
Data sources
Bibliographic data: Semantic Scholar, OpenAlex, Crossref.
Contains information from the Semantic Scholar Academic Graph Datasets, made available under the ODC Attribution License (ODC-BY 1.0).
Semantic Scholar’s data is described in: Kinney, R., et al. (2023). The Semantic Scholar Open Data Platform. arXiv:2301.10140.
