

The DOI matches its Crossref record; 143 of the 143 references it cites were found in a registry or an index.
Machine learning for perovskite materials design and discovery
Open accessAbstract
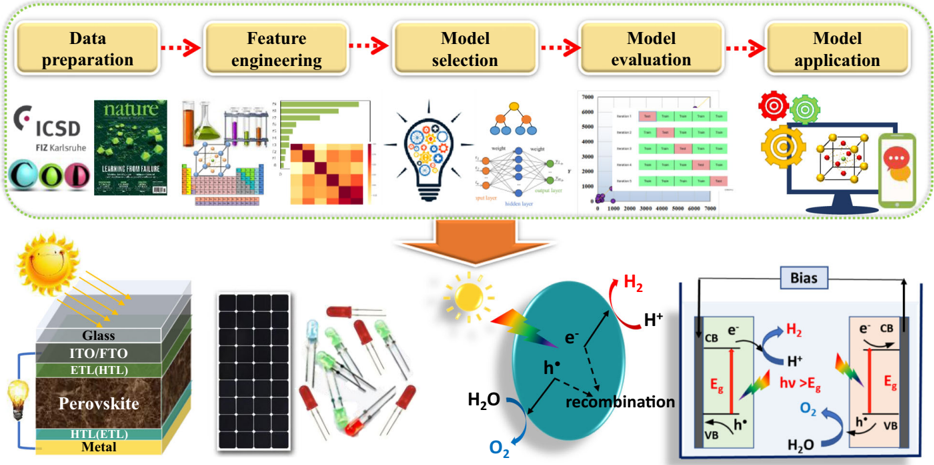
The development of materials is one of the driving forces to accelerate modern scientific progress and technological innovation. Machine learning (ML) technology is rapidly developed in many fields and opening blueprints for the discovery and rational design of materials. In this review, we retrospected the latest applications of ML in assisting perovskites discovery. First, the development tendency of ML in perovskite materials publications in recent years was organized and analyzed. Second, the workflow of ML in perovskites discovery was introduced. Then the applications of ML in various properties of inorganic perovskites, hybrid organic–inorganic perovskites and double perovskites were briefly reviewed. In the end, we put forward suggestions on the future development prospects of ML in the field of perovskite materials.
Overview
The claims and statistics of this paper haven’t been checked yet.
Run the check — free, no account needed. It reads the open-access text and checks the sources it cites.
Integrity signals
Registry
Cites
Statistics
Figures




Verification
Claims the paper makes
The claims and statistics of this paper haven’t been checked yet.
Run the check — free, no account needed. It reads the open-access text and checks the sources it cites.
Claims other papers make about this one
Each is checked against this paper’s own text: does it say what the citing paper says it does?
The source backs part of the claim, not all of it — or backs it for a different population, condition or comparison.
In the citing paper
“The fusion of perovskite sensors with AI systems is hindered by data heterogeneity across domains, real-time processing latency, and limited model generalizability [243].”
From Design Strategies and Emerging Applications of Perovskite-Based Sensors (2025) · cites this paper as [243]
Experimental — accuracy not yet measured
Self-check
Percentages, sums and reported differences re-computed from the paper’s own numbers.
The self-check needs the paper’s full text.
Citations
Cites
Hohenberg, P., & Kohn, W. (1964) · Physical Review · doi:10.1103/physrev.136.b864 · Cited by 53,541
Organometal Halide Perovskites as Visible-Light Sensitizers for Photovoltaic Cells
Kojima, A., Teshima, K., Shirai, Y., & Miyasaka, T. (2009) · Journal of the American Chemical Society · doi:10.1021/ja809598r · Cited by 23,090
Machine learning: Trends, perspectives, and prospects
Jordan, M. I., & Mitchell, T. M. (2015) · Science · doi:10.1126/science.aaa8415 · Cited by 9,955
Efron, B., & Tibshirani, R. (1986) · Statistical Science · doi:10.1214/ss/1177013815 · Cited by 6,033
Machine learning for molecular and materials science
Butler, K. T., Davies, D. W., Cartwright, H., Isayev, O., & Walsh, A. (2018) · Nature · doi:10.1038/s41586-018-0337-2 · Cited by 4,968
Die Gesetze der Krystallochemie
Goldschmidt, V. M. (1926) · Die Naturwissenschaften · doi:10.1007/bf01507527 · Cited by 4,012
Magnetic Materials and Devices for the 21st Century: Stronger, Lighter, and More Energy Efficient
Gutfleisch, O., Willard, M. A., Brück, E., Chen, C. H., Sankar, S. G., & Liu, J. P. (2011) · Advanced Materials · doi:10.1002/adma.201002180 · Cited by 3,809
Human-level concept learning through probabilistic program induction
Lake, B. M., Salakhutdinov, R., & Tenenbaum, J. B. (2015) · Science · doi:10.1126/science.aab3050 · Cited by 2,817
Recent advances and applications of machine learning in solid-state materials science
Schmidt, J., Marques, M. R. G., Botti, S., & Marques, M. A. L. (2019) · npj Computational Materials · doi:10.1038/s41524-019-0221-0 · Cited by 2,607
National Renewable Energy Laboratory
Karim, S., Faissal, A., & Noureddine, E. B. (2022) · Handbook of Algal Biofuels · doi:10.1016/b978-0-12-823764-9.00006-6 · Cited by 2,558
Research works printed but not linked: 3
- Zhou, Z. Machine Learning (Tsinghua University Press, Bei Jing, 2016).
- Xiao, L., Zhang, Q., Xu, X., Ji, X. & Lu, W. Support vector regression assisted predictions the néel temperature of perovskites manganites. Comp. Appl. Chem. 35, 349–357 (2018).
- Xi, Z. Z., Wang, R. Q., Song, Z. C., Guo, Y. G. & Wu, X. Progressing on perovskite-based solar cells. Mod. Chem. Ind. 39, 66–70 (2019).
Cited by
Small data machine learning in materials science
Xu, P., Ji, X., Li, M., & Lu, W. (2023) · npj Computational Materials · doi:10.1038/s41524-023-01000-z · Cited by 866
“…for the same property of the same materials with the same synthesis and characterization methods in different publications, there could still exist some inconsistency in the property values, which may bring the challenges of data uncertainty assessment and the complicated data preprocessing 15 .”
BackgroundMethodSelf-citationAugmenting large language models with chemistry tools
M. Bran, A., Cox, S., Schilter, O., Baldassari, C., White, A. D., & Schwaller, P. (2024) · Nature Machine Intelligence · doi:10.1038/s42256-024-00832-8 · Cited by 794
“…expert-designed artificial intelligence (AI) systems that tackle specific problems, such as reaction prediction 16–20 , retrosynthesis planning 21–27 , molecular property prediction 28–32 , de-novo molecular generation 33,34 , materials design 35,36 and, more recently, Bayesian Optimization 37–39 .”
BackgroundMachine learning in concrete science: applications, challenges, and best practices
Li, Z., Yoon, J., Zhang, R., Rajabipour, F., Srubar III, W. V., Dabo, I., & Radlińska, A. (2022) · npj Computational Materials · doi:10.1038/s41524-022-00810-x · Cited by 388
Yang, C., Ren, C., Jia, Y., Wang, G., Li, M., & Lu, W. (2022) · Acta Materialia · doi:10.1016/j.actamat.2021.117431 · Cited by 335
Self-citationNemani, V., Biggio, L., Huan, X., Hu, Z., Fink, O., Tran, A., Wang, Y., Zhang, X., & Hu, C. (2023) · Mechanical Systems and Signal Processing · doi:10.1016/j.ymssp.2023.110796 · Cited by 243
Metadata
- Authors
- Tao, Q., Xu, P., Li, M., & Lu, W.
- Affiliations
- Shanghai University (CN)
- Corresponding author
- Li, Minjie
- Lu, Wencong
- Venue
- npj Computational Materials
- Published
- 2021-01-29
- Volume
- 7
- Issue
- 1
- ISSN
- 2057-3960 (ISSN-L)
- OpenAlex
- W3129039627
- Cited by
- 542
- References
- 142
- Citations by year
- 2026: 105 · 2025: 150 · 2024: 95 · 2023: 88 · 2022: 64 · 2021: 40
- FWCI
- 21.79
- Type
- journal article
- Language
- en
- Open access
- gold
- doi.org
- Licence
- cc-by
- creativecommons.org/licenses/by/4.0 (tdm)
- creativecommons.org/licenses/by/4.0 (vor)
- Locations
- npj Computational Materials (publishedVersion, cc-by)
- DOAJ (DOAJ: Directory of Open Access Journals) (submittedVersion, cc-by-sa)
- Funders
- Science and Technology Commission of Shanghai Municipality (18520723500)
- National Key Research and Development Program of China
- Topics
- Physical Sciences › Materials Science › Materials Chemistry › Machine Learning in Materials Science
- Physical Sciences › Engineering › Electrical and Electronic Engineering › Perovskite Materials and Applications
- Life Sciences › Pharmacology, Toxicology and Pharmaceutics › Drug Discovery › Computational Drug Discovery Methods
- Keywords
- machine learning, perovskite, materials discovery, rational materials design, all-inorganic perovskites, organic-inorganic hybrid perovskites, double perovskite, property prediction
About these checks
Registry, retraction, Cites and statistics results are computed, not judged, with one exception: a printed reference that no index lists is read once by a model before it counts as a citation error. Claims are extracted by a model and kept only when their quote appears verbatim in the text; each cited source is then checked, with a model’s help, for whether it says what the claim relies on. Those verdicts can be wrong — read the claim’s quote and the cited source before relying on one.
Statistics and arithmetic are recomputed, not judged.
Confidence bands are shown only for fields calibrated on our annotated test set. None is calibrated yet, so no band is shown.
What counts as a claim ›How we measure confidence ›How we check this ›
Are you an author, or do you see a problem with this page? Request a review
How to cite
Cite CoChat for the checks on this page, and the paper for its own findings.
- This page
- CoChat. (2026). Citation check: Machine learning for perovskite materials design and discovery. https://app.cochat.ai/papers/10.1038/s41524-021-00495-8
- The paper
- Tao, Q., Xu, P., Li, M., & Lu, W. (2021). Machine learning for perovskite materials design and discovery. npj Computational Materials. https://doi.org/10.1038/s41524-021-00495-8
Data sources
Bibliographic data: Semantic Scholar, OpenAlex, Crossref.
Contains information from the Semantic Scholar Academic Graph Datasets, made available under the ODC Attribution License (ODC-BY 1.0).
Semantic Scholar’s data is described in: Kinney, R., et al. (2023). The Semantic Scholar Open Data Platform. arXiv:2301.10140.
