

The DOI matches its Crossref record; 37 of the 37 references it cites were found in a registry or an index.
Latent virus reactivation in astronauts on the international space station
Open accessAbstract
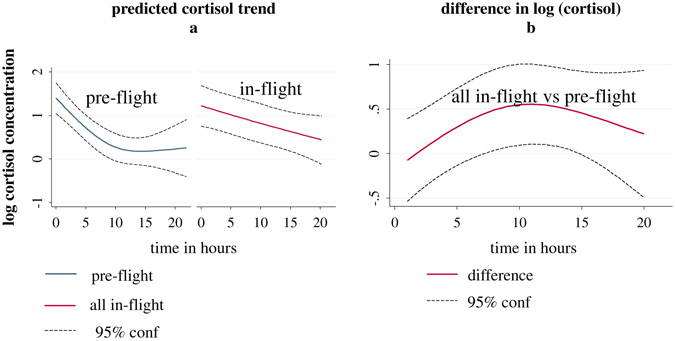
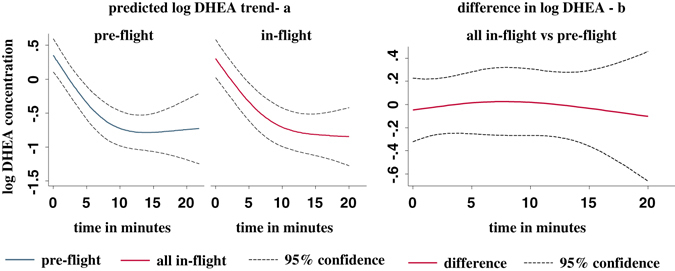
Reactivation of latent herpes viruses was measured in 23 astronauts (18 male and 5 female) before, during, and after long-duration (up to 180 days) spaceflight onboard the international space station . Twenty age-matched and sex-matched healthy ground-based subjects were included as a control group. Blood, urine, and saliva samples were collected before, during, and after spaceflight. Saliva was analyzed for Epstein–Barr virus, varicella-zoster virus, and herpes simplex virus type 1. Urine was analyzed for cytomegalovirus. One astronaut did not shed any targeted virus in samples collected during the three mission phases. Shedding of Epstein–Barr virus, varicella-zoster virus, and cytomegalovirus was detected in 8 of the 23 astronauts. These viruses reactivated independently of each other. Reactivation of Epstein–Barr virus, varicella-zoster virus, and cytomegalovirus increased in frequency, duration, and amplitude (viral copy numbers) when compared to short duration (10 to 16 days) space shuttle missions. No evidence of reactivation of herpes simplex virus type 1, herpes simplex virus type 2, or human herpes virus 6 was found. The mean diurnal trajectory of salivary cortisol changed significantly during flight as compared to before flight (P = 0.010). There was no statistically significant difference in levels of plasma cortisol or dehydoepiandosterone concentrations among time points before, during, and after flight for these international space station crew members, although observed cortisol levels were lower at the mid and late-flight time points. The data confirm that astronauts undertaking long-duration spaceflight experience both increased latent viral reactivation and changes in diurnal trajectory of salivary cortisol concentrations.
Overview
The claims and statistics of this paper haven’t been checked yet.
Run the check — free, no account needed. It reads the open-access text and checks the sources it cites.
Integrity signals
Registry
Cites
Statistics
Figures
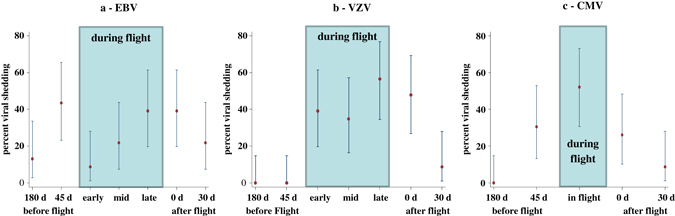
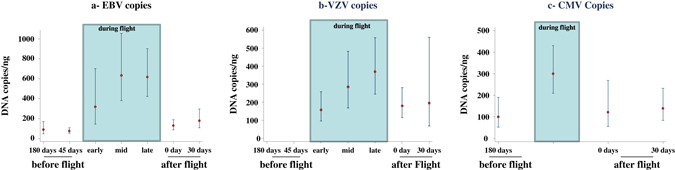
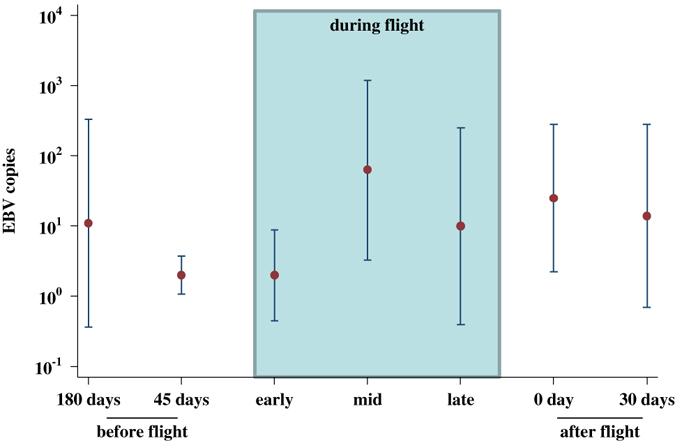
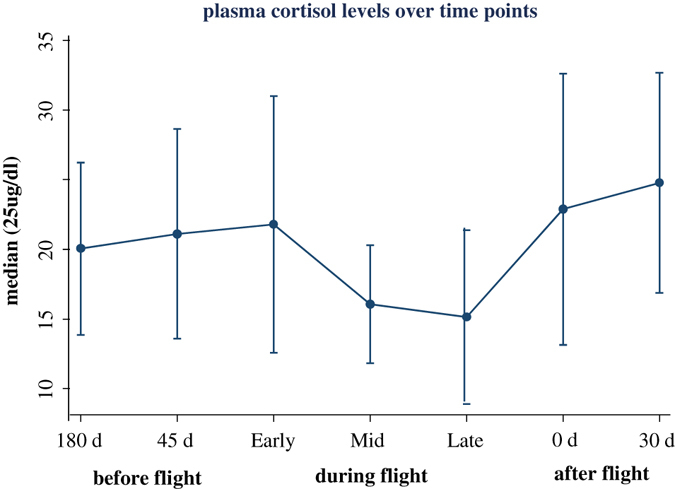
Verification
Claims the paper makes
The claims and statistics of this paper haven’t been checked yet.
Run the check — free, no account needed. It reads the open-access text and checks the sources it cites.
Claims other papers make about this one
Each is checked against this paper’s own text: does it say what the citing paper says it does?
The cited source doesn’t support the claim as written.
In the citing paper
“The reactivation of HSV has been observed in missions from 10 to >180 days in shuttles and ISS, respectively.”
From Key points for the development of antioxidant cocktails to prevent cellular stress and damage caused by reactive oxygen species (ROS) during manned space missions (2021) · cites this paper as [211]
Checked by a reasoning model — may be wrong.
Experimental — accuracy not yet measured
Self-check
Percentages, sums and reported differences re-computed from the paper’s own numbers.
The self-check needs the paper’s full text.
Citations
Cites
Calcium's Role in Mechanotransduction during Muscle Development
Damm, T. B., & Egli, M. (2014) · Cellular Physiology and Biochemistry · doi:10.1159/000356667 · Cited by 14,552
Manual of Clinical Microbiology.
(1980) · Annals of Internal Medicine · doi:10.7326/0003-4819-93-6-939_2 · Cited by 14,435
Everitt, B. S. (2001) · Psychology Press eBooks · doi:10.4324/9781410605542-11 · Cited by 6,877
Miller, G. E., Chen, E., & Zhou, E. S. (2007) · Psychological Bulletin · doi:10.1037/0033-2909.133.1.25 · Cited by 2,467
Generalized Latent Variable Modeling: Multilevel, Longitudinal, and Structural Equation Models
Skrondal, A., & Rabe‐Hesketh, S. (2004) · Thammasat University Digital Collections · Cited by 1,505
Diurnal Cortisol Rhythm as a Predictor of Breast Cancer Survival
Sephton, S. E. (2000) · Journal of the National Cancer Institute · doi:10.1093/jnci/92.12.994 · Cited by 1,082
The cortisol awakening response: More than a measure of HPA axis function
Clow, A., Hucklebridge, F., Stalder, T., Evans, P., & Thorn, L. (2010) · Neuroscience & Biobehavioral Reviews · doi:10.1016/j.neubiorev.2009.12.011 · Cited by 635
Pathophysiological basis of orthostatic hypotension in autonomic failure
Smit, A. A. J., Halliwill, J. R., Low, P. A., & Wieling, W. (1999) · The Journal of Physiology · doi:10.1111/j.1469-7793.1999.0001o.x · Cited by 387
Goldstein, D. S. (2010) · Cellular and Molecular Neurobiology · doi:10.1007/s10571-010-9606-9 · Cited by 288
Stress-induced subclinical reactivation of varicella zoster virus in astronauts
Mehta, S. K., Cohrs, R. J., Forghani, B., Zerbe, G., Gilden, D. H., & Pierson, D. L. (2004) · Journal of Medical Virology · doi:10.1002/jmv.10555 · Cited by 275
Self-citation
Research works printed but not linked: 1
- Greene, W. H. et al. (eds) Econometric Analysis (Prentice Hall, 2000).
Cited by
Sorted by citations
Fundamental Biological Features of Spaceflight: Advancing the Field to Enable Deep-Space Exploration
Afshinnekoo, E., Scott, R. T., MacKay, M. J., Pariset, E., Cekanaviciute, E., Barker, R. J., Gilroy, S., Hassane, D. C., Smith, S. M., Zwart, S. R., et al. (2020) · Cell · doi:10.1016/j.cell.2020.10.050 · Cited by 496
Self-citationCrucian, B. E., Choukèr, A., Simpson, R. J., Mehta, S., Marshall, G., Smith, S. M., Zwart, S. R., Heer, M., Ponomarev, S., Whitmire, A., et al. (2018) · Frontiers in Immunology · doi:10.3389/fimmu.2018.01437 · Cited by 421
Self-citationVoorhies, A. A., Ott, C. M., Mehta, S. K., Pierson, D. L., Crucian, B. E., Feiveson, A. H., Oubre, C. M., Torralba, M., Moncera, K. J., Zhang, Y., et al. (2019) · Scientific Reports · doi:10.1038/s41598-019-46303-8 · Cited by 278
Self-citationHerpes Virus Reactivation in Astronauts During Spaceflight and Its Application on Earth
Rooney, B. V., Crucian, B. E., Pierson, D. L., Laudenslager, M. L., & Mehta, S. K. (2019) · Frontiers in Microbiology · doi:10.3389/fmicb.2019.00016 · Cited by 174
Self-citationHuman Health during Space Travel: State-of-the-Art Review
Krittanawong, C., Singh, N. K., Scheuring, R. A., Urquieta, E., Bershad, E. M., Macaulay, T. R., Kaplin, S. L., Dunn, C., Kry, S. F., Russomano, T., et al. (2022) · Cells · doi:10.3390/cells12010040 · Cited by 188
Self-citation
Metadata
- Authors
- Mehta, S. K., Laudenslager, M. L., Stowe, R. P., Crucian, B. E., Feiveson, A. H., Sams, C. F., & Pierson, D. L.
- Affiliations
- Johnson Space Center (US)
- University of Colorado Anschutz (US)
- Microgen (United States) (US)
- Corresponding author
- Mehta, Satish K.
- Venue
- npj Microgravity
- Published
- 2017-04-12
- Volume
- 3
- Issue
- 1
- Pages
- 11-11
- ISSN
- 2373-8065 (ISSN-L)
- PMC
- PMC5445581
- OpenAlex
- W2605076090
- Cited by
- 188
- References
- 37
- Citations by year
- 2026: 15 · 2025: 33 · 2024: 24 · 2023: 21 · 2022: 22 · 2021: 20 · 2020: 19 · 2019: 25 · 2018: 9
- FWCI
- 10.73
- Type
- journal article
- Language
- en
- Open access
- gold
- doi.org
- Locations
- npj Microgravity (publishedVersion, cc-by)
- Europe PMC (PubMed Central) (publishedVersion, cc-by)
- PubMed Central (publishedVersion, cc-by)
- PubMed (publishedVersion)
- DOAJ (DOAJ: Directory of Open Access Journals) (submittedVersion, cc-by-sa)
- Funders
- National Aeronautics and Space Administration (111-30-10-06, 111-30-10-03)
- Topics
- Health Sciences › Medicine › Physiology (medical) › Spaceflight effects on biology
- Health Sciences › Medicine › Infectious Diseases › Herpesvirus Infections and Treatments
- Health Sciences › Medicine › Epidemiology › Cytomegalovirus and herpesvirus research
- Keywords
- latent viral reactivation, astronauts, long-duration spaceflight, International Space Station, Epstein-Barr virus, varicella-zoster virus, cytomegalovirus, herpes simplex virus type 1, herpes simplex virus type 2, human herpesvirus 6, salivary cortisol, diurnal cortisol rhythm, dehydroepiandrosterone, spaceflight immunology
About these checks
Registry, retraction, Cites and statistics results are computed, not judged, with one exception: a printed reference that no index lists is read once by a model before it counts as a citation error. Claims are extracted by a model and kept only when their quote appears verbatim in the text; each cited source is then checked, with a model’s help, for whether it says what the claim relies on. Those verdicts can be wrong — read the claim’s quote and the cited source before relying on one.
Statistics and arithmetic are recomputed, not judged.
Confidence bands are shown only for fields calibrated on our annotated test set. None is calibrated yet, so no band is shown.
What counts as a claim ›How we measure confidence ›How we check this ›
Are you an author, or do you see a problem with this page? Request a review
