Student or educator? Sign up with your school email and get 6 months of Pro free.
Cited by 72

The DOI matches its Crossref record; 70 of the 70 references it cites were found in a registry or an index.

Hyaluronic acid–GPRC5C signalling promotes dormancy in haematopoietic stem cells

Zhang, Yu Wei, Mess, Julian, Aizarani, Nadim, Mishra, Pankaj, Johnson, Carys, Romero-Mulero, Mari Carmen, Rettkowski, Jasmin, Schönberger, Katharina, Obier, Nadine, Jäcklein, Karin, Woessner, Nadine M., Lalioti, Maria-Eleni, Velasco-Hernandez, Talia, Sikora, Katarzyna, Wäsch, Ralph, Lehnertz, Bernhard, Sauvageau, Guy, Manke, Thomas, Menendez, Pablo, Walter, Sebastian Gottfried, Minguet, Susana, Laurenti, Elisa, Günther, Stefan, Grün, Dominic, Cabezas-Wallscheid, Nina·2022·Nature Cell Biology

Abstract

Bone marrow haematopoietic stem cells (HSCs) are vital for lifelong maintenance of healthy haematopoiesis. In inbred mice housed in gnotobiotic facilities, the top of the haematopoietic hierarchy is occupied by dormant HSCs, which reversibly exit quiescence during stress. Whether HSC dormancy exists in humans remains debatable. Here, using single-cell RNA sequencing, we show a continuous landscape of highly purified human bone marrow HSCs displaying varying degrees of dormancy. We identify the orphan receptor GPRC5C, which enriches for dormant human HSCs. GPRC5C is also essential for HSC function, as demonstrated by genetic loss- and gain-of-function analyses. Through structural modelling and biochemical assays, we show that hyaluronic acid, a bone marrow extracellular matrix component, preserves dormancy through GPRC5C. We identify the hyaluronic acid–GPRC5C signalling axis controlling the state of dormancy in mouse and human HSCs.

Overview

The claims and statistics of this paper haven’t been checked yet.

Run the check — free, no account needed. It reads the open-access text and checks the sources it cites.

A few free checks a day · papers already verified open instantly · results are public

Integrity signals

Registry

Crossref · 10.1038/s41556-022-00931-x

Cites

70 of 70 references verified0 citation errors · 0 not checkable

Statistics

Figures

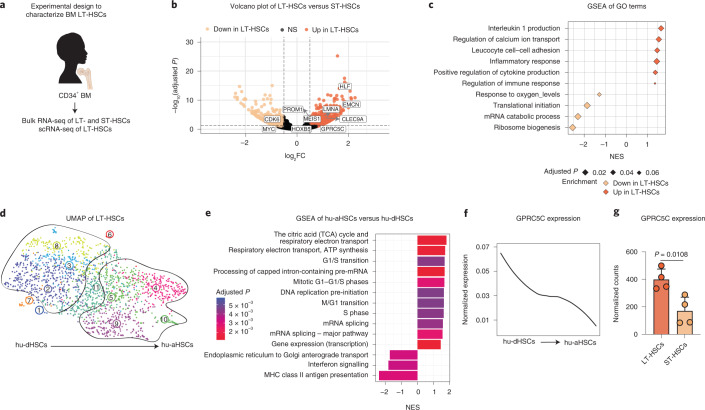
Fig. 1 Identification of a highly dormant HSC population in human BM. a, Experimental design to characterize LT-HSCs from human BM donors. b, Volcano plot depicting DEGs between LT-HSCs and ST-HSCs from four BM donors. Benjamini–Hochberg (BH)-adjusted P values after Wald test. log2FC ≥0.5; adjusted P < 0.1. c, GSEA of GO terms in LT-HSCs compared with ST-HSCs. Normalized enrichment score (NES). d, UMAP of single-cell transcriptomes of human BM LT-HSCs from two donors highlighting VarID clusters. Numbers denote clusters. e, GSEA for genes that were differentially expressed between clusters 4, 5, 9 and 10 (hu-aHSCs) and 2, 3 and 8 (hu-dHSCs). BH-corrected P ≤ 0.05. f, Smoothed pseudo-temporal normalized expression profile of GPRC5C in LT-HSCs. Smoothed profiles were computed by local regression. g, Bulk RNA-seq data depicting normalized counts of GPRC5C in LT-HSCs and ST-HSCs. n = 4 biological replicates. Two-tailed t-test was performed. Data are presented as mean ± s.d. The y axis of the smoothed pseudo-temporal expression profiles indicates normalized expression. GSEA was performed with BH-adjusted P values after adaptive multi-level splitting Monte Carlo approach. LT-HSCs (CD34+CD38−CD45RA−CD90+CD49f+), ST-HSCs (CD34+CD38−CD45RA−CD90−CD49f−) and HSCs (CD34+CD38−). Source numerical data are available in source data. Source data
Fig. 1 Identification of a highly dormant HSC population in human BM. a, Experimental design to characterize LT-HSCs from human BM donors. b, Volcano plot depicting DEGs between LT-HSCs and ST-HSCs from four BM donors. Benjamini–Hochberg (BH)-adjusted P values after Wald test. log2FC ≥0.5; adjusted P < 0.1. c, GSEA of GO terms in LT-HSCs compared with ST-HSCs. Normalized enrichment score (NES). d, UMAP of single-cell transcriptomes of human BM LT-HSCs from two donors highlighting VarID clusters. Numbers denote clusters. e, GSEA for genes that were differentially expressed between clusters 4, 5, 9 and 10 (hu-aHSCs) and 2, 3 and 8 (hu-dHSCs). BH-corrected P ≤ 0.05. f, Smoothed pseudo-temporal normalized expression profile of GPRC5C in LT-HSCs. Smoothed profiles were computed by local regression. g, Bulk RNA-seq data depicting normalized counts of GPRC5C in LT-HSCs and ST-HSCs. n = 4 biological replicates. Two-tailed t-test was performed. Data are presented as mean ± s.d. The y axis of the smoothed pseudo-temporal expression profiles indicates normalized expression. GSEA was performed with BH-adjusted P values after adaptive multi-level splitting Monte Carlo approach. LT-HSCs (CD34+CD38−CD45RA−CD90+CD49f+), ST-HSCs (CD34+CD38−CD45RA−CD90−CD49f−) and HSCs (CD34+CD38−). Source numerical data are available in source data. Source dataCC BY · PubMed Central
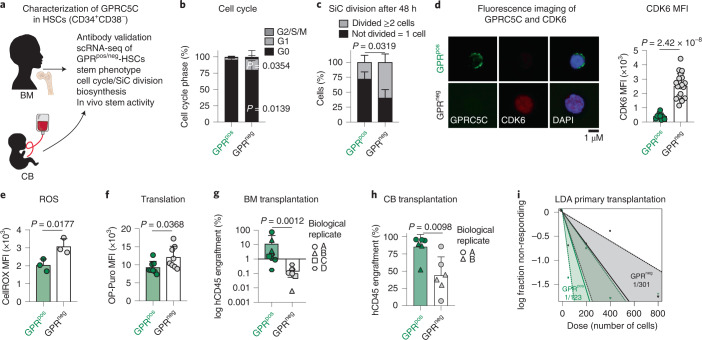
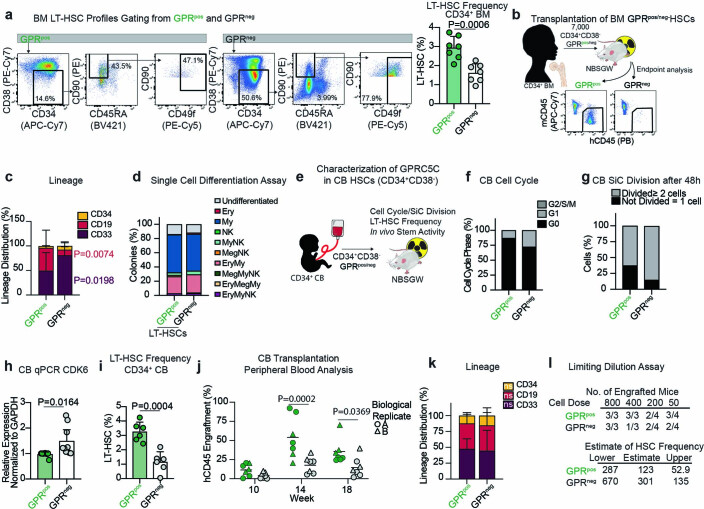
Fig. 2 Characterization of GPRC5C as a marker of quiescent stem cells. a, Experimental design to characterize GPRC5C in human BM and CB. b, Fluorescence-activated cell sorting (FACS)-based analysis of cell cycle from BM GPRC5Cpos/neg-HSCs. n = 5 biological replicates. c, Single-cell (SiC) division assay of GPRC5Cpos/neg-HSCs from BM donors quantified after 48 h in vitro culture. n = 3 biological replicates. d, Left: fluorescence imaging of GPRC5C overlaid with intracellular CDK6 expression from BM HSCs. Right: quantification of the median fluorescence intensity (MFI) of CDK6 in GPRC5Cpos/neg-HSCs from two BM donors. n = 10 GPRC5Cpos cells and n = 20 GPRC5Cneg cells. e, FACS measurement of CellROX Deep Red MFI in GPRC5Cpos/neg-HSCs from BM donors. n = 3 biological replicates. f, FACS measurement of OP-Puro MFI in GPRC5Cpos/neg-HSCs from BM donors. n = 8 biological replicates. g, GPRC5Cpos/neg-HSCs from four BM donors were transplanted in NSBGW mice, which were killed at 36 weeks. Engraftment was assessed by percentage of human CD45-positive cells. n = 9 biological replicates. h, 800 GPRC5Cpos/neg-HSCs from two CB donors were transplanted in NSBGW mice, which were killed at 24 weeks. Engraftment was assessed by percentage of human CD45-positive cells. n = 6 biological replicates. i, LDA to estimate the HSC frequency within GPRC5Cpos/neg-HSCs from two CB donors at 24 weeks post-transplantation by extreme limiting dilution analysis (ELDA). All data presented as mean ± s.d. Statistical significance was determined by two-tailed t-test (d, e, f and h), two-way analysis of variance (ANOVA) (b and c), or Mann–Whitney U test (g). NS, not significant. n indicates number of replicates. For all experiments, at least two independent experiments were performed. Source numerical data are available in source data. Source data
Fig. 2 Characterization of GPRC5C as a marker of quiescent stem cells. a, Experimental design to characterize GPRC5C in human BM and CB. b, Fluorescence-activated cell sorting (FACS)-based analysis of cell cycle from BM GPRC5Cpos/neg-HSCs. n = 5 biological replicates. c, Single-cell (SiC) division assay of GPRC5Cpos/neg-HSCs from BM donors quantified after 48 h in vitro culture. n = 3 biological replicates. d, Left: fluorescence imaging of GPRC5C overlaid with intracellular CDK6 expression from BM HSCs. Right: quantification of the median fluorescence intensity (MFI) of CDK6 in GPRC5Cpos/neg-HSCs from two BM donors. n = 10 GPRC5Cpos cells and n = 20 GPRC5Cneg cells. e, FACS measurement of CellROX Deep Red MFI in GPRC5Cpos/neg-HSCs from BM donors. n = 3 biological replicates. f, FACS measurement of OP-Puro MFI in GPRC5Cpos/neg-HSCs from BM donors. n = 8 biological replicates. g, GPRC5Cpos/neg-HSCs from four BM donors were transplanted in NSBGW mice, which were killed at 36 weeks. Engraftment was assessed by percentage of human CD45-positive cells. n = 9 biological replicates. h, 800 GPRC5Cpos/neg-HSCs from two CB donors were transplanted in NSBGW mice, which were killed at 24 weeks. Engraftment was assessed by percentage of human CD45-positive cells. n = 6 biological replicates. i, LDA to estimate the HSC frequency within GPRC5Cpos/neg-HSCs from two CB donors at 24 weeks post-transplantation by extreme limiting dilution analysis (ELDA). All data presented as mean ± s.d. Statistical significance was determined by two-tailed t-test (d, e, f and h), two-way analysis of variance (ANOVA) (b and c), or Mann–Whitney U test (g). NS, not significant. n indicates number of replicates. For all experiments, at least two independent experiments were performed. Source numerical data are available in source data. Source dataCC BY · PubMed Central
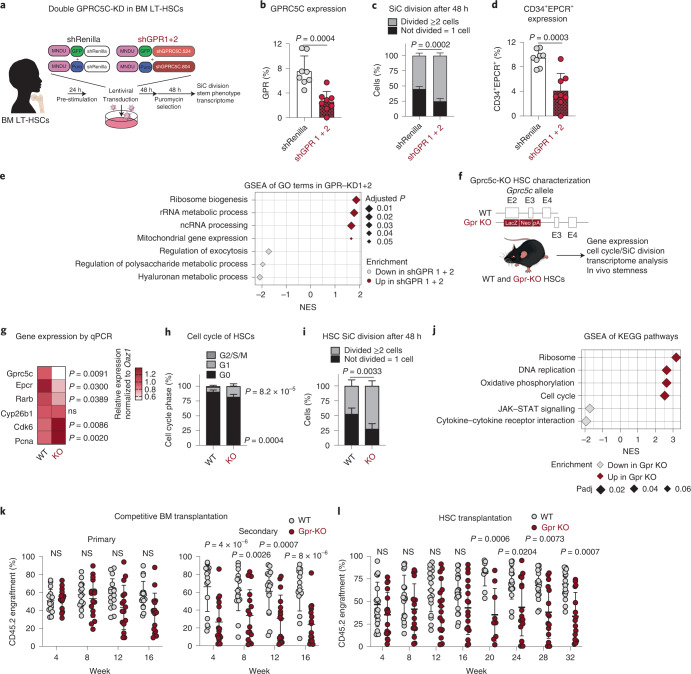
Fig. 3 Loss of GPRC5C impairs stemness and quiescence. a, Experimental design to knock down and assess the impact of decreased GPRC5C levels in BM LT-HSCs. b, FACS validation of GPRC5C protein levels. n = 8 experiments. c, SiC division assay of GFP+ BM cells quantified after 48 h in vitro culture. n = 4 experiments for shGPR1 + 2 and n = 5 experiments for shRenilla. d, Surface expression of CD34+EPCR+ in GFP+ BM cells. n = 8 experiments. e, GSEA of GO terms in shGPR 1 + 2 compared with shRenilla control. f, Experimental design to assess functional impact of Gprc5c KO in mouse HSCs. Deletion of Gprc5c was achieved by the insertion of LacZ downstream of the translation initiation site in exon 2 of both alleles. g, Differential gene expression. Heat map representing median RNA expression from qPCR data (normalized to housekeeping gene Oaz1 and WT control). n = 8 biological replicates. h, FACS-based HSC cell cycle analysis with Ki-67 and DAPI. n = 5 biological replicates. i, SiC division assay of Gprc5c-KO and WT control HSCs quantified after 48 h in vitro culture. n = 4 biological replicates for Gpr KO and n = 5 biological replicates for WT. j, GSEA of KEGG pathways in Gprc5c-KO compared with WT control HSCs. k, PB analysis of competitive WBM chimaeras. CD45.2 cell percentage outcome in PB is presented. n = 16 biological replicates. l, PB analysis of HSC transplants. CD45.2 cell percentage outcome in PB is presented. n = 17 biological replicates for Gpr KO and n = 18 biological replicates for WT. All data presented as mean ± s.d. Statistical significance was determined by two-tailed t-test (b, d and g) or two-way ANOVA (c, h, I, k and l). n indicates number of replicates. GSEA was performed with BH-adjusted P values after adaptive multi-level splitting Monte Carlo approach. For all experiments, at least two independent experiments were performed. At least two human BM donors were used (b–d). Source numerical data are available in source data. Source data
Fig. 3 Loss of GPRC5C impairs stemness and quiescence. a, Experimental design to knock down and assess the impact of decreased GPRC5C levels in BM LT-HSCs. b, FACS validation of GPRC5C protein levels. n = 8 experiments. c, SiC division assay of GFP+ BM cells quantified after 48 h in vitro culture. n = 4 experiments for shGPR1 + 2 and n = 5 experiments for shRenilla. d, Surface expression of CD34+EPCR+ in GFP+ BM cells. n = 8 experiments. e, GSEA of GO terms in shGPR 1 + 2 compared with shRenilla control. f, Experimental design to assess functional impact of Gprc5c KO in mouse HSCs. Deletion of Gprc5c was achieved by the insertion of LacZ downstream of the translation initiation site in exon 2 of both alleles. g, Differential gene expression. Heat map representing median RNA expression from qPCR data (normalized to housekeeping gene Oaz1 and WT control). n = 8 biological replicates. h, FACS-based HSC cell cycle analysis with Ki-67 and DAPI. n = 5 biological replicates. i, SiC division assay of Gprc5c-KO and WT control HSCs quantified after 48 h in vitro culture. n = 4 biological replicates for Gpr KO and n = 5 biological replicates for WT. j, GSEA of KEGG pathways in Gprc5c-KO compared with WT control HSCs. k, PB analysis of competitive WBM chimaeras. CD45.2 cell percentage outcome in PB is presented. n = 16 biological replicates. l, PB analysis of HSC transplants. CD45.2 cell percentage outcome in PB is presented. n = 17 biological replicates for Gpr KO and n = 18 biological replicates for WT. All data presented as mean ± s.d. Statistical significance was determined by two-tailed t-test (b, d and g) or two-way ANOVA (c, h, I, k and l). n indicates number of replicates. GSEA was performed with BH-adjusted P values after adaptive multi-level splitting Monte Carlo approach. For all experiments, at least two independent experiments were performed. At least two human BM donors were used (b–d). Source numerical data are available in source data. Source dataCC BY · PubMed Central
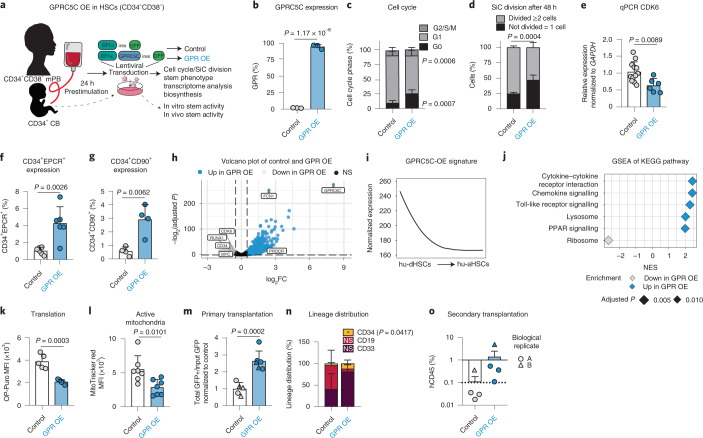
Fig. 4 GPRC5C OE enhances stemness. a, Experimental design of GPRC5C OE in mPB and CB. Internal ribosomal entry site (ires). b, FACS validation of GPRC5C OE at protein level. n = 3 experiments. c, FACS-based cell cycle analysis of GPRC5C OE and control. n = 6 experiments. d, SiC division assay of GPRC5C OE and control quantified after 48 h in vitro culture. n = 4 experiments. e, qPCR of CDK6 expression. Normalized to housekeeping gene GAPDH and control. n = 6 experiments for GPRC5C OE and n = 12 experiments for control. f, Surface expression of CD34+EPCR+ in GPRC5C OE and control. n = 6 experiments. g, Surface expression of CD34+CD90+ in GPRC5C OE and control. n = 4 experiments. h, Volcano plot depicting DEGs between GPRC5C OE and control. Key genes associated with dormancy and stemness are highlighted. BH-adjusted P values after Wald test. log2FC ≥0.5; adjusted P < 0.1. i, Smoothed pseudo-temporal expression profile of the GPRC5C-OE signature in LT-HSCs. Smoothed profiles were computed by local regression. The y axis indicates normalized expression. j, GSEA of KEGG pathways in GPRC5C OE compared with control. Performed with BH-adjusted P values after adaptive multi-level splitting Monte Carlo approach. k, FACS measurement of OP-Puro MFI in GPRC5C OE and control. n = 5 experiments. l, FACS measurement of MitoTracker Red MFI in GPRC5C OE and control. n = 7 experiments. m, Transplantation of GPRC5C OE and control in CB cells from two biological replicates. Engraftment was measured from BM and calculated by the ratio of the total percentage GFP+hCD45+ to the percentage input GFP post-transplantation and normalized to control. n = 5 control and n = 6 GPR-OE biological replicates. n, Lineage distribution of GPRC5C OE and control in CB cells. Distribution of myeloid (CD33), B-lymphoid (CD19) and immature surface phenotype (CD34) are presented. n = 5 control and n = 6 GPR-OE biological replicates. o, Secondary transplantation of 150,000 GFP+hCD45+ cells. n = 4 biological replicates. All data presented as mean ± s.d. Statistical significance was determined using two-tailed t-test (b, e, f, g, l, m, n and k) or two-way ANOVA (c and d). n indicates number of replicates. For all experiments, at least two independent experiments were performed. At least two human mPB or CB donors were used. Source numerical data are available in source data. Source data
Fig. 4 GPRC5C OE enhances stemness. a, Experimental design of GPRC5C OE in mPB and CB. Internal ribosomal entry site (ires). b, FACS validation of GPRC5C OE at protein level. n = 3 experiments. c, FACS-based cell cycle analysis of GPRC5C OE and control. n = 6 experiments. d, SiC division assay of GPRC5C OE and control quantified after 48 h in vitro culture. n = 4 experiments. e, qPCR of CDK6 expression. Normalized to housekeeping gene GAPDH and control. n = 6 experiments for GPRC5C OE and n = 12 experiments for control. f, Surface expression of CD34+EPCR+ in GPRC5C OE and control. n = 6 experiments. g, Surface expression of CD34+CD90+ in GPRC5C OE and control. n = 4 experiments. h, Volcano plot depicting DEGs between GPRC5C OE and control. Key genes associated with dormancy and stemness are highlighted. BH-adjusted P values after Wald test. log2FC ≥0.5; adjusted P < 0.1. i, Smoothed pseudo-temporal expression profile of the GPRC5C-OE signature in LT-HSCs. Smoothed profiles were computed by local regression. The y axis indicates normalized expression. j, GSEA of KEGG pathways in GPRC5C OE compared with control. Performed with BH-adjusted P values after adaptive multi-level splitting Monte Carlo approach. k, FACS measurement of OP-Puro MFI in GPRC5C OE and control. n = 5 experiments. l, FACS measurement of MitoTracker Red MFI in GPRC5C OE and control. n = 7 experiments. m, Transplantation of GPRC5C OE and control in CB cells from two biological replicates. Engraftment was measured from BM and calculated by the ratio of the total percentage GFP+hCD45+ to the percentage input GFP post-transplantation and normalized to control. n = 5 control and n = 6 GPR-OE biological replicates. n, Lineage distribution of GPRC5C OE and control in CB cells. Distribution of myeloid (CD33), B-lymphoid (CD19) and immature surface phenotype (CD34) are presented. n = 5 control and n = 6 GPR-OE biological replicates. o, Secondary transplantation of 150,000 GFP+hCD45+ cells. n = 4 biological replicates. All data presented as mean ± s.d. Statistical significance was determined using two-tailed t-test (b, e, f, g, l, m, n and k) or two-way ANOVA (c and d). n indicates number of replicates. For all experiments, at least two independent experiments were performed. At least two human mPB or CB donors were used. Source numerical data are available in source data. Source dataCC BY · PubMed Central
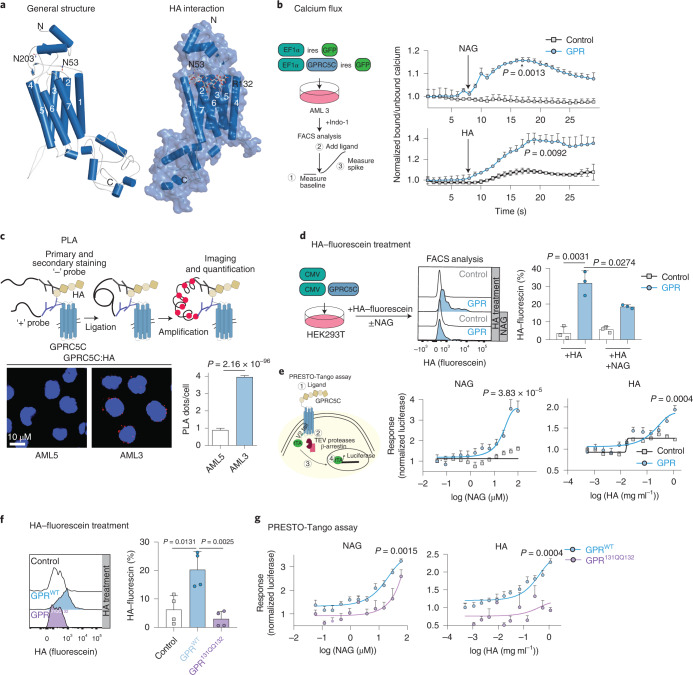
Fig. 5 HA activates GPRC5C signalling. a, Left: structural modelling of GPRC5C. Right: docked pose of the HA at the 7TM region of GPRC5C. b, Experimental design to determine intracellular calcium concentrations upon interaction with putative ligands. Normalized baseline calcium followed by flux in response to HA or NAG in control and GPRC5C-OE conditions in AML3. n = 3 experiments. c, PLA between GPRC5C and HA, showing a distance smaller than 80 nm in AML3 cells but not AML5 cells. Plot representative of one of three independent experiments. Each independent experiment was performed in two technical replicates. n = 2250 cells for AML5 and n = 2091 cells for AML3. Presented as mean ± s.e.m. d, HA–fluorescein treatment of HEK293T cells expressing GPRC5C and control. FACS plot representing HA retention in each condition. n = 3 experiments. e, Left: schematic representation of PRESTO-Tango assay. Right: concentration–response curve of PRESTO-Tango construct for GPRC5C and control vector treated with NAG and HA in HTLA cells. Normalized to luciferase signal at the lowest concentration. n = 6 experiments for NAG and n = 5 experiments for HA. f. HA–fluorescein treatment of HEK293T cells expressing GPRC5CWT, GPRC5C131QQ132 and control. FACS plot representing HA retention in each condition. n = 4 experiments. g, Concentration–response curve of PRESTO-Tango construct for GPRC5C WT and site-specific mutant (GPRC5C131QQ132) at predicted HA interaction site in HTLA cells. n = 6 experiments. All data presented as mean ± s.d. unless otherwise stated. Statistical significance was determined using unpaired two-tailed t-test (b, c, d, e, f and g). n indicates number of replicates. For all experiments, at least two independent experiments were performed. Source numerical data are available in source data. Source data
Fig. 5 HA activates GPRC5C signalling. a, Left: structural modelling of GPRC5C. Right: docked pose of the HA at the 7TM region of GPRC5C. b, Experimental design to determine intracellular calcium concentrations upon interaction with putative ligands. Normalized baseline calcium followed by flux in response to HA or NAG in control and GPRC5C-OE conditions in AML3. n = 3 experiments. c, PLA between GPRC5C and HA, showing a distance smaller than 80 nm in AML3 cells but not AML5 cells. Plot representative of one of three independent experiments. Each independent experiment was performed in two technical replicates. n = 2250 cells for AML5 and n = 2091 cells for AML3. Presented as mean ± s.e.m. d, HA–fluorescein treatment of HEK293T cells expressing GPRC5C and control. FACS plot representing HA retention in each condition. n = 3 experiments. e, Left: schematic representation of PRESTO-Tango assay. Right: concentration–response curve of PRESTO-Tango construct for GPRC5C and control vector treated with NAG and HA in HTLA cells. Normalized to luciferase signal at the lowest concentration. n = 6 experiments for NAG and n = 5 experiments for HA. f. HA–fluorescein treatment of HEK293T cells expressing GPRC5CWT, GPRC5C131QQ132 and control. FACS plot representing HA retention in each condition. n = 4 experiments. g, Concentration–response curve of PRESTO-Tango construct for GPRC5C WT and site-specific mutant (GPRC5C131QQ132) at predicted HA interaction site in HTLA cells. n = 6 experiments. All data presented as mean ± s.d. unless otherwise stated. Statistical significance was determined using unpaired two-tailed t-test (b, c, d, e, f and g). n indicates number of replicates. For all experiments, at least two independent experiments were performed. Source numerical data are available in source data. Source dataCC BY · PubMed Central
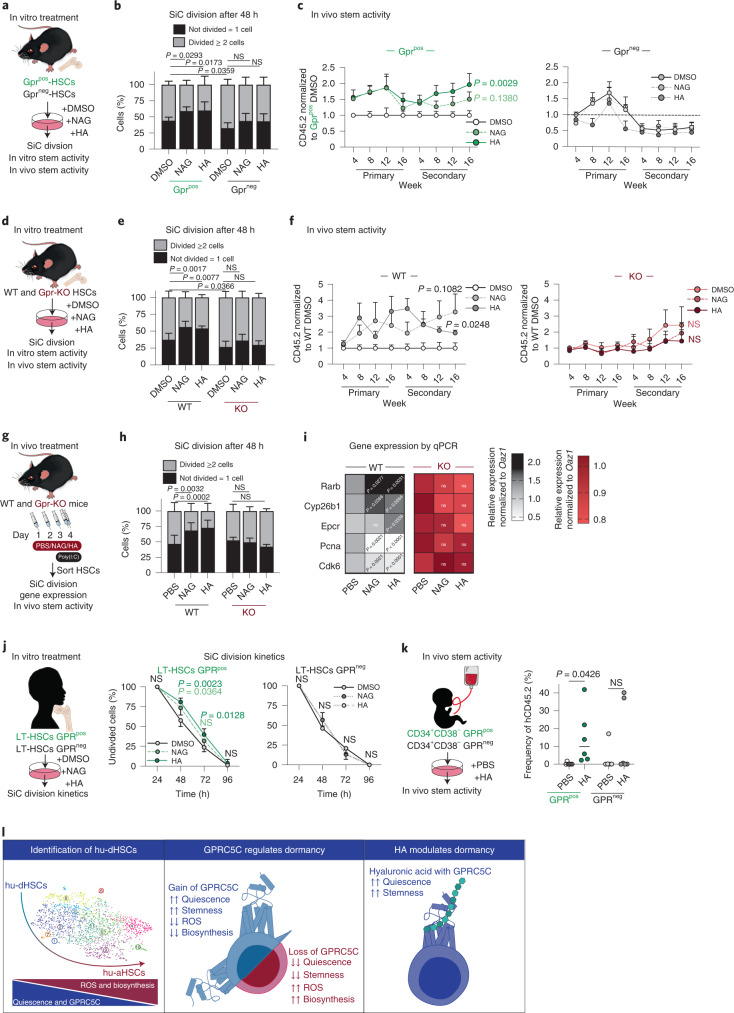
Fig. 6 HA–Gprc5c signalling axis regulates human and mouse HSCs. a, Experimental design to assess the effect of in vitro HA and NAG treatment on Gprc5cpos/neg–HSCs. b, SiC division assay of Gprc5cpos/neg–HSCs quantified after 48 h in vitro culture treatment with NAG, HA and DMSO control. n = 8 biological replicates. c, Transplantation of Gprc5cpos/neg–HSCs treated with NAG, HA and DMSO control. n = 7 biological replicates, except n = 5 biological replicates for Gprc5cpos-HSCs treated with NAG. d, Experimental design to assess the effect of in vitro HA and NAG treatment on Gprc5c-KO and WT control HSCs. e, SiC division assay of Gprc5c-KO and WT control HSCs quantified after 48 h in vitro culture treatment with NAG, HA and DMSO control. n = 6 biological replicates. f, Transplantation of Gprc5c-KO and WT control HSCs treated with NAG, HA and DMSO control. n = 9, 9, 6, 11, 12 and 17 biological replicates for WT-DMSO, WT-NAG, WT-HA, Gpr-KO-DMSO, Gpr-KO-NAG and Gpr-KO-HA, respectively. g, Experimental design to assess the effect of in vivo NAG and HA treatment in preventing viral stress from poly I:C. HSCs defined as Lineage−cKit+Epcr+CD150+CD48−CD34−. h, SiC division assay of in vivo treated Gprc5c-KO and WT control HSCs cells quantified after 48 h of in vitro culture. n = 6 biological replicates. i, Differential gene expression. Heat map representing median RNA expression from qPCR data (normalized to housekeeping gene Oaz1 and PBS control) n = 11 biological replicates. j, SiC division kinetics of BM GPRC5Cpos/neg–LT-HSCs with in vitro culture treatment with NAG, HA and DMSO control. n = 4 biological replicates. k, Transplantation of GPRC5Cpos/neg-HSCs from two CB donors treated with HA and control. n = 6 biological replicates. l, Representative summary of findings. All data presented as mean ± s.d., except i where median is presented. Statistical significance was determined using two-tailed t-test (c, f, i and k) or two-way ANOVA (b, e, h and j). n indicates number of biological replicates. For all experiments, at least two independent experiments were performed. Source numerical data are available in source data. Source data
Fig. 6 HA–Gprc5c signalling axis regulates human and mouse HSCs. a, Experimental design to assess the effect of in vitro HA and NAG treatment on Gprc5cpos/neg–HSCs. b, SiC division assay of Gprc5cpos/neg–HSCs quantified after 48 h in vitro culture treatment with NAG, HA and DMSO control. n = 8 biological replicates. c, Transplantation of Gprc5cpos/neg–HSCs treated with NAG, HA and DMSO control. n = 7 biological replicates, except n = 5 biological replicates for Gprc5cpos-HSCs treated with NAG. d, Experimental design to assess the effect of in vitro HA and NAG treatment on Gprc5c-KO and WT control HSCs. e, SiC division assay of Gprc5c-KO and WT control HSCs quantified after 48 h in vitro culture treatment with NAG, HA and DMSO control. n = 6 biological replicates. f, Transplantation of Gprc5c-KO and WT control HSCs treated with NAG, HA and DMSO control. n = 9, 9, 6, 11, 12 and 17 biological replicates for WT-DMSO, WT-NAG, WT-HA, Gpr-KO-DMSO, Gpr-KO-NAG and Gpr-KO-HA, respectively. g, Experimental design to assess the effect of in vivo NAG and HA treatment in preventing viral stress from poly I:C. HSCs defined as Lineage−cKit+Epcr+CD150+CD48−CD34−. h, SiC division assay of in vivo treated Gprc5c-KO and WT control HSCs cells quantified after 48 h of in vitro culture. n = 6 biological replicates. i, Differential gene expression. Heat map representing median RNA expression from qPCR data (normalized to housekeeping gene Oaz1 and PBS control) n = 11 biological replicates. j, SiC division kinetics of BM GPRC5Cpos/neg–LT-HSCs with in vitro culture treatment with NAG, HA and DMSO control. n = 4 biological replicates. k, Transplantation of GPRC5Cpos/neg-HSCs from two CB donors treated with HA and control. n = 6 biological replicates. l, Representative summary of findings. All data presented as mean ± s.d., except i where median is presented. Statistical significance was determined using two-tailed t-test (c, f, i and k) or two-way ANOVA (b, e, h and j). n indicates number of biological replicates. For all experiments, at least two independent experiments were performed. Source numerical data are available in source data. Source dataCC BY · PubMed Central
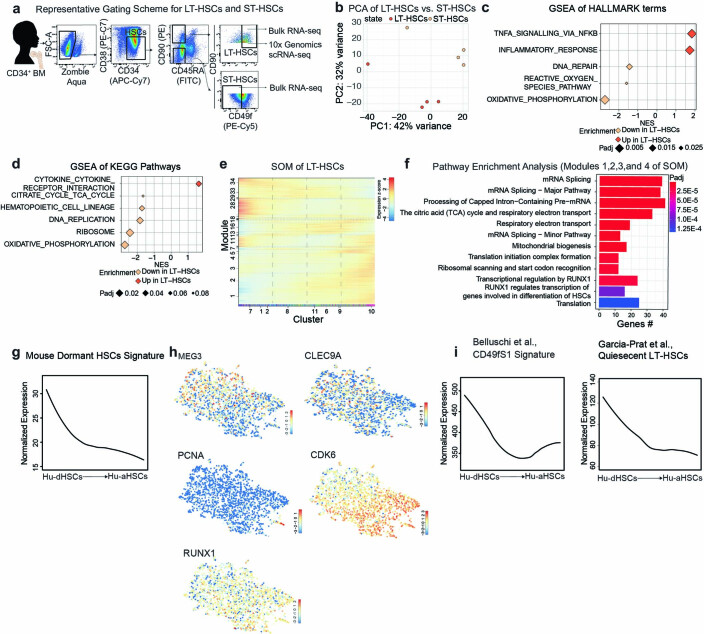
Extended Data Fig. 1 a. Representative FACS gating for HSCs (CD34+CD38−), ST-HSCs (CD34+CD38−CD90−CD45RA−CD49f−), and LT-HSCs (CD34+CD38−CD45RA−CD90+CD49f+) from CD34+ BM donors used for bulk RNA-seq and scRNA-seq. b. Principal component analysis (PCA) of RNA-seq data from LT-HSCs and ST-HSCs. Based on top 5,000 variable genes after variance-stabilization of DESeq2 Wald test. c. GSEA of Hallmark terms in LT-HSCs compared to ST-HSCs. d. GSEA of KEGG Pathways in LT-HSCs compared to ST-HSCs. e. SOM of LT-HSCs from scRNA-seq. f. Pathway enrichment analysis from modules 1, 2, 3, and 4 of SOM of LT-HSCs. Hypergeometric test. g. Smoothed pseudo-temporal normalized expression profile of Mouse dormant HSCs signature in LT-HSCs. Smoothed profiles were computed by local regression. h. LT-HSC expression UMAPs of the stem and activation associated genes. The colour bars indicate log2-normalized expression. i. Smoothed pseudo-temporal normalized expression profile of the Cd49f1 signature from Bellushi et al., and Quiescent LT-HSCs from García-Prat et al., smoothed profiles were computed by local regression. Colour bars at the bottom of the SOMs show VarID clusters or RaceID clusters. The y-axis of the smoothed pseudo-temporal expression profiles indicates normalized expression. GSEA was performed with BH-adjusted p-values after adaptive multilevel splitting Monte Carlo approach.
Extended Data Fig. 1 a. Representative FACS gating for HSCs (CD34+CD38−), ST-HSCs (CD34+CD38−CD90−CD45RA−CD49f−), and LT-HSCs (CD34+CD38−CD45RA−CD90+CD49f+) from CD34+ BM donors used for bulk RNA-seq and scRNA-seq. b. Principal component analysis (PCA) of RNA-seq data from LT-HSCs and ST-HSCs. Based on top 5,000 variable genes after variance-stabilization of DESeq2 Wald test. c. GSEA of Hallmark terms in LT-HSCs compared to ST-HSCs. d. GSEA of KEGG Pathways in LT-HSCs compared to ST-HSCs. e. SOM of LT-HSCs from scRNA-seq. f. Pathway enrichment analysis from modules 1, 2, 3, and 4 of SOM of LT-HSCs. Hypergeometric test. g. Smoothed pseudo-temporal normalized expression profile of Mouse dormant HSCs signature in LT-HSCs. Smoothed profiles were computed by local regression. h. LT-HSC expression UMAPs of the stem and activation associated genes. The colour bars indicate log2-normalized expression. i. Smoothed pseudo-temporal normalized expression profile of the Cd49f1 signature from Bellushi et al., and Quiescent LT-HSCs from García-Prat et al., smoothed profiles were computed by local regression. Colour bars at the bottom of the SOMs show VarID clusters or RaceID clusters. The y-axis of the smoothed pseudo-temporal expression profiles indicates normalized expression. GSEA was performed with BH-adjusted p-values after adaptive multilevel splitting Monte Carlo approach.CC BY · PubMed Central
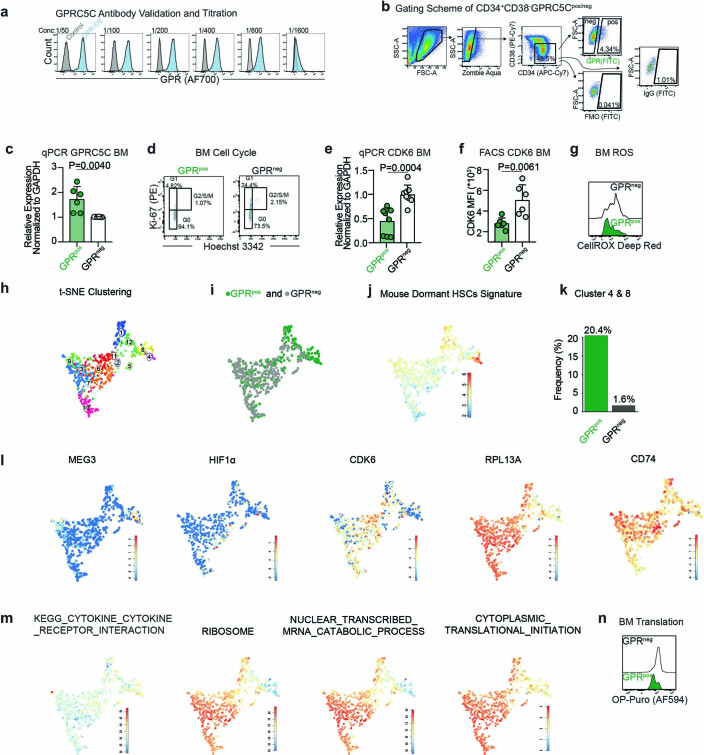
Extended Data Fig. 2 a. Titration of monoclonal human GPRC5C antibody. HEK293T transfected with overexpressing GPRC5C or control plasmid and stained with decreasing concentration (left to right) of the GPRC5C antibody. b. Representative FACS scheme for gating of GPRC5Cpos/neg-HSCs. GPRC5Cpos cells are identified using a fluorescence minus one (FMO) or IgG control. c. qPCR validation of GPRC5C RNA expression from BM GPRC5Cpos/neg-HSCs. Normalized to housekeeping gene GAPDH and GPRC5Cneg. n = 6 biological replicates. d. Representative FACS plots of cell cycle profiles from BM GPRC5Cpos/neg-HSCs. e. qPCR of CDK6 expression from GPRC5Cpos/neg-HSCs. Normalized to GAPDH gene and then GPRC5Cneg-HSCs. n = 8 biological replicates. f. FACS measurement of CDK6 MFI in BM GPRC5Cpos/neg-HSCs. n = 6 biological replicates. g. Representative FACS histogram of CellROX Deep Red MFI in BM GPRC5Cpos/neg-HSCs. h. t-SNE representation of the clusters from BM GPRC5Cpos/neg-HSCs. i. t-SNE depicting BM GPRC5Cpos/neg-HSCs. j. Projection of the t-SNE of the Mouse Dormant HSCs signature. The colour bars indicate log2-normalized expression. k. The enrichment of GPRC5Cpos-HSCs in clusters 4 and 8 is 20.4% compared to 1.6% for GPRC5Cneg-HSCs. l. t-SNE of stem- and activation-associated genes. The colour bars indicate log2-normalized expression. m. t-SNE of KEGG and GO pathways. The colour bars indicate log2-normalized expression. n. Representative FACS histogram of OP-Puro MFI in BM GPRC5Cpos/neg-HSCs. All data presented as mean ± SD. Statistical significance was determined using two-tailed t-test (c, e, f) and at least two independent experiments were performed. ns, not significant. n indicates number of replicates. Source numerical data are available in source data. Source data
Extended Data Fig. 2 a. Titration of monoclonal human GPRC5C antibody. HEK293T transfected with overexpressing GPRC5C or control plasmid and stained with decreasing concentration (left to right) of the GPRC5C antibody. b. Representative FACS scheme for gating of GPRC5Cpos/neg-HSCs. GPRC5Cpos cells are identified using a fluorescence minus one (FMO) or IgG control. c. qPCR validation of GPRC5C RNA expression from BM GPRC5Cpos/neg-HSCs. Normalized to housekeeping gene GAPDH and GPRC5Cneg. n = 6 biological replicates. d. Representative FACS plots of cell cycle profiles from BM GPRC5Cpos/neg-HSCs. e. qPCR of CDK6 expression from GPRC5Cpos/neg-HSCs. Normalized to GAPDH gene and then GPRC5Cneg-HSCs. n = 8 biological replicates. f. FACS measurement of CDK6 MFI in BM GPRC5Cpos/neg-HSCs. n = 6 biological replicates. g. Representative FACS histogram of CellROX Deep Red MFI in BM GPRC5Cpos/neg-HSCs. h. t-SNE representation of the clusters from BM GPRC5Cpos/neg-HSCs. i. t-SNE depicting BM GPRC5Cpos/neg-HSCs. j. Projection of the t-SNE of the Mouse Dormant HSCs signature. The colour bars indicate log2-normalized expression. k. The enrichment of GPRC5Cpos-HSCs in clusters 4 and 8 is 20.4% compared to 1.6% for GPRC5Cneg-HSCs. l. t-SNE of stem- and activation-associated genes. The colour bars indicate log2-normalized expression. m. t-SNE of KEGG and GO pathways. The colour bars indicate log2-normalized expression. n. Representative FACS histogram of OP-Puro MFI in BM GPRC5Cpos/neg-HSCs. All data presented as mean ± SD. Statistical significance was determined using two-tailed t-test (c, e, f) and at least two independent experiments were performed. ns, not significant. n indicates number of replicates. Source numerical data are available in source data. Source dataCC BY · PubMed Central
Extended Data Fig. 3 a. Representative FACS gating scheme of LT-HSCs within GPRC5Cpos/neg population from CD34+ BM donors. Frequency of LT-HSCs within GPRC5Cpos/neg cells from CD34+ BM donors. n = 7 biological replicates. b. Experimental design to assess the in vivo reconstitution ability of BM GPRC5Cpos/neg-HSCs. c. Lineage distribution of GPRC5Cpos/neg-HSCs. Data presented refer to the distribution of myeloid (CD33), B-lymphoid (CD19) and immature surface phenotype (CD34). n = 9 biological replicates. d. Percentage of determined colony types derived from single BM GPRC5Cpos/neg -LT-HSCs following culture under differentiating conditions for three weeks. n = 2 biological replicates. e. Experimental design to characterize GPRC5C in human CB. f. FACS analysis of cell cycle from CB GPRC5Cpos/neg-HSCs. n = 2 biological replicates. g. SiC division assay of GPRC5Cpos/neg-HSCs from CB donors quantified after 48 hours in vitro culture. n = 2 biological replicates. h. qPCR of CDK6 expression from CB GPRC5Cpos/neg-HSCs. Normalized to housekeeping gene GAPDH and GPRC5Cpos-HSCs. n = 9 biological replicates. i. Frequency of LT-HSCs within GPRC5Cpos/neg cells from CD34+ CB donors. n = 6 biological replicates. j. Assessment of reconstitution dynamics. Engraftment was assessed by percentage of human CD45 cells in the PB. n = 6 biological replicates. k. Lineage contribution of CB GPRC5Cpos/neg-HSCs. Data presented refer to the distribution of myeloid (CD33), B-lymphoid (CD19), and immature surface phenotype (CD34). n = 6 biological replicates. l. Table showing the number of cells injected per dose, number of mice per dose, and the number of engrafted mice per dose. These data were used to calculate the HSC frequency seen in Fig. 2i. All data presented as mean ± SD. Statistical significance was determined using two-tailed t-test (a, h, i, j) or two-way ANOVA (c and k) and at least two independent experiments were performed. ns, not significant. n indicates number of replicates. Source numerical data are available in source data. Source data
Extended Data Fig. 3 a. Representative FACS gating scheme of LT-HSCs within GPRC5Cpos/neg population from CD34+ BM donors. Frequency of LT-HSCs within GPRC5Cpos/neg cells from CD34+ BM donors. n = 7 biological replicates. b. Experimental design to assess the in vivo reconstitution ability of BM GPRC5Cpos/neg-HSCs. c. Lineage distribution of GPRC5Cpos/neg-HSCs. Data presented refer to the distribution of myeloid (CD33), B-lymphoid (CD19) and immature surface phenotype (CD34). n = 9 biological replicates. d. Percentage of determined colony types derived from single BM GPRC5Cpos/neg -LT-HSCs following culture under differentiating conditions for three weeks. n = 2 biological replicates. e. Experimental design to characterize GPRC5C in human CB. f. FACS analysis of cell cycle from CB GPRC5Cpos/neg-HSCs. n = 2 biological replicates. g. SiC division assay of GPRC5Cpos/neg-HSCs from CB donors quantified after 48 hours in vitro culture. n = 2 biological replicates. h. qPCR of CDK6 expression from CB GPRC5Cpos/neg-HSCs. Normalized to housekeeping gene GAPDH and GPRC5Cpos-HSCs. n = 9 biological replicates. i. Frequency of LT-HSCs within GPRC5Cpos/neg cells from CD34+ CB donors. n = 6 biological replicates. j. Assessment of reconstitution dynamics. Engraftment was assessed by percentage of human CD45 cells in the PB. n = 6 biological replicates. k. Lineage contribution of CB GPRC5Cpos/neg-HSCs. Data presented refer to the distribution of myeloid (CD33), B-lymphoid (CD19), and immature surface phenotype (CD34). n = 6 biological replicates. l. Table showing the number of cells injected per dose, number of mice per dose, and the number of engrafted mice per dose. These data were used to calculate the HSC frequency seen in Fig. 2i. All data presented as mean ± SD. Statistical significance was determined using two-tailed t-test (a, h, i, j) or two-way ANOVA (c and k) and at least two independent experiments were performed. ns, not significant. n indicates number of replicates. Source numerical data are available in source data. Source dataCC BY · PubMed Central
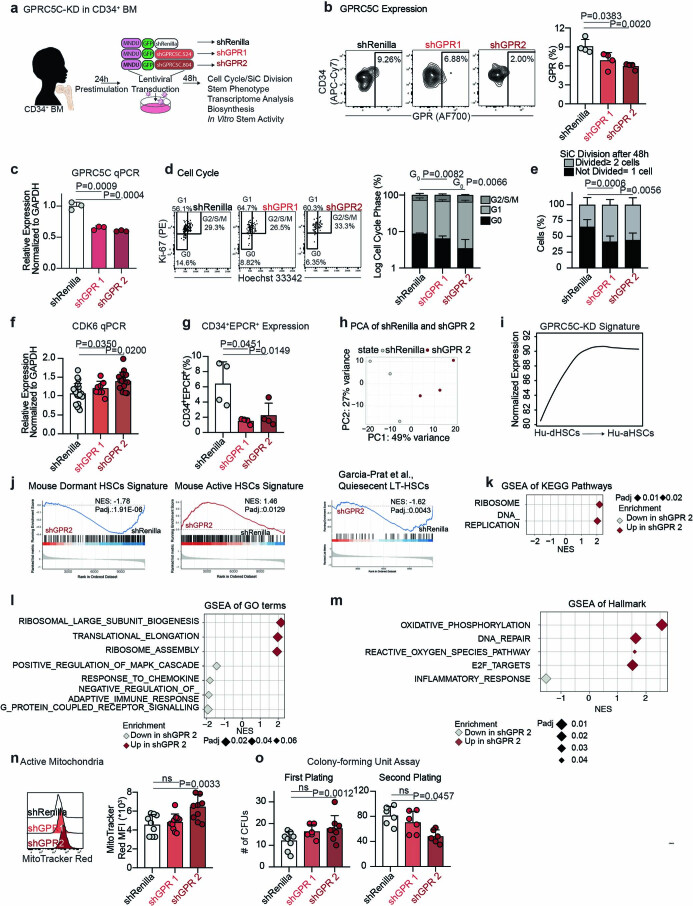
Extended Data Fig. 4 a. Experimental design to knockdown and assess the impact of decreased GPRC5C levels in CD34+ BM. b. FACS validation of GPRC5C protein levels quantified in GFP+ BM cells. n = 4 experiments. c. qPCR of GPRC5C expression in GFP+ BM cells. Normalized to housekeeping gene GAPDH and shRenilla. n = 3 experiments. d. Cell cycle FACS analysis on GFP+ BM cells. Cell cycle phase is represented on log10 scale. n = 4 experiments. e. SiC division assay of GFP+ BM cells quantified after 48 hours in vitro culture. n = 4 experiments. f. qPCR of CDK6 expression in GFP+ BM cells. Normalized to housekeeping gene GAPDH and shRenilla. n = 8 experiments. g. Surface expression of CD34+EPCR+ in GFP+ BM cells. n = 4 experiments. h. PCA of RNA-seq data from shGPR 2 and shRenilla control. Based on top 5,000 variable genes. log2FC threshold ≥ 0.5, padj. < 0.1. i. Smoothed pseudo-temporal expression profile of the GPR-KD signature in LT-HSCs. Smoothed profiles were computed by local regression. The y-axis of the smoothed pseudo-temporal expression profiles indicates normalized expression. j. GSEA of Mouse Dormant HSCs, Mouse Active HSCs, and Quiescent LT-HSCs from García-Prat et al., signature in shGPR 2 and shRenilla control. k. GSEA of KEGG pathways in shGPR 2 compared to shRenilla control. l. GSEA of GO terms in shGPR 2 compared to shRenilla control. m. GSEA of Hallmarks terms in shGPR 2 compared to shRenilla control. n. FACS measurement of MitoTracker Red MFI in GFP+ BM. n = 10 experiments. o. CFU assay of GFP+ cells from GPRC5C-KD and shRenilla control. Primary plating n = 8 experiments, except n = 6 experiments for shGPR1. Secondary plating n = 6 experiments. All data presented as mean ± SD. Statistical significance was determined using two-tailed t-test, except d and e (two-way ANOVA). GSEA performed with BH-adjusted p-values after adaptive multilevel splitting Monte Carlo approach. ns, not significant. n indicates the number of biological replicates. For all experiments, at least two independent experiments were performed. At least two human BM donors were used. Source numerical data are available in source data. Source data
Extended Data Fig. 4 a. Experimental design to knockdown and assess the impact of decreased GPRC5C levels in CD34+ BM. b. FACS validation of GPRC5C protein levels quantified in GFP+ BM cells. n = 4 experiments. c. qPCR of GPRC5C expression in GFP+ BM cells. Normalized to housekeeping gene GAPDH and shRenilla. n = 3 experiments. d. Cell cycle FACS analysis on GFP+ BM cells. Cell cycle phase is represented on log10 scale. n = 4 experiments. e. SiC division assay of GFP+ BM cells quantified after 48 hours in vitro culture. n = 4 experiments. f. qPCR of CDK6 expression in GFP+ BM cells. Normalized to housekeeping gene GAPDH and shRenilla. n = 8 experiments. g. Surface expression of CD34+EPCR+ in GFP+ BM cells. n = 4 experiments. h. PCA of RNA-seq data from shGPR 2 and shRenilla control. Based on top 5,000 variable genes. log2FC threshold ≥ 0.5, padj. < 0.1. i. Smoothed pseudo-temporal expression profile of the GPR-KD signature in LT-HSCs. Smoothed profiles were computed by local regression. The y-axis of the smoothed pseudo-temporal expression profiles indicates normalized expression. j. GSEA of Mouse Dormant HSCs, Mouse Active HSCs, and Quiescent LT-HSCs from García-Prat et al., signature in shGPR 2 and shRenilla control. k. GSEA of KEGG pathways in shGPR 2 compared to shRenilla control. l. GSEA of GO terms in shGPR 2 compared to shRenilla control. m. GSEA of Hallmarks terms in shGPR 2 compared to shRenilla control. n. FACS measurement of MitoTracker Red MFI in GFP+ BM. n = 10 experiments. o. CFU assay of GFP+ cells from GPRC5C-KD and shRenilla control. Primary plating n = 8 experiments, except n = 6 experiments for shGPR1. Secondary plating n = 6 experiments. All data presented as mean ± SD. Statistical significance was determined using two-tailed t-test, except d and e (two-way ANOVA). GSEA performed with BH-adjusted p-values after adaptive multilevel splitting Monte Carlo approach. ns, not significant. n indicates the number of biological replicates. For all experiments, at least two independent experiments were performed. At least two human BM donors were used. Source numerical data are available in source data. Source dataCC BY · PubMed Central
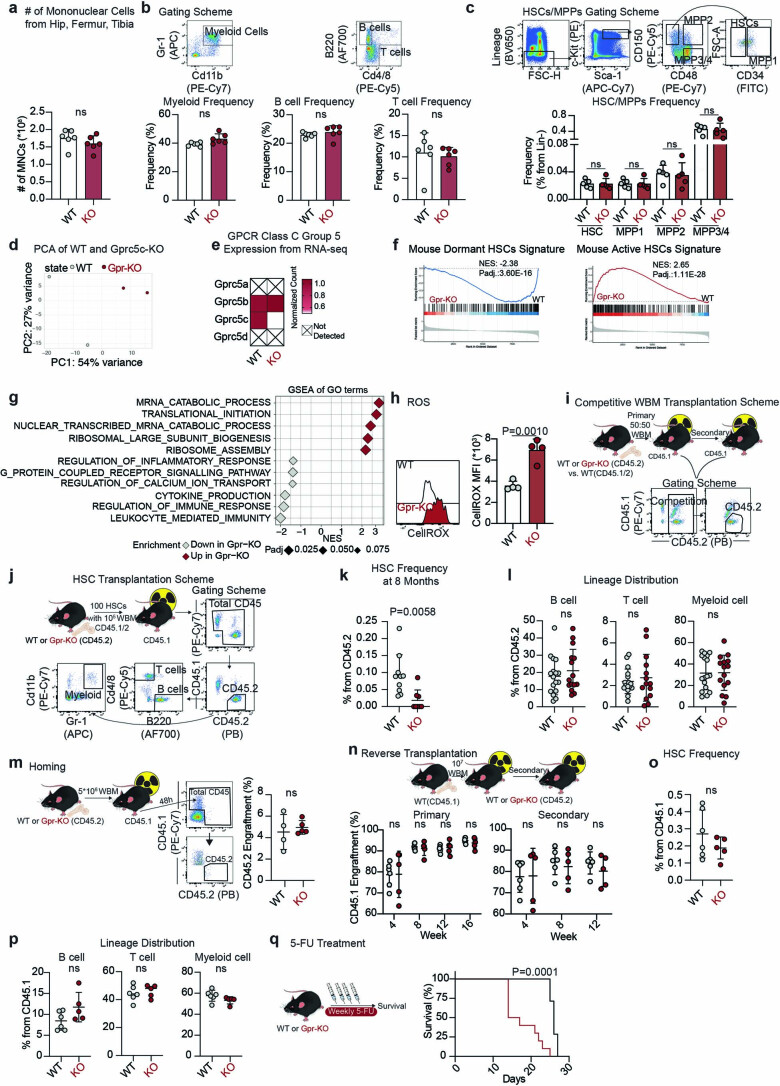
Extended Data Fig. 5 a. Absolute number of mononuclear cells (MNC) isolated from hip, femur, and tibia. n = 6 biological replicates. b. FACS gating scheme for myeloid, B cells and T cells. Frequency of described populations from Gprc5c-KO and WT control BM. n = 6 biological replicates. c. Upper panel: FACS gating scheme for HSCs (LSK-CD150+CD48+CD34−), MPP1 (LSK-CD150+CD48+CD34+), MPP2 (LSK-CD150+CD48+), and MPP3/4 (LSK-CD150−CD48+). Lower panel: frequency of described populations from Gprc5c-KO and WT control BM. n = 5 biological replicates. d. PCA of RNA-seq data from Gprc5c-KO and WT control HSCs. Based on top 5,000 variable genes. log2FC threshold ≥ 0.5, padj.<0.1. e. Differential gene expression. Heatmap representing mean of normalized counts (normalized to WT). n = 2 biological replicates. f. GSEA of gene signatures in Gprc5c-KO and WT control HSCs. g. GSEA of GO terms in Gprc5c-KO compared to WT control HSCs. h. FACS measurement of CellROX Deep Red MFI in Gprc5c-KO compared to WT control HSCs. n = 4 biological replicates. i. Experimental design for competitive WBM transplantation. 50:50 ratio transplant of CD45.1/2 WT: CD45.2 WT or Gprc5c-KO WBM into CD45.1 recipient mice. Representative FACS gating scheme to quantify engraftment. j. Experimental design for HSC transplantation and FACS gating scheme to quantify engraftment and lineage distribution. k. Endpoint frequency of BM HSCs in CD45.2 cells of Gprc5c-KO (n = 8 biological replicates) and WT control (n = 10 biological replicates). l. Lineage distribution of BM Gprc5c-KO (n = 14 biological replicates) and WT control (n = 16 biological replicates) from HSC transplantations. m. Left panel: experimental design and FACS gating scheme of homing assay. Right panel: frequency of CD45.2 cells engraftment 48 hours post transplantation. n = 4 biological replicates. n. Upper panel: experimental design for reverse chimeras. Lower panel: PB analysis of reverse chimeras. Engraftment is represented by CD45.1 cell percentage engraftment. n = 5 biological replicates for Gpr-KO and n = 6 biological replicates for WT mice. o. Endpoint frequency of BM HSCs from CD45.1 cells transplanted in Gprc5c-KO (n = 5 biological replicates) and WT control (n = 6 biological replicates) mice. p. Lineage distribution of BM CD45.1 cells transplanted in Gprc5c- KO (n = 5 biological replicates) and WT control (n = 6 biological replicates) mice. q. Survival curve of Gprc5c-KO (n = 10 biological replicates) and WT control (n = 7 biological replicates) mice treated with 5-FU. All data presented as mean ± SD. Statistical significance was determined using two-tailed t-test, except panel q: Mantel-Cox test. GSEA performed with BH-adjusted p-values after adaptive multilevel splitting Monte Carlo approach. ns, not significant. n indicates the number of biological replicates. Source numerical data are available in source data. Source data
Extended Data Fig. 5 a. Absolute number of mononuclear cells (MNC) isolated from hip, femur, and tibia. n = 6 biological replicates. b. FACS gating scheme for myeloid, B cells and T cells. Frequency of described populations from Gprc5c-KO and WT control BM. n = 6 biological replicates. c. Upper panel: FACS gating scheme for HSCs (LSK-CD150+CD48+CD34−), MPP1 (LSK-CD150+CD48+CD34+), MPP2 (LSK-CD150+CD48+), and MPP3/4 (LSK-CD150−CD48+). Lower panel: frequency of described populations from Gprc5c-KO and WT control BM. n = 5 biological replicates. d. PCA of RNA-seq data from Gprc5c-KO and WT control HSCs. Based on top 5,000 variable genes. log2FC threshold ≥ 0.5, padj.<0.1. e. Differential gene expression. Heatmap representing mean of normalized counts (normalized to WT). n = 2 biological replicates. f. GSEA of gene signatures in Gprc5c-KO and WT control HSCs. g. GSEA of GO terms in Gprc5c-KO compared to WT control HSCs. h. FACS measurement of CellROX Deep Red MFI in Gprc5c-KO compared to WT control HSCs. n = 4 biological replicates. i. Experimental design for competitive WBM transplantation. 50:50 ratio transplant of CD45.1/2 WT: CD45.2 WT or Gprc5c-KO WBM into CD45.1 recipient mice. Representative FACS gating scheme to quantify engraftment. j. Experimental design for HSC transplantation and FACS gating scheme to quantify engraftment and lineage distribution. k. Endpoint frequency of BM HSCs in CD45.2 cells of Gprc5c-KO (n = 8 biological replicates) and WT control (n = 10 biological replicates). l. Lineage distribution of BM Gprc5c-KO (n = 14 biological replicates) and WT control (n = 16 biological replicates) from HSC transplantations. m. Left panel: experimental design and FACS gating scheme of homing assay. Right panel: frequency of CD45.2 cells engraftment 48 hours post transplantation. n = 4 biological replicates. n. Upper panel: experimental design for reverse chimeras. Lower panel: PB analysis of reverse chimeras. Engraftment is represented by CD45.1 cell percentage engraftment. n = 5 biological replicates for Gpr-KO and n = 6 biological replicates for WT mice. o. Endpoint frequency of BM HSCs from CD45.1 cells transplanted in Gprc5c-KO (n = 5 biological replicates) and WT control (n = 6 biological replicates) mice. p. Lineage distribution of BM CD45.1 cells transplanted in Gprc5c- KO (n = 5 biological replicates) and WT control (n = 6 biological replicates) mice. q. Survival curve of Gprc5c-KO (n = 10 biological replicates) and WT control (n = 7 biological replicates) mice treated with 5-FU. All data presented as mean ± SD. Statistical significance was determined using two-tailed t-test, except panel q: Mantel-Cox test. GSEA performed with BH-adjusted p-values after adaptive multilevel splitting Monte Carlo approach. ns, not significant. n indicates the number of biological replicates. Source numerical data are available in source data. Source dataCC BY · PubMed Central
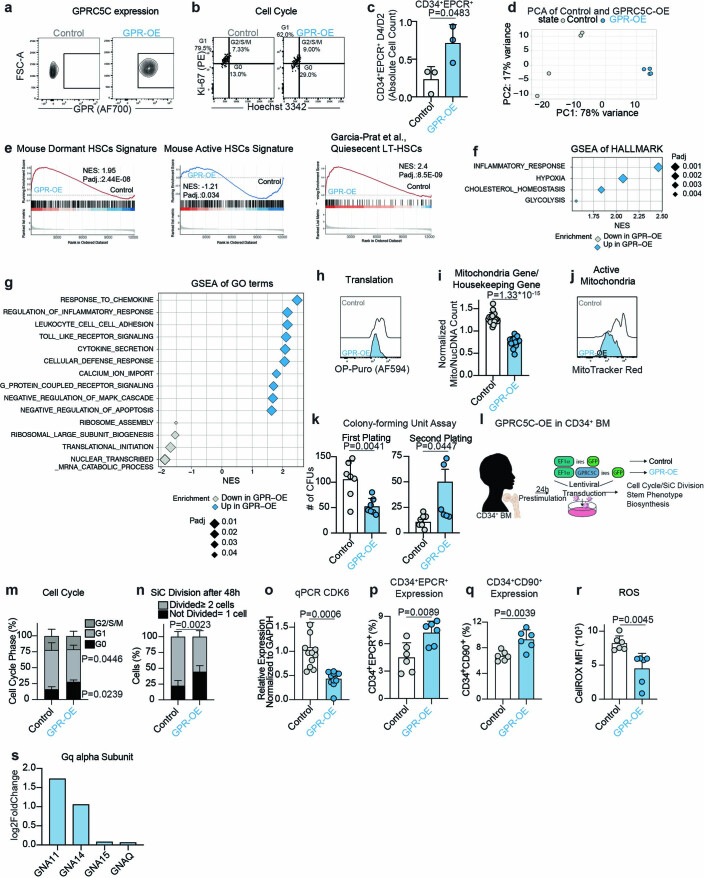
Extended Data Fig. 6 a. Representative FACS plot for validation of GPRC5C-OE in GFP+ mPB cells. b. Representative FACS plot of cell cycle profiles from GFP+ mPB cells. c. Ratio of the absolute number of CD34+EPCR+ cells from day 4 compared to day 2 in vitro. n = 3 experiments. d. PCA of RNA-seq data from GPRC5C-OE and control. Based on top 5,000 variable genes. log2FC threshold ≥ 0.5, padj. < 0.1. e. GSEA of quiescent signatures in GPRC5C-OE compared to control. f. GSEA of Hallmarks terms in GPRC5C-OE compared to control. g. GSEA of GO terms in GPRC5C-OE compared to control. h. FACS histogram of OP-Puro MFI in GPRC5C-OE and control. i. RNA-seq data showing ratio read count of mitochondria genes normalized to housekeeping genes (GAPDH, ACTB, PPIA). n = 19 genes averaged from 4 technical replicates. j. FACS histogram of MitoTracker Red MFI in GPRC5C-OE and control. k. CFU assay of GFP+ cells from GPRC5C-OE and control. n = 7 experiments, except for secondary plating GPR-OE, where n = 6 experiments. l. Experimental design to overexpress and assess the impact of the gain of GPRC5C expression in BM CD34 + . m. FACS-based cell cycle analysis of GPRC5C-OE and control. n = 6 experiments. n. SiC division assay of GPRC5C-OE and control quantified after 48 hours in vitro culture. n = 6 experiments. o. qPCR of CDK6 expression. Normalized to housekeeping gene GAPDH and control. n = 12 experiments for WT and n = 11 experiments for GPR-OE. p. Surface expression of CD34+EPCR+ in GPRC5C-OE and control. n = 6 experiments. q. Surface expression of CD34+CD90+ in GPRC5C-OE and control. n = 4 experiments. r. FACS measurement of CellROX Deep Red MFI in GPRC5C-OE and control. n = 6 experiments. s. Log2FC of proteins of Gq alpha subunit. All data presented as mean ± SD. Statistical significance was determined using two-tailed t-test, except m and n (two-way ANOVA). GSEA performed with BH-adjusted p-values after adaptive multilevel splitting Monte Carlo approach. ns, not significant. n indicates the number of biological replicates. For all experiments, at least two independent experiments were performed. At least two human BM donors were used. Source numerical data are available in source data. Source data
Extended Data Fig. 6 a. Representative FACS plot for validation of GPRC5C-OE in GFP+ mPB cells. b. Representative FACS plot of cell cycle profiles from GFP+ mPB cells. c. Ratio of the absolute number of CD34+EPCR+ cells from day 4 compared to day 2 in vitro. n = 3 experiments. d. PCA of RNA-seq data from GPRC5C-OE and control. Based on top 5,000 variable genes. log2FC threshold ≥ 0.5, padj. < 0.1. e. GSEA of quiescent signatures in GPRC5C-OE compared to control. f. GSEA of Hallmarks terms in GPRC5C-OE compared to control. g. GSEA of GO terms in GPRC5C-OE compared to control. h. FACS histogram of OP-Puro MFI in GPRC5C-OE and control. i. RNA-seq data showing ratio read count of mitochondria genes normalized to housekeeping genes (GAPDH, ACTB, PPIA). n = 19 genes averaged from 4 technical replicates. j. FACS histogram of MitoTracker Red MFI in GPRC5C-OE and control. k. CFU assay of GFP+ cells from GPRC5C-OE and control. n = 7 experiments, except for secondary plating GPR-OE, where n = 6 experiments. l. Experimental design to overexpress and assess the impact of the gain of GPRC5C expression in BM CD34 + . m. FACS-based cell cycle analysis of GPRC5C-OE and control. n = 6 experiments. n. SiC division assay of GPRC5C-OE and control quantified after 48 hours in vitro culture. n = 6 experiments. o. qPCR of CDK6 expression. Normalized to housekeeping gene GAPDH and control. n = 12 experiments for WT and n = 11 experiments for GPR-OE. p. Surface expression of CD34+EPCR+ in GPRC5C-OE and control. n = 6 experiments. q. Surface expression of CD34+CD90+ in GPRC5C-OE and control. n = 4 experiments. r. FACS measurement of CellROX Deep Red MFI in GPRC5C-OE and control. n = 6 experiments. s. Log2FC of proteins of Gq alpha subunit. All data presented as mean ± SD. Statistical significance was determined using two-tailed t-test, except m and n (two-way ANOVA). GSEA performed with BH-adjusted p-values after adaptive multilevel splitting Monte Carlo approach. ns, not significant. n indicates the number of biological replicates. For all experiments, at least two independent experiments were performed. At least two human BM donors were used. Source numerical data are available in source data. Source dataCC BY · PubMed Central
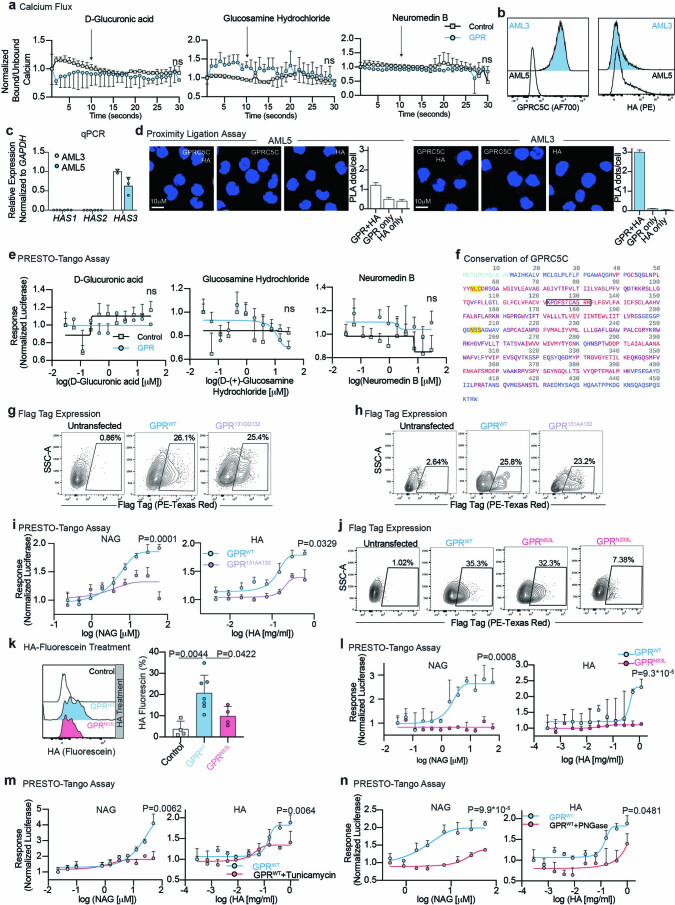
Extended Data Fig. 7 a. Normalized ratio of baseline calcium level measured by Indo-1 followed by calcium flux in response to D-glucuronic acid (GA), glucosamine hydrochloride (G), and neuromedin B (NMB) in GPRC5C-OE (n = 3 experiments) and control (n = 4 experiments) in AML3 cells. b. HA and GPRC5C expression in AML3 and AML5. c. HAS1,2, and 3 expression in AML3 and AML5. n = 3 experiments, except for HAS3 expression in AML3 n = 2 experiments. d. Technical PLA controls of GPRC5C and HA in AML3 and AML5. Plot is representative of one out of three independent experiments. Each independent experiment was performed in two technical replicates. n = 543, 551, 463, 990, 503, and 523 cells for AML3: GPR + HA, GPR only, HA only and AML5: GPR + HA, GPR only, and HA only, respectively. Data presented as mean ± SEM. e. Concentration–response curve of PRESTO-Tango construct of GPRC5C and control vector treated with GA, G, and NMB in HTLA cells. Normalized to luciferase response at the lowest concentration. n = 4 experiments. f. Residue conservation of GPRC5C based on a multiple sequence alignment of 250 homologous proteins extracted from UniRef90. Red: highly conserved; purple: conserved; blue: not conserved; light blue: no conservation information available; yellow background: sequon for N-glycosylation used for mutation analysis within the ECD of the protein; black box: the putative BX7B domain. g. FACS validation of surface protein levels of GPRC5CWT and site-specific mutant (GPRC5C131QQ132) in HTLA cells. h. FACS validation of surface protein levels of GPRC5CWT and site-specific mutant (GPRC5C131AA132) in HTLA cells. i. Concentration-response curve of PRESTO-Tango construct for GPRC5CWT and site-specific mutant (GPRC5C131AA132) at predicted HA interaction site in HTLA cells. n = 6 experiments. j. FACS validation of surface protein levels of GPRC5CWT and site-specific mutants (GPRC5CN53L and GPRC5CN203L) in HTLA cells. k. HA-fluorescein-treated cells quantified for GFP retention in HEK293T cells expressing GPRC5CWT and GPRC5CN53L. FACS plots representing HA retention in each condition. n = 4 experiments, except for GPRC5CWT where n = 7 experiments. l. Concentration-response curve of PRESTO-Tango construct for GPRC5CWT and site-specific mutant (GPRC5CN53L) at predicted HA interaction site in HTLA cells. n = 6 experiments. m. Concentration-response curve of PRESTO-Tango construct for GPRC5CWT treated with tunicamycin in HTLA cells. n = 3 experiments. n. Concentration-response curve of PRESTO-Tango construct for GPRC5CWT treated with PNGase in HTLA cells. n = 3 experiments. All data presented as mean ± SD, except where otherwise stated. Statistical significance was determined using two-tailed t-test. ns, not significant. n indicates the number of replicates. For all experiments, at least two independent experiments were performed. Source numerical data are available in source data. Source data
Extended Data Fig. 7 a. Normalized ratio of baseline calcium level measured by Indo-1 followed by calcium flux in response to D-glucuronic acid (GA), glucosamine hydrochloride (G), and neuromedin B (NMB) in GPRC5C-OE (n = 3 experiments) and control (n = 4 experiments) in AML3 cells. b. HA and GPRC5C expression in AML3 and AML5. c. HAS1,2, and 3 expression in AML3 and AML5. n = 3 experiments, except for HAS3 expression in AML3 n = 2 experiments. d. Technical PLA controls of GPRC5C and HA in AML3 and AML5. Plot is representative of one out of three independent experiments. Each independent experiment was performed in two technical replicates. n = 543, 551, 463, 990, 503, and 523 cells for AML3: GPR + HA, GPR only, HA only and AML5: GPR + HA, GPR only, and HA only, respectively. Data presented as mean ± SEM. e. Concentration–response curve of PRESTO-Tango construct of GPRC5C and control vector treated with GA, G, and NMB in HTLA cells. Normalized to luciferase response at the lowest concentration. n = 4 experiments. f. Residue conservation of GPRC5C based on a multiple sequence alignment of 250 homologous proteins extracted from UniRef90. Red: highly conserved; purple: conserved; blue: not conserved; light blue: no conservation information available; yellow background: sequon for N-glycosylation used for mutation analysis within the ECD of the protein; black box: the putative BX7B domain. g. FACS validation of surface protein levels of GPRC5CWT and site-specific mutant (GPRC5C131QQ132) in HTLA cells. h. FACS validation of surface protein levels of GPRC5CWT and site-specific mutant (GPRC5C131AA132) in HTLA cells. i. Concentration-response curve of PRESTO-Tango construct for GPRC5CWT and site-specific mutant (GPRC5C131AA132) at predicted HA interaction site in HTLA cells. n = 6 experiments. j. FACS validation of surface protein levels of GPRC5CWT and site-specific mutants (GPRC5CN53L and GPRC5CN203L) in HTLA cells. k. HA-fluorescein-treated cells quantified for GFP retention in HEK293T cells expressing GPRC5CWT and GPRC5CN53L. FACS plots representing HA retention in each condition. n = 4 experiments, except for GPRC5CWT where n = 7 experiments. l. Concentration-response curve of PRESTO-Tango construct for GPRC5CWT and site-specific mutant (GPRC5CN53L) at predicted HA interaction site in HTLA cells. n = 6 experiments. m. Concentration-response curve of PRESTO-Tango construct for GPRC5CWT treated with tunicamycin in HTLA cells. n = 3 experiments. n. Concentration-response curve of PRESTO-Tango construct for GPRC5CWT treated with PNGase in HTLA cells. n = 3 experiments. All data presented as mean ± SD, except where otherwise stated. Statistical significance was determined using two-tailed t-test. ns, not significant. n indicates the number of replicates. For all experiments, at least two independent experiments were performed. Source numerical data are available in source data. Source dataCC BY · PubMed Central
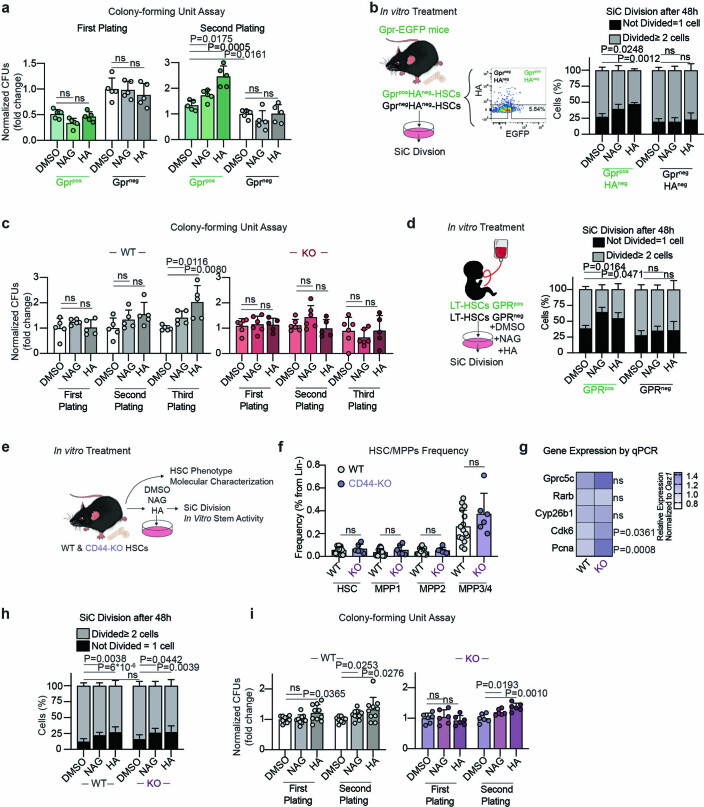
Extended Data Fig. 8 a. Serial CFU assay of Gprc5cpos/neg–HSCs cultured in NAG, HA, or DMSO control for 72 hours. n = 6 biological replicates. b. Left panel: experimental design to assess the effect of in vitro HA, NAG, and DMSO treatment on HAnegGprc5cpos/neg–HSCs. Right Panel: SiC division assay of HAnegGprc5cpos/neg–HSCs quantified after 48 hours in vitro culture treatment with NAG, HA, and DMSO. n = 5 biological replicates. c. Serial CFU assay of Gprc5c-KO and WT control HSCs cultured in NAG, HA, and DMSO control for 72 hours. n = 5, 3, 5, 6, 6, and 5 biological replicates for WT-DMSO, WT-NAG, WT-HA, Gpr-KO-DMSO, Gpr-KO-NAG, and Gpr-KO-HA, respectively. d. SiC division assay of GPRC5Cpos/neg–LT-HSCs with in vitro culture treatment for 48 hours with NAG, HA, and DMSO control. n = 4 biological replicates. e. Experimental design to assess the effect of in vitro NAG, HA, and DMSO treatment on CD44-KO and WT control mice. f. Frequency of HSC/MPP populations from 8−week-old CD44-KO (n = 6 biological replicates) and WT control (n = 12 biological replicates) mice. g. Differential gene expression. Heatmap representing median RNA expression from qPCR data (normalized to housekeeping gene Oaz1 and WT control). n = 7 biological replicates. h. SiC division assay of CD44-KO and WT control HSCs quantified after 48 hours in vitro culture treatment with NAG, HA and DMSO. n = 15, 15, 13, 8, and 12 biological replicates for WT-DMSO, WT-NAG, WT-HA, CD44-KO-DMSO, CD44-KO-NAG, and CD44-KO-HA, respectively. i. Serial CFU assay of CD44-KO (n = 6 biological replicates) and WT control (n = 10 biological replicates) HSCs cultured in vitro with NAG, HA, and DMSO for 48 hours. All data presented by mean ± SD. Statistical significance was determined using two-tailed t-test (a, c, f, g, i) or two-way ANOVA (b,d, h). ns, not significant. n indicates number of biological replicates. For all experiments, at least two independent experiments were performed. Source numerical data are available in source data. Source data
Extended Data Fig. 8 a. Serial CFU assay of Gprc5cpos/neg–HSCs cultured in NAG, HA, or DMSO control for 72 hours. n = 6 biological replicates. b. Left panel: experimental design to assess the effect of in vitro HA, NAG, and DMSO treatment on HAnegGprc5cpos/neg–HSCs. Right Panel: SiC division assay of HAnegGprc5cpos/neg–HSCs quantified after 48 hours in vitro culture treatment with NAG, HA, and DMSO. n = 5 biological replicates. c. Serial CFU assay of Gprc5c-KO and WT control HSCs cultured in NAG, HA, and DMSO control for 72 hours. n = 5, 3, 5, 6, 6, and 5 biological replicates for WT-DMSO, WT-NAG, WT-HA, Gpr-KO-DMSO, Gpr-KO-NAG, and Gpr-KO-HA, respectively. d. SiC division assay of GPRC5Cpos/neg–LT-HSCs with in vitro culture treatment for 48 hours with NAG, HA, and DMSO control. n = 4 biological replicates. e. Experimental design to assess the effect of in vitro NAG, HA, and DMSO treatment on CD44-KO and WT control mice. f. Frequency of HSC/MPP populations from 8−week-old CD44-KO (n = 6 biological replicates) and WT control (n = 12 biological replicates) mice. g. Differential gene expression. Heatmap representing median RNA expression from qPCR data (normalized to housekeeping gene Oaz1 and WT control). n = 7 biological replicates. h. SiC division assay of CD44-KO and WT control HSCs quantified after 48 hours in vitro culture treatment with NAG, HA and DMSO. n = 15, 15, 13, 8, and 12 biological replicates for WT-DMSO, WT-NAG, WT-HA, CD44-KO-DMSO, CD44-KO-NAG, and CD44-KO-HA, respectively. i. Serial CFU assay of CD44-KO (n = 6 biological replicates) and WT control (n = 10 biological replicates) HSCs cultured in vitro with NAG, HA, and DMSO for 48 hours. All data presented by mean ± SD. Statistical significance was determined using two-tailed t-test (a, c, f, g, i) or two-way ANOVA (b,d, h). ns, not significant. n indicates number of biological replicates. For all experiments, at least two independent experiments were performed. Source numerical data are available in source data. Source dataCC BY · PubMed Central

Verification

Claims the paper makes

The claims and statistics of this paper haven’t been checked yet.

Run the check — free, no account needed. It reads the open-access text and checks the sources it cites.

A few free checks a day · papers already verified open instantly · results are public

Claims other papers make about this one

Each is checked against this paper’s own text: does it say what the citing paper says it does?

Self-check

Percentages, sums and reported differences re-computed from the paper’s own numbers.

The self-check needs the paper’s full text.

Citations

Cites

Show all 70 references

Research works printed but not linked: 1

  1. Milić, D. & Veprintsev, D. B. Large-scale production and protein engineering of G protein-coupled receptors for structural studies. Front Pharm. 6, 66 (2015).

Cited by

Metadata

Authors
Zhang, Y. W., Mess, J., Aizarani, N., Mishra, P., Johnson, C., Romero-Mulero, M. C., Rettkowski, J., Schönberger, K., Obier, N., Jäcklein, K., Woessner, N. M., Lalioti, M.-E., Velasco-Hernandez, T., Sikora, K., Wäsch, R., Lehnertz, B., Sauvageau, G., Manke, T., Menendez, P., Walter, S. G., Minguet, S., Laurenti, E., Günther, S., Grün, D., & Cabezas-Wallscheid, N.
Venue
Nature Cell Biology
Published
2022-06-20
Volume
24
Issue
7
Pages
1038-1048
ISSN
  • 1465-7392
  • 1476-4679
Cited by
72
References
70
Language
en
Licence
Funders
Max-Planck-Gesellschaft (NA)

About these checks

Registry, retraction, Cites and statistics results are computed, not judged, with one exception: a printed reference that no index lists is read once by a model before it counts as a citation error. Claims are extracted by a model and kept only when their quote appears verbatim in the text; each cited source is then checked, with a model’s help, for whether it says what the claim relies on. Those verdicts can be wrong — read the claim’s quote and the cited source before relying on one.

Statistics and arithmetic are recomputed, not judged.

Confidence bands are shown only for fields calibrated on our annotated test set. None is calibrated yet, so no band is shown.

What counts as a claim ›How we measure confidence ›How we check this ›

Are you an author, or do you see a problem with this page? Request a review

Data sources

Bibliographic data: Semantic Scholar, OpenAlex, Crossref.

Contains information from the Semantic Scholar Academic Graph Datasets, made available under the ODC Attribution License (ODC-BY 1.0).

Semantic Scholar’s data is described in: Kinney, R., et al. (2023). The Semantic Scholar Open Data Platform. arXiv:2301.10140.