Cited by 152

The DOI matches its Crossref record; 7 of the 7 references it cites were found in a registry or an index.

Climate effects on archaic human habitats and species successions

Timmermann, Axel, Yun, Kyung-Sook, Raia, Pasquale, Ruan, Jiaoyang, Mondanaro, Alessandro, Zeller, Elke, Zollikofer, Christoph, Ponce de León, Marcia, Lemmon, Danielle, Willeit, Matteo, Ganopolski, Andrey·2022·Nature

Abstract

It has long been believed that climate shifts during the last 2 million years had a pivotal role in the evolution of our genus Homo 1–3 . However, given the limited number of representative palaeo-climate datasets from regions of anthropological interest, it has remained challenging to quantify this linkage. Here, we use an unprecedented transient Pleistocene coupled general circulation model simulation in combination with an extensive compilation of fossil and archaeological records to study the spatiotemporal habitat suitability for five hominin species over the past 2 million years. We show that astronomically forced changes in temperature, rainfall and terrestrial net primary production had a major impact on the observed distributions of these species. During the Early Pleistocene, hominins settled primarily in environments with weak orbital-scale climate variability. This behaviour changed substantially after the mid-Pleistocene transition, when archaic humans became global wanderers who adapted to a wide range of spatial climatic gradients. Analysis of the simulated hominin habitat overlap from approximately 300–400 thousand years ago further suggests that antiphased climate disruptions in southern Africa and Eurasia contributed to the evolutionary transformation of Homo heidelbergensis populations into Homo sapiens and Neanderthals, respectively. Our robust numerical simulations of climate-induced habitat changes provide a framework to test hypotheses on our human origin.

Overview

The claims and statistics of this paper haven’t been checked yet.

Run the check — free, no account needed. It reads the open-access text and checks the sources it cites.

A few free checks a day · papers already verified open instantly · results are public

Integrity signals

Registry

Crossref · 10.1038/s41586-022-04600-9

Cites

7 of 7 references verified0 citation errors · 0 not checkable

Statistics

Figures

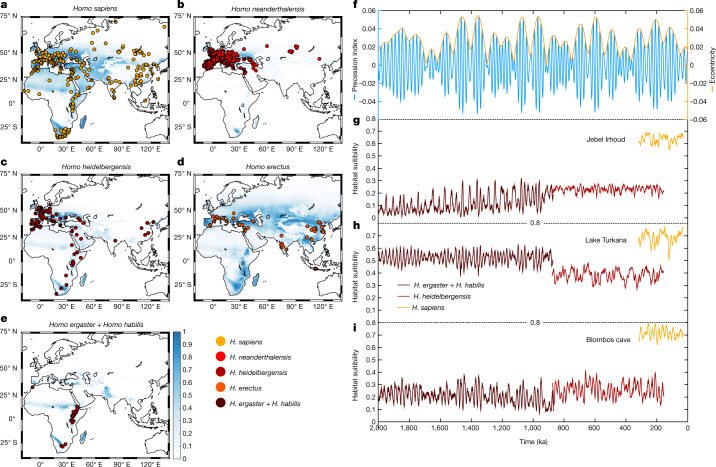
Fig. 1 Hominin species habitat suitability. a–e, African–Eurasian species distribution calculated from a Mahalanobis distance model using four-dimensional climate envelope data of topographically downscaled temperature, precipitation and NPP changes simulated by 2Ma (Methods) and the locations and ages of fossil and archaeological sites (Supplementary Table 1). The time-averaged habitat suitability (blue to white shading) covering the period of respective hominin presence can be interpreted in terms of probability (Methods), with values ranging from 0 (habitat unsuitable) to 1 (habitat extremely suitable). Coloured circles represent the locations of fossils and/or archaeological artefacts associated with the five hominin groups. f–i, Time series for precession (blue) and eccentricity (f) and simulated regional habitat suitability at selected sites of archaeological interest for H. habilis and H. ergaster (treated jointly as early African Homo), H. heidelbergensis and H. sapiens (g–i). The centre locations of a 4° × 4° average area include Jebel Irhoud (34° N, 4° W), a region near Lake Turkana (0° N, 34° E) and Blombos cave (34° S, 21° E).
Fig. 1 Hominin species habitat suitability. a–e, African–Eurasian species distribution calculated from a Mahalanobis distance model using four-dimensional climate envelope data of topographically downscaled temperature, precipitation and NPP changes simulated by 2Ma (Methods) and the locations and ages of fossil and archaeological sites (Supplementary Table 1). The time-averaged habitat suitability (blue to white shading) covering the period of respective hominin presence can be interpreted in terms of probability (Methods), with values ranging from 0 (habitat unsuitable) to 1 (habitat extremely suitable). Coloured circles represent the locations of fossils and/or archaeological artefacts associated with the five hominin groups. f–i, Time series for precession (blue) and eccentricity (f) and simulated regional habitat suitability at selected sites of archaeological interest for H. habilis and H. ergaster (treated jointly as early African Homo), H. heidelbergensis and H. sapiens (g–i). The centre locations of a 4° × 4° average area include Jebel Irhoud (34° N, 4° W), a region near Lake Turkana (0° N, 34° E) and Blombos cave (34° S, 21° E).CC BY · PubMed Central
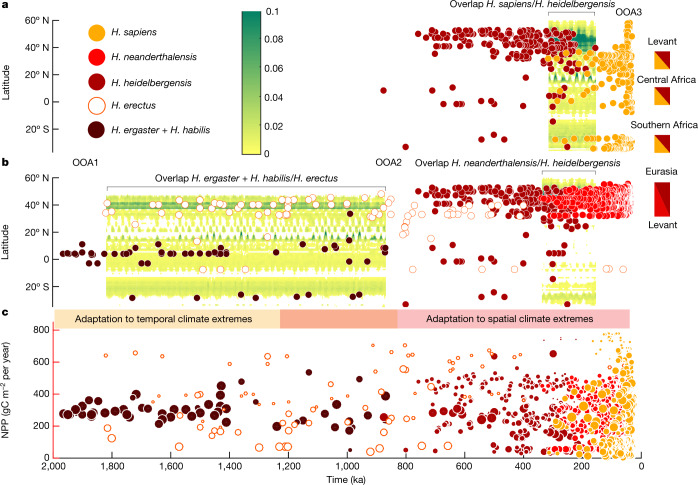
Fig. 2 Habitat overlap, succession and geographical distribution of fossils. a, Green shading represents a Hovmoeller (time–latitude) diagram of the zonal mean of the spatial scalar product of habitat suitability for H. sapiens and H. heidelbergensis. Circles represent the corresponding average age and latitudinal distributions of fossils and archaeological artefacts. High values of habitat overlap coinciding with joint presence of fossils indicate possible locations of hominin interaction, diversification and possibly speciation. b, Same as a but for H. neanderthalensis and H. heidelbergensis (right side) and H. erectus and H. ergaster–habilis. ‘Out-of-Africa’ migration periods are marked as OOA. Potential regions for gradual diversification and transformation are indicated by dual-coloured boxes. c, NPP (Methods) for each fossil and archaeological site (coloured circles), selected by averaging the 2Ma NPP data in a 6° × 6° vicinity around the fossil sites and for their respective fossil ages. The size of the circle represents the great-circle (Haversine) distance to a grid point in central–eastern Africa (4° N, 36° E), with larger circles indicating closer proximity to this location.
Fig. 2 Habitat overlap, succession and geographical distribution of fossils. a, Green shading represents a Hovmoeller (time–latitude) diagram of the zonal mean of the spatial scalar product of habitat suitability for H. sapiens and H. heidelbergensis. Circles represent the corresponding average age and latitudinal distributions of fossils and archaeological artefacts. High values of habitat overlap coinciding with joint presence of fossils indicate possible locations of hominin interaction, diversification and possibly speciation. b, Same as a but for H. neanderthalensis and H. heidelbergensis (right side) and H. erectus and H. ergaster–habilis. ‘Out-of-Africa’ migration periods are marked as OOA. Potential regions for gradual diversification and transformation are indicated by dual-coloured boxes. c, NPP (Methods) for each fossil and archaeological site (coloured circles), selected by averaging the 2Ma NPP data in a 6° × 6° vicinity around the fossil sites and for their respective fossil ages. The size of the circle represents the great-circle (Haversine) distance to a grid point in central–eastern Africa (4° N, 36° E), with larger circles indicating closer proximity to this location.CC BY · PubMed Central
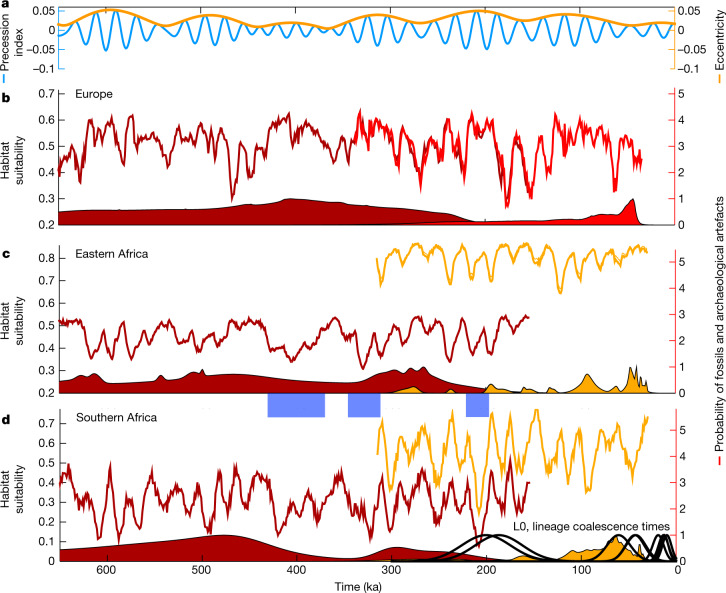
Fig. 3 Hominin species succession in Europe and southern Africa. a, Eccentricity (orange) and precession (blue) indices from Fig. 1f. b, Habitat suitability calculated from the CEM for H. heidelbergensis (dark red curves) and H. neanderthalensis (red curves) in Europe (4° × 4° average centred around 45° N, 6° E). c, Same as b but for H. heidelbergensis (dark red) and H. sapiens (orange) in eastern–central Africa (4° × 4° average centred near 5° S, 36° E). d, Same as c but for southern Africa (4° × 4° average centred near 24° S, 24° E). The shaded curves represent probability estimates of the occurrence of respective fossil and/or archaeological data obtained from the ages and age uncertainties of the fossils in the respective broader regions. The thick black curves in d represent the probability of the coalescence times32 of the mitochondrial DNA lineages L0, L0d′k, L0a′b′f′g, and L0k as a genetic manifestation of deep-rooted modern human ancestry in southern Africa. Light-blue shaded bars indicate key periods of reduced habitat suitability in southern Africa. The robustness of these calculations against uncertainties in species attribution and dating of archaeological layers (Methods) is further documented in Extended Data Fig. 10.
Fig. 3 Hominin species succession in Europe and southern Africa. a, Eccentricity (orange) and precession (blue) indices from Fig. 1f. b, Habitat suitability calculated from the CEM for H. heidelbergensis (dark red curves) and H. neanderthalensis (red curves) in Europe (4° × 4° average centred around 45° N, 6° E). c, Same as b but for H. heidelbergensis (dark red) and H. sapiens (orange) in eastern–central Africa (4° × 4° average centred near 5° S, 36° E). d, Same as c but for southern Africa (4° × 4° average centred near 24° S, 24° E). The shaded curves represent probability estimates of the occurrence of respective fossil and/or archaeological data obtained from the ages and age uncertainties of the fossils in the respective broader regions. The thick black curves in d represent the probability of the coalescence times32 of the mitochondrial DNA lineages L0, L0d′k, L0a′b′f′g, and L0k as a genetic manifestation of deep-rooted modern human ancestry in southern Africa. Light-blue shaded bars indicate key periods of reduced habitat suitability in southern Africa. The robustness of these calculations against uncertainties in species attribution and dating of archaeological layers (Methods) is further documented in Extended Data Fig. 10.CC BY · PubMed Central
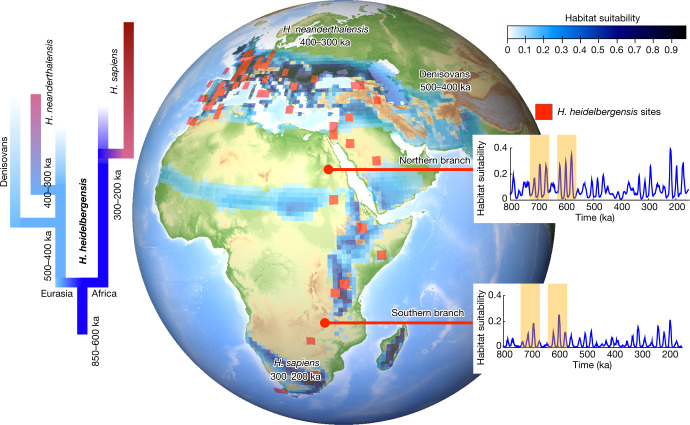
Fig. 4 Schematics of H. heidelbergensis succession. On the basis of fossil ages, we propose a split of H. heidelbergensis into northern and southern branches (blue shading, habitat suitability) around 850–650 ka. The gradual transition at 300–200 ka of H. heidelbergensis into H. sapiens in southern Africa is supported by fossil and archaeological data in this region and habitat overlap estimates (Fig. 2a). The proposed divergence at 400–300 ka of H. heidelbergensis into Neanderthals in Europe is consistent with recent genetic estimates34. This scenario is also in agreement with Neanderthal whole-genome data44 that suggest a population split between Neanderthal–Denisovan and modern human lineages between 550 and 765 ka and a divergence between Neanderthals and Denisovans around 445–473 ka. Possible eccentricity-modulated windows for early non-coastal north–south migrations occurred around 700 ka and 600 ka during periods of high eccentricity, according to the calculated HSM (see inset time series for 4° × 4° averages centred near 21° N, 31° E and 20° S, 31° E).
Fig. 4 Schematics of H. heidelbergensis succession. On the basis of fossil ages, we propose a split of H. heidelbergensis into northern and southern branches (blue shading, habitat suitability) around 850–650 ka. The gradual transition at 300–200 ka of H. heidelbergensis into H. sapiens in southern Africa is supported by fossil and archaeological data in this region and habitat overlap estimates (Fig. 2a). The proposed divergence at 400–300 ka of H. heidelbergensis into Neanderthals in Europe is consistent with recent genetic estimates34. This scenario is also in agreement with Neanderthal whole-genome data44 that suggest a population split between Neanderthal–Denisovan and modern human lineages between 550 and 765 ka and a divergence between Neanderthals and Denisovans around 445–473 ka. Possible eccentricity-modulated windows for early non-coastal north–south migrations occurred around 700 ka and 600 ka during periods of high eccentricity, according to the calculated HSM (see inset time series for 4° × 4° averages centred near 21° N, 31° E and 20° S, 31° E).CC BY · PubMed Central
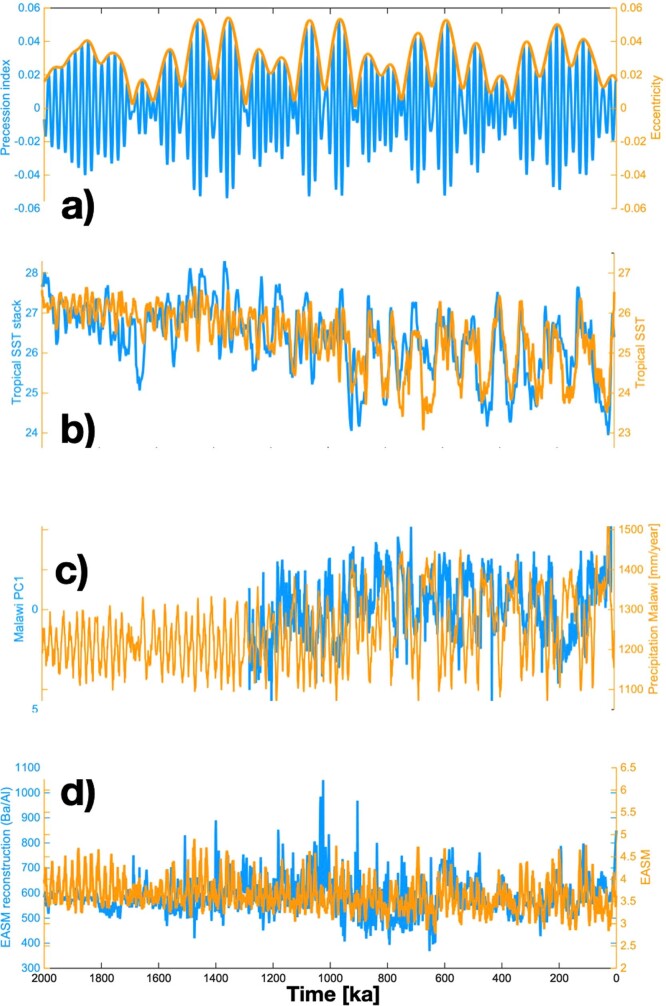
Extended Data Fig. 1 Model/data comparison. a) precession index (blue) over last 2 million years and eccentricity timeseries (orange); h) reconstructed60 (blue) and simulated (orange, CESM1.2) tropical sea surface temperatures; i) hydroclimate reconstruction from Lake Malawi61 (blue, southeastern Africa) and simulated precipitation (orange); j) geochemical proxy (Ba/Al ratio) representing variations of the East Asian Summer Monsoon62 (EASM) (blue) and simulated rainfall from CESM1.2 (orange) for the location 116.2oE, 19.3oN (mm/day).
Extended Data Fig. 1 Model/data comparison. a) precession index (blue) over last 2 million years and eccentricity timeseries (orange); h) reconstructed60 (blue) and simulated (orange, CESM1.2) tropical sea surface temperatures; i) hydroclimate reconstruction from Lake Malawi61 (blue, southeastern Africa) and simulated precipitation (orange); j) geochemical proxy (Ba/Al ratio) representing variations of the East Asian Summer Monsoon62 (EASM) (blue) and simulated rainfall from CESM1.2 (orange) for the location 116.2oE, 19.3oN (mm/day).CC BY · PubMed Central
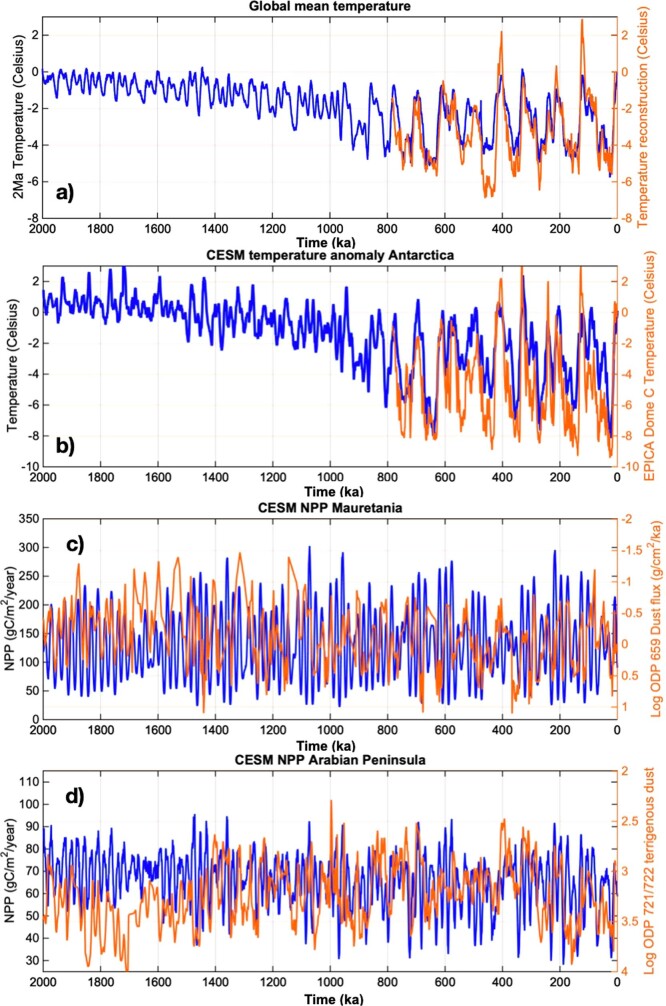
Extended Data Fig. 2 Model/data comparison. a) simulated global temperatures anomalies (relative to pre-industrial conditions) (blue) and palaeo-climate reconstruction18; b) simulated regional temperature in Antarctica (5°x5° degree average over Dome C location) (blue) with deuterium based temperature reconstruction from EPICA Dome C63; c) calculated net primary production for northwestern Sahara (blue) with logarithm of dust flux from marine core ODP65964; d) calculated net primary production for Arabian Peninsula (blue) with logarithm of terrigenous dust concentration from marine core ODP721/72265.
Extended Data Fig. 2 Model/data comparison. a) simulated global temperatures anomalies (relative to pre-industrial conditions) (blue) and palaeo-climate reconstruction18; b) simulated regional temperature in Antarctica (5°x5° degree average over Dome C location) (blue) with deuterium based temperature reconstruction from EPICA Dome C63; c) calculated net primary production for northwestern Sahara (blue) with logarithm of dust flux from marine core ODP65964; d) calculated net primary production for Arabian Peninsula (blue) with logarithm of terrigenous dust concentration from marine core ODP721/72265.CC BY · PubMed Central
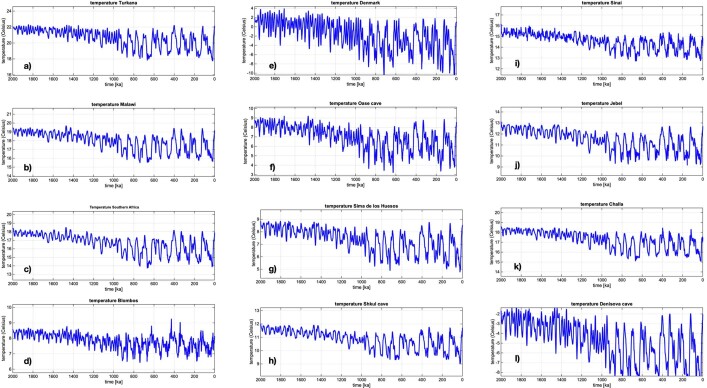
Extended Data Fig. 3 Surface temperature near sites relevant for interpretation of hominin evolution. from a-l: Lake Turkana (3°N, 36°E), Lake Malawi (12°S, 34°E), Southern Africa (25°S, 25°E), Blombos cave (34°S, 21°E), Denmark (56°N, 9°E), Peçtera cu Oase (45°N, 22°E), Sima de los Huesos (42°N, 5°W), Shkul cave (33°N, 35°E), Sinai (30°N, 34°E), Jebel Irhoud (34°N, 4°W), Lake Challa (3°S, 38°E), Denisova, cave (52°N, 84°E). The timeseries represents a spatial mean of 7°x7° around the center location.
Extended Data Fig. 3 Surface temperature near sites relevant for interpretation of hominin evolution. from a-l: Lake Turkana (3°N, 36°E), Lake Malawi (12°S, 34°E), Southern Africa (25°S, 25°E), Blombos cave (34°S, 21°E), Denmark (56°N, 9°E), Peçtera cu Oase (45°N, 22°E), Sima de los Huesos (42°N, 5°W), Shkul cave (33°N, 35°E), Sinai (30°N, 34°E), Jebel Irhoud (34°N, 4°W), Lake Challa (3°S, 38°E), Denisova, cave (52°N, 84°E). The timeseries represents a spatial mean of 7°x7° around the center location.CC BY · PubMed Central
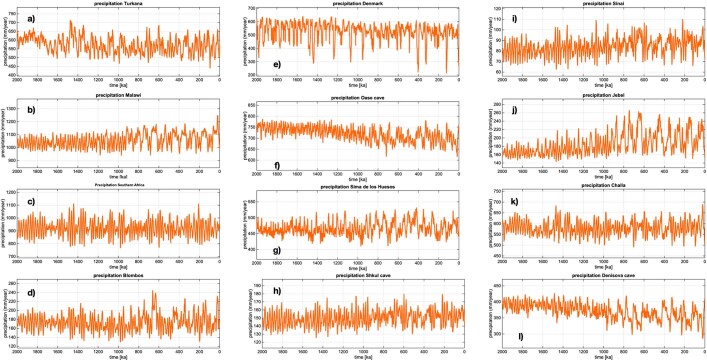
Extended Data Fig. 4 Precipitation near sites relevant for interpretation of hominin evolution. from a-l: Lake Turkana (3°N, 36°E), Lake Malawi (12°S, 34°E), Southern Africa (25°S, 25°E), Blombos cave (34°S, 21°E), Denmark (56°N, 9°E), Peçtera cu Oase (45°N, 22°E), Sima de los Huesos (42°N, 5°W), Shkul cave (33°N, 35°E), Sinai (30°N, 34°E), Jebel Irhoud (34°N, 4°W), Lake Challa (3°S, 38°E), Denisova, cave (52°N, 84°E). The timeseries represents a spatial mean of 7°x7° around the center location.
Extended Data Fig. 4 Precipitation near sites relevant for interpretation of hominin evolution. from a-l: Lake Turkana (3°N, 36°E), Lake Malawi (12°S, 34°E), Southern Africa (25°S, 25°E), Blombos cave (34°S, 21°E), Denmark (56°N, 9°E), Peçtera cu Oase (45°N, 22°E), Sima de los Huesos (42°N, 5°W), Shkul cave (33°N, 35°E), Sinai (30°N, 34°E), Jebel Irhoud (34°N, 4°W), Lake Challa (3°S, 38°E), Denisova, cave (52°N, 84°E). The timeseries represents a spatial mean of 7°x7° around the center location.CC BY · PubMed Central
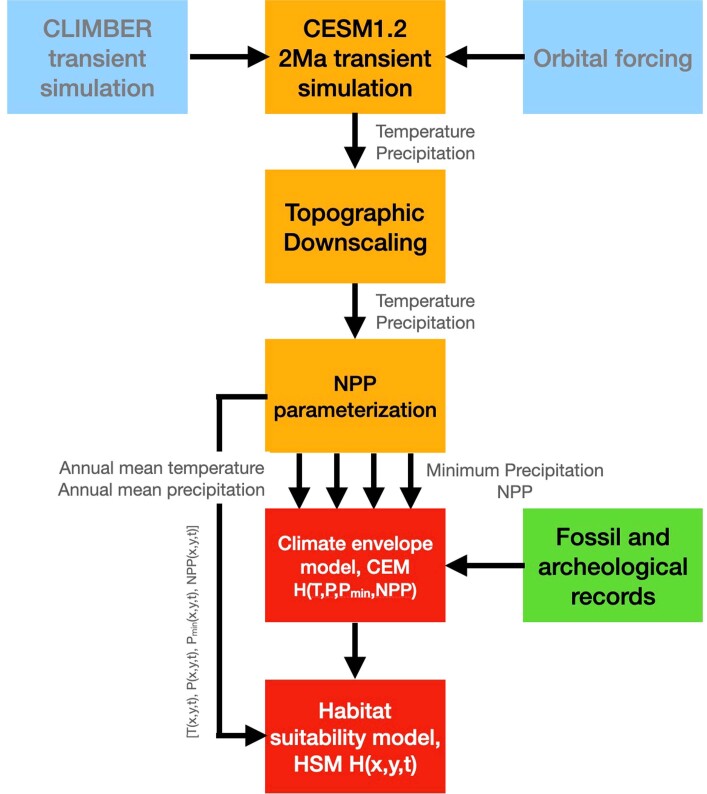
Extended Data Fig. 5 Schematic of Climate envelope model (CEM) and Habitat suitability model (HSM) set-up. The orbital scale transient 2Ma simulation of CESM1.2 is conducted by using CO2 and ice-sheet forcings from an intermediate complexity model simulation15 and orbital forcing from astronomical estimates16. The simulated surface temperatures and precipitation from 2Ma on a ~3.75-degree horizontal grid are then downscaled to a 1x1 degree horizontal grid by including lapse-rate corrected topographic features. Net Primary Production is calculated from empirical parameterizations of the downscaled temperature and precipitation fields (Extended Data Fig. 8d–f). Using an extended fossil and archaeological database (Supplementary Table 1) in combination with the downscaled annual mean temperatures, annual mean rainfall, minimum rainfall and net primary productivity, a statistical Mahalanobis distance-based climate envelope model (CEM) is derived. The model is then forced for every land grid point on a 1x1 degree grid with the temporal evolution of the downscaled climate variables to obtain the temporal evolution of the habitat suitability (HSM) for each of the 5 hominin groups and at every grid point. The impact of resolution on key features in simulated net primary production is further illustrated in Extended Data Fig. 8d–f.
Extended Data Fig. 5 Schematic of Climate envelope model (CEM) and Habitat suitability model (HSM) set-up. The orbital scale transient 2Ma simulation of CESM1.2 is conducted by using CO2 and ice-sheet forcings from an intermediate complexity model simulation15 and orbital forcing from astronomical estimates16. The simulated surface temperatures and precipitation from 2Ma on a ~3.75-degree horizontal grid are then downscaled to a 1x1 degree horizontal grid by including lapse-rate corrected topographic features. Net Primary Production is calculated from empirical parameterizations of the downscaled temperature and precipitation fields (Extended Data Fig. 8d–f). Using an extended fossil and archaeological database (Supplementary Table 1) in combination with the downscaled annual mean temperatures, annual mean rainfall, minimum rainfall and net primary productivity, a statistical Mahalanobis distance-based climate envelope model (CEM) is derived. The model is then forced for every land grid point on a 1x1 degree grid with the temporal evolution of the downscaled climate variables to obtain the temporal evolution of the habitat suitability (HSM) for each of the 5 hominin groups and at every grid point. The impact of resolution on key features in simulated net primary production is further illustrated in Extended Data Fig. 8d–f.CC BY · PubMed Central
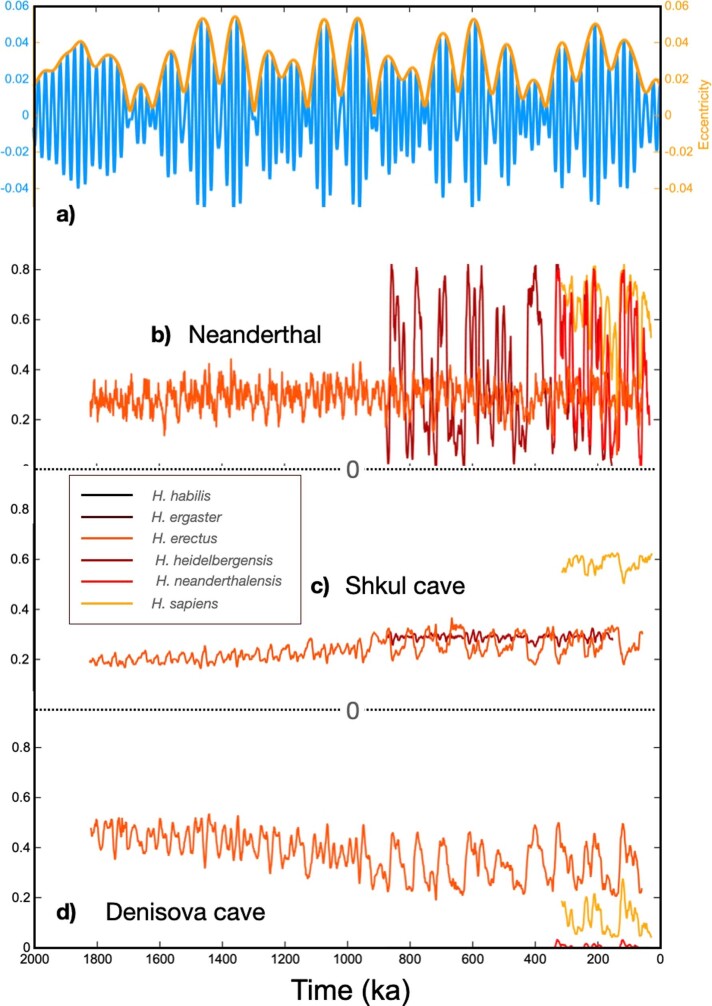
Extended Data Fig. 6 Orbital effects on regional habitability in Eurasia. Timeseries for precession (blue) and eccentricity (a) and simulated regional habitat suitability at selected sites of archaeological interest for Homo habilis, Homo ergaster, Homo erectus, Homo heidelbergensis, Homo neanderthalensis, and Homo sapiens. The centre locations of a 5°x5° averaging area are selected as: b) Neanderthal (51°N, 7°E); c) Shkul cave (33°N, 35°E); d) Denisova Cave (51°N, 85°E).
Extended Data Fig. 6 Orbital effects on regional habitability in Eurasia. Timeseries for precession (blue) and eccentricity (a) and simulated regional habitat suitability at selected sites of archaeological interest for Homo habilis, Homo ergaster, Homo erectus, Homo heidelbergensis, Homo neanderthalensis, and Homo sapiens. The centre locations of a 5°x5° averaging area are selected as: b) Neanderthal (51°N, 7°E); c) Shkul cave (33°N, 35°E); d) Denisova Cave (51°N, 85°E).CC BY · PubMed Central
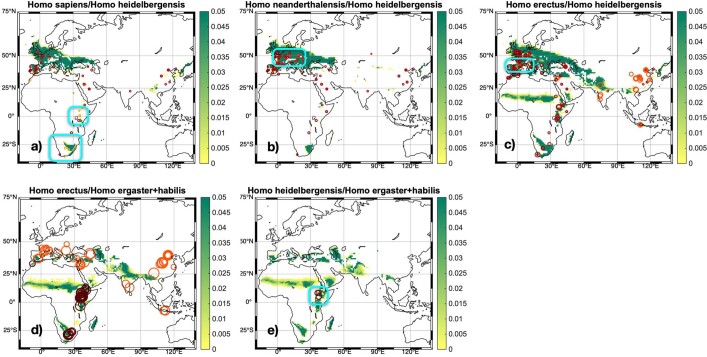
Extended Data Fig. 7 Potential hominin overlap regions. a) Shading indicates the relative occurrence frequency (relative to the entire 2-million-year simulation history) of when the habitat suitability for Homo sapiens and Homo heidelbergensis at a grid point both exceed 0.3 and exhibit a difference of less than 0.1. This constraint is considered here as a measure of habitat similarity during overlap times. Circles show the respective fossil and archaeological sites from the overlap periods. Cyan boxes highlight areas, for which there are mixed fossils available and high habitat similarity. These areas are potential areas for speciation events or gradual evolutionary transformations. b) same as a), but for Homo neanderthalensis and Homo heidelbergensis; c) same as a) but for Homo erectus and Homo heidelbergensis; d) same as a) but for Homo erectus and Homo ergaster/habilis; e) same as a) but for Homo ergaster/habilis and Homo heidelbergensis. The size of the circles scales with the age of the fossils.
Extended Data Fig. 7 Potential hominin overlap regions. a) Shading indicates the relative occurrence frequency (relative to the entire 2-million-year simulation history) of when the habitat suitability for Homo sapiens and Homo heidelbergensis at a grid point both exceed 0.3 and exhibit a difference of less than 0.1. This constraint is considered here as a measure of habitat similarity during overlap times. Circles show the respective fossil and archaeological sites from the overlap periods. Cyan boxes highlight areas, for which there are mixed fossils available and high habitat similarity. These areas are potential areas for speciation events or gradual evolutionary transformations. b) same as a), but for Homo neanderthalensis and Homo heidelbergensis; c) same as a) but for Homo erectus and Homo heidelbergensis; d) same as a) but for Homo erectus and Homo ergaster/habilis; e) same as a) but for Homo ergaster/habilis and Homo heidelbergensis. The size of the circles scales with the age of the fossils.CC BY · PubMed Central
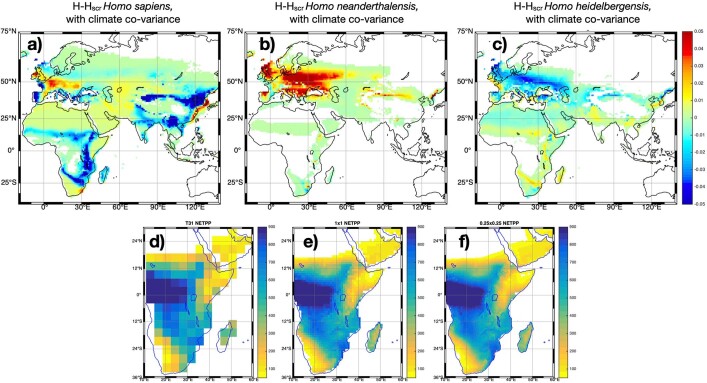
Extended Data Fig. 8 Climate effects on time-mean habitat suitability of Homo sapiens, Homo neanderthalensis, Homo heidelbergensis. a–c) difference between time-averaged habitat suitability estimated from original climate envelope model H and climate envelope model Hscr calculated from vector-randomized climate variables (Methods) for 3 hominin groups. This type of time randomization (Methods) maintains the time-mean and climate co-variance among the 4-dimensional climate input vector. Results show the effect of the original orbital-scale climate trajectory (relative to a randomized climate trajectory) on hominin habitat suitability. Only grid points with p < 0.05 are shown in colors based on a paired t-test using H(x,y,t) and Hscr(x,y,t). d–f) Illustration of late-Holocene altitude-corrected downscaling of net primary production: Left: Simulated NPP (gC/m2/year) for original T31 atmosphere resolution, obtained from empirical NPP model using 1000-year late Holocene average of total precipitation and surface temperatures simulated by the CESM1.2 2Ma experiment; middle: same as left, but using altitude-corrections for temperature and precipitation as downscaling onto a 1x1 degree target grid, showing the emergence of key topographic features in Africa. This resolution was chosen in the calculations of the climate envelope model; right: for illustration, same as middle but for a 0.25x0.25 degree horizontal target grid. The qualitative gain in terms of regional details from T31 to 1x1 degree resolution outweighs the additional gain going from 1x1 degree resolution to a 0.25x0.25 degree grid.
Extended Data Fig. 8 Climate effects on time-mean habitat suitability of Homo sapiens, Homo neanderthalensis, Homo heidelbergensis. a–c) difference between time-averaged habitat suitability estimated from original climate envelope model H and climate envelope model Hscr calculated from vector-randomized climate variables (Methods) for 3 hominin groups. This type of time randomization (Methods) maintains the time-mean and climate co-variance among the 4-dimensional climate input vector. Results show the effect of the original orbital-scale climate trajectory (relative to a randomized climate trajectory) on hominin habitat suitability. Only grid points with p < 0.05 are shown in colors based on a paired t-test using H(x,y,t) and Hscr(x,y,t). d–f) Illustration of late-Holocene altitude-corrected downscaling of net primary production: Left: Simulated NPP (gC/m2/year) for original T31 atmosphere resolution, obtained from empirical NPP model using 1000-year late Holocene average of total precipitation and surface temperatures simulated by the CESM1.2 2Ma experiment; middle: same as left, but using altitude-corrections for temperature and precipitation as downscaling onto a 1x1 degree target grid, showing the emergence of key topographic features in Africa. This resolution was chosen in the calculations of the climate envelope model; right: for illustration, same as middle but for a 0.25x0.25 degree horizontal target grid. The qualitative gain in terms of regional details from T31 to 1x1 degree resolution outweighs the additional gain going from 1x1 degree resolution to a 0.25x0.25 degree grid.CC BY · PubMed Central
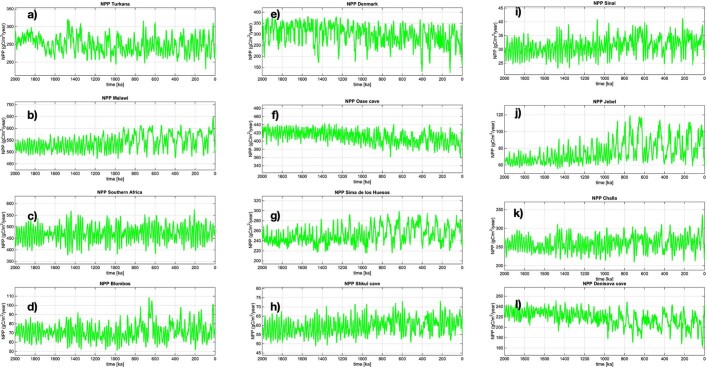
Extended Data Fig. 9 Net primary production near sites relevant for interpretation of hominin evolution. from a-l: Lake Turkana (3°N, 36°E), Lake Malawi (12°S, 34°E), Southern Africa (25°S, 25°E), Blombos cave (34°S, 21°E), Denmark (56°N, 9°E), Peçtera cu Oase (45°N, 22°E), Sima de los Huesos (42°N, 5°W), Shkul cave (33°N, 35°E), Sinai (30°N, 34°E), Jebel Irhoud (34°N, 4°W), Lake Challa (3°S, 38°E), Denisova, cave (52°N, 84°E). The timeseries represents a spatial mean of 7°x7° degree around the center location.
Extended Data Fig. 9 Net primary production near sites relevant for interpretation of hominin evolution. from a-l: Lake Turkana (3°N, 36°E), Lake Malawi (12°S, 34°E), Southern Africa (25°S, 25°E), Blombos cave (34°S, 21°E), Denmark (56°N, 9°E), Peçtera cu Oase (45°N, 22°E), Sima de los Huesos (42°N, 5°W), Shkul cave (33°N, 35°E), Sinai (30°N, 34°E), Jebel Irhoud (34°N, 4°W), Lake Challa (3°S, 38°E), Denisova, cave (52°N, 84°E). The timeseries represents a spatial mean of 7°x7° degree around the center location.CC BY · PubMed Central
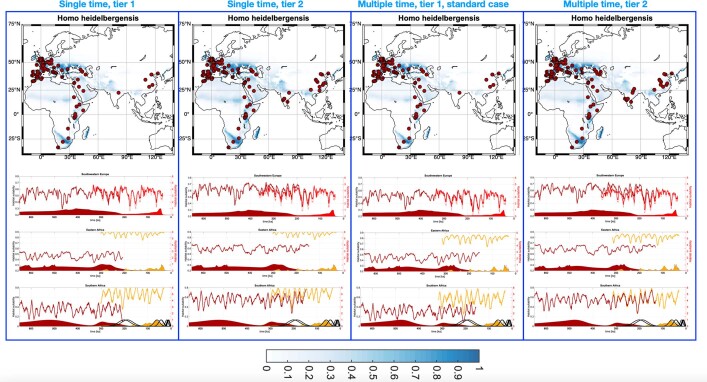
Extended Data Fig. 10 Robustness with respect to age and species assignment uncertainties. Upper panels, same as for Fig. 1c, but for the 4 different cases single date-tier 1,2 and multi date-tier 1,2 (Methods). Multi-date tier 1 is the standard case used in our analysis. Lower panels, same as Fig. 3b–d, but calculated also for the 4 cases of assessing species and age uncertainties.
Extended Data Fig. 10 Robustness with respect to age and species assignment uncertainties. Upper panels, same as for Fig. 1c, but for the 4 different cases single date-tier 1,2 and multi date-tier 1,2 (Methods). Multi-date tier 1 is the standard case used in our analysis. Lower panels, same as Fig. 3b–d, but calculated also for the 4 cases of assessing species and age uncertainties.CC BY · PubMed Central

Verification

Claims the paper makes

The claims and statistics of this paper haven’t been checked yet.

Run the check — free, no account needed. It reads the open-access text and checks the sources it cites.

A few free checks a day · papers already verified open instantly · results are public

Claims other papers make about this one

Each is checked against this paper’s own text: does it say what the citing paper says it does?

Self-check

Percentages, sums and reported differences re-computed from the paper’s own numbers.

The self-check needs the paper’s full text.

Citations

Cites

Research works printed but not linked: 58

  1. deMenocal, P. B. Climate and human evolution. Science 331, 540–542 (2011). · DOI
  2. Potts, R. Variability selection in hominid evolution. Evol. Anthropol. 7, 81–96 (1998). · DOI
  3. Levin, N. E., Quade, J., Simpson, S. W., Semaw, S. & Rogers, M. Isotopic evidence for Plio–Pleistocene environmental change at Gona, Ethiopia. Earth Planet. Sci. Lett. 219, 93–110 (2004). · DOI
  4. Dart, R. A. Australopithecus africanus: the man–ape of South Africa. Nature 115, 195–199 (1925). · DOI
  5. Dominguez-Rodrigo, M. Is the “savanna hypothesis” a dead concept for explaining the emergence of the earliest hominins? Curr. Anthropol. 55, 59–81 (2014). · DOI
  6. Timmermann, A. & Friedrich, T. Late Pleistocene climate drivers of early human migration. Nature 538, 92–95 (2016). · DOI
  7. Breeze, P. S. et al. Palaeohydrological corridors for hominin dispersals in the Middle East similar to 250–70,000 years ago. Quatern. Sci. Rev. 144, 155–185 (2016). · DOI · Paper page
  8. Beyer, R. M., Krapp, M., Eriksson, A. & Manica, A. Climatic windows for human migration out of Africa in the past 300,000 years. Nat. Commun. 12, 4889 (2021). · DOI
  9. Groucutt, H. S. et al. Multiple hominin dispersals into southwest Asia over the past 400,000 years. Nature 597, 376–380 (2021). · DOI
  10. Pagani, L. et al. Genomic analyses inform on migration events during the peopling of Eurasia. Nature 538, 238–242 (2016). · DOI
  11. Potts, R. et al. Increased ecological resource variability during a critical transition in hominin evolution. Sci. Adv. 6, eabc8975 (2020). · DOI
  12. Potts, R. & Faith, J. T. Alternating high and low climate variability: the context of natural selection and speciation in Plio–Pleistocene hominin evolution. J. Hum. Evol. 87, 5–20 (2015). · DOI
  13. Tigchelaar, M. & Timmermann, A. Mechanisms rectifying the annual mean response of tropical Atlantic rainfall to precessional forcing. Clim. Dynam. 47, 271–293 (2016). · DOI
  14. Willeit, M., Ganopolski, A., Calov, R. & Brovkin, V. Mid-Pleistocene transition in glacial cycles explained by declining CO2 and regolith removal. Sci. Adv. 5, eaav7337 (2019). · DOI
  15. Berger, A. Long-term variations of caloric insolation resulting from the Earth’s orbital elements. Quatern. Res. 9, 139–167 (1978). · DOI · Paper page
  16. Lorenz, S. J. & Lohmann, G. Acceleration technique for Milankovitch type forcing in a coupled atmosphere–ocean circulation model: method and application for the Holocene. Clim. Dynam. 23, 727–743 (2004). · DOI
  17. Friedrich, T., Timmermann, A., Tigchelaar, M., Timm, O. E. & Ganopolski, A. Nonlinear climate sensitivity and its implications for future greenhouse warming. Sci. Adv. 2, e1501923 (2016). · DOI
  18. Friedrich, T. & Timmermann, A. Using late Pleistocene sea surface temperature reconstructions to constrain future greenhouse warming. Earth Planet. Sci. Lett. 530, 115911 (2020). · DOI
  19. Tierney, J. E. et al. Glacial cooling and climate sensitivity revisited. Nature 584, 569–573 (2020). · DOI · Paper page
  20. Raia, P., Mondanaro, A., Melchionna, M., Di Febbraro, M. & Diniz-Filho, J. A. F. Past extinctions of Homo species coincided with increased vulnerability to climatic change. One Earth 3, 1–11 (2020). · DOI
  21. Mondanaro, A. et al. A major change in rate of climate niche envelope evolution during hominid history. iScience 23, 101693 (2020). · DOI
  22. Etherington, T. R. Mahalanobis distances and ecological niche modelling: correcting a chi-squared probability error. PeerJ 7, e6678 (2019). · DOI
  23. Farber, O. & Kadmon, R. Assessment of alternative approaches for bioclimatic modeling with special emphasis on the Mahalanobis distance. Ecol. Model. 160, 115–130 (2003). · DOI
  24. Antón, S. Natural history of Homo erectus. Am. J. Phys. Anthropol. S37, 126–170 (2003). · DOI
  25. Kaboth-Bahr, S. et al. Paleo-ENSO influence on African environments and early modern humans. Proc. Natl Acad. Sci. USA 118, e2018277118 (2021). · DOI
  26. Santonja, M., Perez-Gonzalez, A., Panera, J., Rubio-Jara, S. & Mendez-Quintas, E. The coexistence of Acheulean and Ancient Middle Palaeolithic techno-complexes in the Middle Pleistocene of the Iberian Peninsula. Quatern. Int. 411, 367–377 (2016). · DOI
  27. Arsuaga, J. L. et al. Neandertal roots: cranial and chronological evidence from Sima de los Huesos. Science 344, 1358–1363 (2014). · DOI · Paper page
  28. Backwell, L. R. et al. New excavations at Border Cave, KwaZulu-Natal, South Africa. J. Field Archaeol. 43, 417–436 (2018). · DOI
  29. Porat, N. et al. New radiometric ages for the Fauresmith industry from Kathu Pan, southern Africa: implications for the Earlier to Middle Stone Age transition. J. Archaeol. Sci. 37, 269–283 (2010). · DOI
  30. Chan, E. K. F. et al. Human origins in a southern African palaeo-wetland and first migrations. Nature 575, 185–189 (2019). · DOI · Paper page
  31. Schlebusch, C. M. et al. Khoe-San genomes reveal unique variation and confirm the deepest population divergence in Homo sapiens. Mol. Biol. Evol. 37, 2944–2954 (2020). · DOI
  32. Foley, R. A. Mosaic evolution and the pattern of transitions in the hominin lineage. Philos. Trans. R. Soc. B 371, 20150244 (2016). · DOI
  33. Amos, W. Correlated and geographically predictable Neanderthal and Denisovan legacies are difficult to reconcile with a simple model based on inter-breeding. R. Soc. Open Sci. 8, 201229 (2021). · DOI
  34. Slon, V. et al. The genome of the offspring of a Neanderthal mother and a Denisovan father. Nature 561, 113–116 (2018). · DOI · Paper page
  35. Shultz, S. & Maslin, M. Early human speciation, brain expansion and dispersal influenced by African climate pulses. PLoS ONE 8, e76750 (2013). · DOI
  36. Scerri, E. M. L. et al. Did our species evolve in subdivided populations across Africa, and why does it matter? Trends Ecol. Evol. 33, 582–594 (2018). · DOI
  37. Holt, R. D. Bringing the Hutchinsonian niche into the 21st century: ecological and evolutionary perspectives. Proc. Natl Acad. Sci. USA 106, 19659–19665 (2009). · DOI
  38. Hua, X. & Wiens, J. J. How does climate influence speciation? Am. Nat. 182, 1–12 (2013). · DOI
  39. Meehl, G. A. et al. Context for interpreting equilibrium climate sensitivity and transient climate response from the CMIP6 Earth system models. Sci. Adv. 6, eaba1981 (2020). · DOI · Paper page
  40. Masson-Delmotte, V. et al. (eds) IPCC, 2021: Climate Change 2021: The Physical Science Basis. Contribution of Working Group I to the Sixth Assessment Report of the Intergovernmental Panel on Climate Change (Cambridge University Press, in the press).
  41. Ganopolski, A., Calov, R. & Claussen, M. Simulation of the last glacial cycle with a coupled climate ice-sheet model of intermediate complexity. Clim. Past 6, 229–244 (2010). · DOI
  42. Timmermann, A. et al. Modeling obliquity and CO2 effects on Southern Hemisphere climate during the past 408 ka. J. Clim. 27, 1863–1875 (2014). · DOI
  43. Ganopolski, A. & Rahmstorf, S. Rapid changes of glacial climate simulated in a coupled climate model. Nature 409, 153–158 (2001). · DOI
  44. Friedrich, T. et al. The mechanism behind internally generated centennial-to-millennial scale climate variability in an Earth system model of intermediate complexity. Geosci. Model Dev. 3, 377–389 (2010). · DOI
  45. Vettoretti, G. & Peltier, W. R. Fast physics and slow physics in the nonlinear Dansgaard–Oeschger relaxation oscillation. J. Clim. 31, 3423–3449 (2018). · DOI
  46. Brovkin, V., Ganopolski, A. & Svirezhev, Y. A continuous climate-vegetation classification for use in climate–biosphere studies. Ecol. Model. 101, 251–261 (1997). · DOI
  47. Del Grosso, S. et al. Global potential net primary production predicted from vegetation class, precipitation, and temperature. Ecology 89, 2117–2126 (2008). · DOI
  48. Ainsworth, E. A. & Rogers, A. The response of photosynthesis and stomatal conductance to rising CO2: mechanisms and environmental interactions. Plant Cell Environ. 30, 258–270 (2007). · DOI
  49. Profico, A. et al. Filling the gap. Human cranial remains from Gombore II (Melka Kunture, Ethiopia; ca. 850 ka) and the origin of Homo heidelbergensis. J. Anthropol. Sci. 94, 1–24 (2016).
  50. Meignen, L. in The Lower and Middle Palaeolithic in the Middle East and Neighbouring Regions (eds Le Tensorer, J. M. et al.) 85–100 (University of Liège Press, 2011).
  51. Krajcarz, M. T. et al. Towards a chronology of the Jerzmanowician—a new series of radiocarbon dates from Nietoperzowa Cave (Poland). Archaeometry 60, 383–401 (2018). · DOI
  52. de la Torre, I. et al. New excavations in the MNK Skull site, and the last appearance of the Oldowan and Homo habilis at Olduvai Gorge, Tanzania. J. Anthropol. Archaeol. 61, 101255 (2021). · DOI
  53. Herbert, T. D., Peterson, L. C., Lawrence, K. T. & Liu, Z. H. Tropical ocean temperatures over the past 3.5 million years. Science 328, 1530–1534 (2010). · DOI
  54. Clemens, S. C., Prell, W. L., Sun, Y. B., Liu, Z. Y. & Chen, G. S. Southern Hemisphere forcing of Pliocene δ18O and the evolution of Indo–Asian monsoons. Paleoceanography 23, PA4210 (2008). · DOI
  55. Lyons, R. P. et al. Continuous 1.3-million-year record of East African hydroclimate, and implications for patterns of evolution and biodiversity. Proc. Natl Acad. Sci. USA 112, 15568–15573 (2015). · DOI
  56. Jouzel, J. et al. Orbital and millennial Antarctic climate variability over the past 800,000 years. Science 317, 793–796 (2007). · DOI
  57. Tiedemann, R., Sarnthein, M. & Shackleton, N. J. Astronomic timescale for the Pliocene Atlantic δ18O and dust flux records of Ocean Drilling Program Site-659. Paleoceanography 9, 619–638 (1994). · DOI
  58. DeMenocal, P. B. African climate change and faunal evolution during the Pliocene–Pleistocene. Earth Planet. Sci. Lett. 220, 3–24 (2004). · DOI

Cited by

Sorted by citations

See all 152

Metadata

Authors
Timmermann, A., Yun, K.-S., Raia, P., Ruan, J., Mondanaro, A., Zeller, E., Zollikofer, C., Ponce de León, M., Lemmon, D., Willeit, M., & Ganopolski, A.
Venue
Nature
Published
2022-04-13
Volume
604
Issue
7906
Pages
495-501
ISSN
  • 0028-0836
  • 1476-4687
Cited by
152
References
7
Language
en

About these checks

Registry, retraction, Cites and statistics results are computed, not judged, with one exception: a printed reference that no index lists is read once by a model before it counts as a citation error. Claims are extracted by a model and kept only when their quote appears verbatim in the text; each cited source is then checked, with a model’s help, for whether it says what the claim relies on. Those verdicts can be wrong — read the claim’s quote and the cited source before relying on one.

Statistics and arithmetic are recomputed, not judged.

Confidence bands are shown only for fields calibrated on our annotated test set. None is calibrated yet, so no band is shown.

What counts as a claim ›How we measure confidence ›How we check this ›

Are you an author, or do you see a problem with this page? Request a review