CoChat

Gap junctions desynchronize a neural circuit to stabilize insect flight

Open access

The DOI matches its Crossref record; 65 of the 65 references it cites were found in a registry or an index.

Abstract

, the architecture and function of the central-pattern-generating (CPG) neural network remain unclear. Here, on the basis of an experiment-theory approach including electrophysiology, optophysiology, Drosophila genetics and mathematical modelling, we identify a miniaturized circuit solution with unexpected properties. The CPG network consists of motoneurons interconnected by electrical synapses that, in contrast to doctrine, produce network activity splayed out in time instead of synchronized across neurons. Experimental and mathematical evidence support a generic mechanism for network desynchronization that relies on weak electrical synapses and specific excitability dynamics of the coupled neurons. In small networks, electrical synapses can synchronize or desynchronize network activity, depending on the neuron-intrinsic dynamics and ion channel composition. In the asynchronous flight CPG, this mechanism translates unpatterned premotor input into stereotyped neuronal firing with fixed sequences of cell activation that ensure stable wingbeat power and, as we show, is conserved across multiple species. Our findings prove a wider functional versatility of electrical synapses in the dynamic control of neural circuits and highlight the relevance of detecting electrical synapses in connectomics.

Overview

The claims and statistics of this paper haven’t been checked yet.

Free: it reads the open-access text and checks the first 5 claims that cite a source we can check. Create a free account to check every claim.

A few free checks a day · papers already verified open instantly · results are public

Integrity signals

Registry

Crossref · 10.1038/s41586-023-06099-0

Cites

65 of 65 references verified0 citation errors · 0 not checkable

Statistics

Figures

Fig. 1 Splayed-out MN firing patterns control Drosophila flight. a, Representative recording of MN1–5 and wingbeat frequency (bottom trace, magnified in the black box) during tethered flight. Colour-coded schematic of MN1–5 in the VNC and axonal projections to the six fibres of the DLM. b, Average MN firing frequencies are similar within each animal. The colour code is the same as in a. n = 8 animals. Data are mean ± s.d. c, MN firing frequency and wingbeat (WB) frequency (the red bars indicate working ranges) are linearly related within an animal (grey dots; correlation coefficient, r2 = 0.63; P < 0.0001, two-tailed t-test) and with larger variance also across animals (red dots; n = 100; correlation coefficient, r2 = 0.31; P < 0.0001, two-tailed t-test). d, The firing responses of MNs (top traces) to current injections of different amplitudes (bottom traces). e, The mean MN response frequency (f) and injected current amplitude (I) are approximately linearly related for 2–30 Hz (n = 15 animals), therefore exceeding the normal MN firing frequencies observed during flight (inset; ~3–12 Hz, data from c). Data are mean ± s.e.m. (main plot) and median ± range (inset). f, During flight, MN1–4 spikes are dispersed in time (in splay state) with characteristic sequences. Each animal switches between different splay states during flight, but the same splay states are preferred across individuals (n = 8). The box plots show the median (centre line), quartiles (box limits) and range (error bars). g, Timing of MN1–4 spikes in four subsequent splay states (1423 (red); 1243 (turquoise); 1234 (green); 1324 (dark blue)) during flight.
Fig. 1 Splayed-out MN firing patterns control Drosophila flight. a, Representative recording of MN1–5 and wingbeat frequency (bottom trace, magnified in the black box) during tethered flight. Colour-coded schematic of MN1–5 in the VNC and axonal projections to the six fibres of the DLM. b, Average MN firing frequencies are similar within each animal. The colour code is the same as in a. n = 8 animals. Data are mean ± s.d. c, MN firing frequency and wingbeat (WB) frequency (the red bars indicate working ranges) are linearly related within an animal (grey dots; correlation coefficient, r2 = 0.63; P < 0.0001, two-tailed t-test) and with larger variance also across animals (red dots; n = 100; correlation coefficient, r2 = 0.31; P < 0.0001, two-tailed t-test). d, The firing responses of MNs (top traces) to current injections of different amplitudes (bottom traces). e, The mean MN response frequency (f) and injected current amplitude (I) are approximately linearly related for 2–30 Hz (n = 15 animals), therefore exceeding the normal MN firing frequencies observed during flight (inset; ~3–12 Hz, data from c). Data are mean ± s.e.m. (main plot) and median ± range (inset). f, During flight, MN1–4 spikes are dispersed in time (in splay state) with characteristic sequences. Each animal switches between different splay states during flight, but the same splay states are preferred across individuals (n = 8). The box plots show the median (centre line), quartiles (box limits) and range (error bars). g, Timing of MN1–4 spikes in four subsequent splay states (1423 (red); 1243 (turquoise); 1234 (green); 1324 (dark blue)) during flight.CC BY · PubMed Central
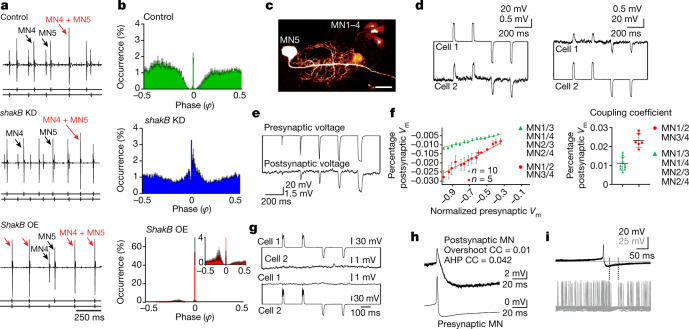
Fig. 2 Electrical synapses shape CPG output by desynchronizing MN firing. a, Representative recording of MN4 and MN5 during tethered flight in the control (top) and after RNAi KD of shakB-encoded electrical synapses (DLM-Split-GAL4>UAS-shakB-RNAi, middle) and overexpression of ShakB in MN1–5 (bottom). The black arrows mark MN4 and MN5 spikes, and the red arrows indicate simultaneous MN4–MN5 spikes. b, Phase histograms of the occurrence of MN5 spikes (y axis) in relation to consecutive MN4 spikes (phase φ = 0 corresponds to the MN4 spike) for control (top), shakB KD (middle) and ShakB overexpression (bottom) with a magnified view (inset) (n = 10 animals for each genotype). Data are mean (coloured bars) ± s.e.m. (grey). c, MN1–5 dye coupling in the dfmr1 RNAi KD background to increase dye uptake28. Scale bar, 20 μm. d–h, Intracellular recordings of MN pairs. d, Hyperpolarizations and depolarizations were conducted bidirectionally (from cell 1 to cell 2 and vice versa). e, Increasing current injection amplitude (top trace) increases response amplitudes in electrically coupled MNs (bottom trace). f, Plotting the mean presynaptic voltage (Vm) area against the mean postsynaptic voltage area (left) reveals linear relationships, but regression slopes differ between distinct MN pairs (5 animals with strong coupling between the MN1–MN2 and MN3–MN4 pairs; 10 animals with weak coupling between the MN1–MN3, MN1–MN4, MN2–MN3 and MN2–MN4 pairs). The mean CC (postsynaptic peak voltage divided by presynaptic peak voltage; right) differs significantly between MN1–MN2, MN3–MN4 (red, 6 pairs) and all other pairs (green, 10 pairs). Data are mean ± s.e.m. (left) and mean ± s.d. (right). g, RNAi KD of shakB eliminates detectable electrical coupling between MNs (3 animals). h, The CC for the spike AHP is higher than for the spike overshoot. i, Firing of a coupled MN ceases during the AHP of the presynaptic MN.
Fig. 2 Electrical synapses shape CPG output by desynchronizing MN firing. a, Representative recording of MN4 and MN5 during tethered flight in the control (top) and after RNAi KD of shakB-encoded electrical synapses (DLM-Split-GAL4>UAS-shakB-RNAi, middle) and overexpression of ShakB in MN1–5 (bottom). The black arrows mark MN4 and MN5 spikes, and the red arrows indicate simultaneous MN4–MN5 spikes. b, Phase histograms of the occurrence of MN5 spikes (y axis) in relation to consecutive MN4 spikes (phase φ = 0 corresponds to the MN4 spike) for control (top), shakB KD (middle) and ShakB overexpression (bottom) with a magnified view (inset) (n = 10 animals for each genotype). Data are mean (coloured bars) ± s.e.m. (grey). c, MN1–5 dye coupling in the dfmr1 RNAi KD background to increase dye uptake28. Scale bar, 20 μm. d–h, Intracellular recordings of MN pairs. d, Hyperpolarizations and depolarizations were conducted bidirectionally (from cell 1 to cell 2 and vice versa). e, Increasing current injection amplitude (top trace) increases response amplitudes in electrically coupled MNs (bottom trace). f, Plotting the mean presynaptic voltage (Vm) area against the mean postsynaptic voltage area (left) reveals linear relationships, but regression slopes differ between distinct MN pairs (5 animals with strong coupling between the MN1–MN2 and MN3–MN4 pairs; 10 animals with weak coupling between the MN1–MN3, MN1–MN4, MN2–MN3 and MN2–MN4 pairs). The mean CC (postsynaptic peak voltage divided by presynaptic peak voltage; right) differs significantly between MN1–MN2, MN3–MN4 (red, 6 pairs) and all other pairs (green, 10 pairs). Data are mean ± s.e.m. (left) and mean ± s.d. (right). g, RNAi KD of shakB eliminates detectable electrical coupling between MNs (3 animals). h, The CC for the spike AHP is higher than for the spike overshoot. i, Firing of a coupled MN ceases during the AHP of the presynaptic MN.CC BY · PubMed Central
Fig. 3 Weak electrical synapses and saddle homoclinic orbit (HOM) excitability dynamics underlie firing desynchronization. a,b, Conductance-based model with identical gap junctions (GJs, coupling coefficient CC < 0.05) between MN1–5 (a) produces splayed-out firing (b). c, Weak CCs (<0.05) cause high splayness indices (Methods); intermediate CCs (0.05–0.21) decrease splayness and yield multiple stable network states; CCs of >0.21 yield network synchrony (splayness = 0; 200 simulations per CC, green dots; the black line shows the average). d, Quantification of 60 s simulations (green, 10 simulations per condition) with a weak CC (0.005) yields significantly lower MN4–MN5 synchronization indices (Methods; median = 0.54) compared with strong coupling (CC = 0.258; median = 1.0; two-sided Mann–Whitney U-test, P = 0.0002). Similarly, experimental (exp.; purple) synchronization indices are significantly lower in the controls (median = 0.56, 11 animals) compared with the ShakB-overexpression group (median = 0.84, 7 animals, P = 0.0008). e, Increasing Shab channel levels transforms the single-MN model dynamics from HOM near the SNL point through SNIC to Hopf types (Extended Data Fig. 9a), which vary in action potential waveform (top) and PRC (middle). Averaging theory (Methods and equation (4)) yields the odd part of the coupling function (bottom) for each phase distance ∆φ, of which the fixpoints (black dots) determine stable network states. Only the SNL type yields one stable fixpoint at phase 0.5, therefore favouring anti-phase firing. f–h, Shab overexpression in MN1–5 nearly doubles Shab current (f), which causes in-phase firing of the MN3–MN4 pair (g) and significantly (two-sided Mann–Whitney U-test, P = 0.0434) increased synchronization indices (median = 0.52, 10 animals) compared with the controls (median = 0.43, 8 animals) (h). Similarly, increasing Shab in models with weighted GJs (as in Fig. 3i) significantly increased MN3–MN4 synchronization (sync.) indices (median = 0.99, P = 0.0002). i,j, Network models with heterogenous CCs (i) as found in vivo (Fig. 2f) yield preferred splay states as in animals (j, right; 10 simulations per condition; 8 animals, the purple dots depict median values of in vivo data), whereas homogenous coupling does not (j, left). For the box plots in d, h and j, the median (centre line), quartiles (box limits) and range (whiskers) are shown.
Fig. 3 Weak electrical synapses and saddle homoclinic orbit (HOM) excitability dynamics underlie firing desynchronization. a,b, Conductance-based model with identical gap junctions (GJs, coupling coefficient CC < 0.05) between MN1–5 (a) produces splayed-out firing (b). c, Weak CCs (<0.05) cause high splayness indices (Methods); intermediate CCs (0.05–0.21) decrease splayness and yield multiple stable network states; CCs of >0.21 yield network synchrony (splayness = 0; 200 simulations per CC, green dots; the black line shows the average). d, Quantification of 60 s simulations (green, 10 simulations per condition) with a weak CC (0.005) yields significantly lower MN4–MN5 synchronization indices (Methods; median = 0.54) compared with strong coupling (CC = 0.258; median = 1.0; two-sided Mann–Whitney U-test, P = 0.0002). Similarly, experimental (exp.; purple) synchronization indices are significantly lower in the controls (median = 0.56, 11 animals) compared with the ShakB-overexpression group (median = 0.84, 7 animals, P = 0.0008). e, Increasing Shab channel levels transforms the single-MN model dynamics from HOM near the SNL point through SNIC to Hopf types (Extended Data Fig. 9a), which vary in action potential waveform (top) and PRC (middle). Averaging theory (Methods and equation (4)) yields the odd part of the coupling function (bottom) for each phase distance ∆φ, of which the fixpoints (black dots) determine stable network states. Only the SNL type yields one stable fixpoint at phase 0.5, therefore favouring anti-phase firing. f–h, Shab overexpression in MN1–5 nearly doubles Shab current (f), which causes in-phase firing of the MN3–MN4 pair (g) and significantly (two-sided Mann–Whitney U-test, P = 0.0434) increased synchronization indices (median = 0.52, 10 animals) compared with the controls (median = 0.43, 8 animals) (h). Similarly, increasing Shab in models with weighted GJs (as in Fig. 3i) significantly increased MN3–MN4 synchronization (sync.) indices (median = 0.99, P = 0.0002). i,j, Network models with heterogenous CCs (i) as found in vivo (Fig. 2f) yield preferred splay states as in animals (j, right; 10 simulations per condition; 8 animals, the purple dots depict median values of in vivo data), whereas homogenous coupling does not (j, left). For the box plots in d, h and j, the median (centre line), quartiles (box limits) and range (whiskers) are shown.CC BY · PubMed Central
Fig. 4 Splayed-out firing ensures stable wingbeat power. a, Representative traces of wingbeat and MN multiple-unit recordings during flight (7 animals in each condition). Synchronous MN firing (top, green) causes around eight times larger fluctuations in wingbeat frequency (bottom, green) compared with splayed-out firing (blue). b, DLM fibre voltage response to one MN spike is fast (top; decay τfast ~ 1.7 ms, τslow ~14 ms; 3 animals). Both the resulting myoplasmic calcium signal (middle; GCaMP8f ∆F/F; rise τ = 6.2 ± 1.7 ms; decay τ = 82 ± 6.7 ms; 7 animals) and wingbeat frequency changes after MN spiking (bottom; latency = 7.3 ± 1.3 ms; decay τ = 83 ± 27 ms; 7 animals) follow similar slower time courses. c, DLM6 calcium responses to different MN5 firing frequencies (Supplementary Video 4). d, As each DLM fibre is innervated by one MN, splayed-out firing must result in time-shifted calcium responses (top), but synchronous MN firing results in time-locked calcium responses across fibres (bottom). The resulting average myoplasmic calcium levels across all fibres is considerably larger for synchronous (bottom panel, bottom trace) compared with for splayed-out firing (top panel, bottom trace). e, As a result, during flight, splayed-out firing is accompanied by small transient fluctuations in wingbeat frequency (blue; n = 7 animals) but synchronous firing is accompanied by significantly (P = 0.0010, two-sided unpaired t-test) larger fluctuations with a latency of around 7 ms after each MN spike (green; n = 7 animals).
Fig. 4 Splayed-out firing ensures stable wingbeat power. a, Representative traces of wingbeat and MN multiple-unit recordings during flight (7 animals in each condition). Synchronous MN firing (top, green) causes around eight times larger fluctuations in wingbeat frequency (bottom, green) compared with splayed-out firing (blue). b, DLM fibre voltage response to one MN spike is fast (top; decay τfast ~ 1.7 ms, τslow ~14 ms; 3 animals). Both the resulting myoplasmic calcium signal (middle; GCaMP8f ∆F/F; rise τ = 6.2 ± 1.7 ms; decay τ = 82 ± 6.7 ms; 7 animals) and wingbeat frequency changes after MN spiking (bottom; latency = 7.3 ± 1.3 ms; decay τ = 83 ± 27 ms; 7 animals) follow similar slower time courses. c, DLM6 calcium responses to different MN5 firing frequencies (Supplementary Video 4). d, As each DLM fibre is innervated by one MN, splayed-out firing must result in time-shifted calcium responses (top), but synchronous MN firing results in time-locked calcium responses across fibres (bottom). The resulting average myoplasmic calcium levels across all fibres is considerably larger for synchronous (bottom panel, bottom trace) compared with for splayed-out firing (top panel, bottom trace). e, As a result, during flight, splayed-out firing is accompanied by small transient fluctuations in wingbeat frequency (blue; n = 7 animals) but synchronous firing is accompanied by significantly (P = 0.0010, two-sided unpaired t-test) larger fluctuations with a latency of around 7 ms after each MN spike (green; n = 7 animals).CC BY · PubMed Central
Extended Data Fig. 1 Firing phase relationships of MN1–5 pairs are conserved between individuals. For three individual male flies (a–c) all 10 possible pairwise combinations of the DLM-MNs (MN1–5) are plotted as cumulative phase histograms from simultaneous recordings of MN1–5 during 10 min of continuous tethered flight (equalling approximately 3000 spikes of each MN). Starting with the MN1/MN2 pair on the upper left, (a1-c1), for each MN pair, the interspike intervals between two consecutive spikes of one MN were divided into 100 equally sized bins (x-axis), and it was determined in which bin the spike of the other MN occurred. This was repeated as sliding window for all interspike intervals to fill the bins cumulatively. Cumulative spike counts in each bin were normalized to total spike count (y-axis). In all three individuals (a–c) different MN pairs show different phase relationships, but the same pairs show similar phase relationships across individuals. The phase histograms of all MN pairs show a characteristic gap around phases zero and 1, indicating preferred out-of-phase firing. Apart from this characteristic gap, phase relations are not highly precise, so that some distributions are broad. This is owed to multiple preferred MN1–5 firing sequences (splay states) occurring within one flight bout (see Fig. 1 in the main text). (d) compares phase histograms restricted to one splay state and with changing splay states (both from the same animal and 1 min of flight). Histograms restricted to one splay state show a much narrower phase relation and no synchronous spikes at phases 0 or 1.
Extended Data Fig. 1 Firing phase relationships of MN1–5 pairs are conserved between individuals. For three individual male flies (a–c) all 10 possible pairwise combinations of the DLM-MNs (MN1–5) are plotted as cumulative phase histograms from simultaneous recordings of MN1–5 during 10 min of continuous tethered flight (equalling approximately 3000 spikes of each MN). Starting with the MN1/MN2 pair on the upper left, (a1-c1), for each MN pair, the interspike intervals between two consecutive spikes of one MN were divided into 100 equally sized bins (x-axis), and it was determined in which bin the spike of the other MN occurred. This was repeated as sliding window for all interspike intervals to fill the bins cumulatively. Cumulative spike counts in each bin were normalized to total spike count (y-axis). In all three individuals (a–c) different MN pairs show different phase relationships, but the same pairs show similar phase relationships across individuals. The phase histograms of all MN pairs show a characteristic gap around phases zero and 1, indicating preferred out-of-phase firing. Apart from this characteristic gap, phase relations are not highly precise, so that some distributions are broad. This is owed to multiple preferred MN1–5 firing sequences (splay states) occurring within one flight bout (see Fig. 1 in the main text). (d) compares phase histograms restricted to one splay state and with changing splay states (both from the same animal and 1 min of flight). Histograms restricted to one splay state show a much narrower phase relation and no synchronous spikes at phases 0 or 1.CC BY · PubMed Central
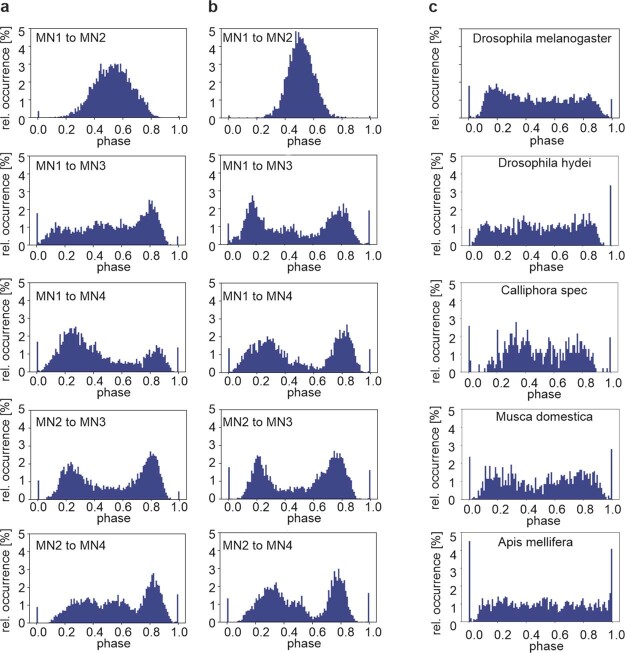
Extended Data Fig. 2 Phase relations between MN1–5 are conserved across species. In all tested flying insect species, the dorsal longitudinal wing depressor muscles (DLM) consists of 6 muscle fibres, each of which is innervated by one MN, namely MN1–5 (for schematic see Fig. 1a). In Drosophila melanogaster each of the 10 MN1–5 pairs shows characteristic phase relationships in their firing patterns (see Fig. 1 in the main text, Extended Data Fig. 1). Analyses of in vivo recordings during tethered flight reveals highly similar firing phase relationships of different MN pairs in Drosophila melanogaster (a) and in the goldfly, Lucilia spec (b), a related dipteran species. (c) In vivo recordings of the MN4-MN5 pair shows similar firing phase relationships between the fruit fly Drosophila melanogaster (top), another Drosophilidae (Drosophila hydei, second from top), two additional dipteran species (the blowfly Calliphora spec., third from top; and the house fly, Musca domestica, second from bottom). Some characteristics of the phase relationships observed in all dipteran species tested (top 4 panels) are also observed in a hymenopteran species, the honey bee Apis mellifera (bottom). There the characteristic inhibition of MN4 firing just after MN5 spikes is recapitulated, but the depression of MN4 firing just before MN5 spikes is not.
Extended Data Fig. 2 Phase relations between MN1–5 are conserved across species. In all tested flying insect species, the dorsal longitudinal wing depressor muscles (DLM) consists of 6 muscle fibres, each of which is innervated by one MN, namely MN1–5 (for schematic see Fig. 1a). In Drosophila melanogaster each of the 10 MN1–5 pairs shows characteristic phase relationships in their firing patterns (see Fig. 1 in the main text, Extended Data Fig. 1). Analyses of in vivo recordings during tethered flight reveals highly similar firing phase relationships of different MN pairs in Drosophila melanogaster (a) and in the goldfly, Lucilia spec (b), a related dipteran species. (c) In vivo recordings of the MN4-MN5 pair shows similar firing phase relationships between the fruit fly Drosophila melanogaster (top), another Drosophilidae (Drosophila hydei, second from top), two additional dipteran species (the blowfly Calliphora spec., third from top; and the house fly, Musca domestica, second from bottom). Some characteristics of the phase relationships observed in all dipteran species tested (top 4 panels) are also observed in a hymenopteran species, the honey bee Apis mellifera (bottom). There the characteristic inhibition of MN4 firing just after MN5 spikes is recapitulated, but the depression of MN4 firing just before MN5 spikes is not.CC BY · PubMed Central
Extended Data Fig. 3 Unpatterned excitatory input scales up CPG output without affecting the pattern. (a) Representative recordings of MN4 (arrow, smaller unit) and MN5 (arrow, large unit) with one tungsten electrode during tethered flight and blue light stimulation in a fly with expression of UAS-Channelrhodopsin in cholinergic neurons (Chat-GAL4xUAS-XXL-ChR, second from bottom; 11 replicate animals) and in a control fly (Chat-GAL4x w1118, bottom trace; 3 replicate animals). Blue bars indicate the timing of blue light stimulation. Upper three traces show the instantaneous wingbeat frequency (top trace) and the instantaneous firing frequencies of MN5 and MN4 upon optogenetic activation of presynaptic cholinergic neurons. (ai, left) Quantification from 11 animals with expression of UAS-ChR in cholinergic neurons reveals that the firing frequencies of MN4 and MN5 are increased significantly and to the same degree during optogenetic stimulation (blue circles) as compared to before light stimulation (green circles). By contrast, in controls (Chat-GAL4 x w1118; n = 3) light stimulation has no effect. (ai, right) Average firing frequency increases in MN4 and MN5 (black dots) but not in controls (grey dots, horizontal bars depict means, error bars the SDs). (aii) Consequently, wingbeat frequency is significantly increased upon optogenetic activation of cholinergic neurons (11 animals, horizontal bar depicts mean, error bars the SD), but not upon light stimulation in controls (3 animals). (b) The typical phase relationship of MN4 and MN5 firing that is observed in controls (Fig. 2a,b in the main text, Extended Data Fig. 1) and prior to optogenetic stimulation (left) remains unaltered upon increasing CPG output by unpatterned stimulation of presynaptic cholinergic interneurons (right). Coloured bars represent the average values from 11 animals and grey bars the SD.
Extended Data Fig. 3 Unpatterned excitatory input scales up CPG output without affecting the pattern. (a) Representative recordings of MN4 (arrow, smaller unit) and MN5 (arrow, large unit) with one tungsten electrode during tethered flight and blue light stimulation in a fly with expression of UAS-Channelrhodopsin in cholinergic neurons (Chat-GAL4xUAS-XXL-ChR, second from bottom; 11 replicate animals) and in a control fly (Chat-GAL4x w1118, bottom trace; 3 replicate animals). Blue bars indicate the timing of blue light stimulation. Upper three traces show the instantaneous wingbeat frequency (top trace) and the instantaneous firing frequencies of MN5 and MN4 upon optogenetic activation of presynaptic cholinergic neurons. (ai, left) Quantification from 11 animals with expression of UAS-ChR in cholinergic neurons reveals that the firing frequencies of MN4 and MN5 are increased significantly and to the same degree during optogenetic stimulation (blue circles) as compared to before light stimulation (green circles). By contrast, in controls (Chat-GAL4 x w1118; n = 3) light stimulation has no effect. (ai, right) Average firing frequency increases in MN4 and MN5 (black dots) but not in controls (grey dots, horizontal bars depict means, error bars the SDs). (aii) Consequently, wingbeat frequency is significantly increased upon optogenetic activation of cholinergic neurons (11 animals, horizontal bar depicts mean, error bars the SD), but not upon light stimulation in controls (3 animals). (b) The typical phase relationship of MN4 and MN5 firing that is observed in controls (Fig. 2a,b in the main text, Extended Data Fig. 1) and prior to optogenetic stimulation (left) remains unaltered upon increasing CPG output by unpatterned stimulation of presynaptic cholinergic interneurons (right). Coloured bars represent the average values from 11 animals and grey bars the SD.CC BY · PubMed Central
Extended Data Fig. 4 MN1–5 receive common excitatory cholinergic input and control wingbeat rate. (a) Representative confocal projection view (5 replicate animals) of the VNC flight motor neuropil in an animal with expression of UAS-CD4 td tomato (magenta) and one half of split-GFP (UAS-CD4-spGFP11) under the control of GAL4 in DLM-MNs (driven with GMRH2306-ADZ attP40; GMR30A07-DBD attP2, see also Extended Data Fig. 5a,b for expression patterns with UAS-GFP). The other half of split-GFP (spGFP1-10) is coupled to the synaptic vesicle protein synaptobrevin (nSyb) and driven under the control of LexA in cholinergic neurons (ChaT-LexA x lexAop-nSyb-spGFP1-10). GFP reconstitution across synaptic partners (GRASP) occurs upon release of synaptic vesicles from cholinergic neurons and results in GFP fluorescence at the sites where nSyb- spGFP1-10 is released in direct proximity of MN1–5 dendritic membrane with expression of CD4-spGFP11 (green). (b) Selective enlargement of synaptic activity dependent GRASP signal (green) at contacts between ChaT positive cholinergic neurons and td tomato expressing MN dendrites (magenta) indicates direct synaptic inputs from cholinergic neurons to MN1–5. (c) Dual current clamp recording from 2 MNs (here MN3 and MN4) show highly similar patterns of PSPs, providing direct evidence for shared synaptic input (representative traces from 1 animal, 4 replicate animals). (d) Representative example for similar changes in firing frequency of MN1–5 indicates shared synaptic drive (8 replicate animals). (e) Wingbeat frequencies and MN1–5 firing frequencies are calculated for 1-second bins within flight. Flight starts and stops are omitted to avoid trivial correlations. The correlation between MN1–5 firing frequency and wingbeat frequency is moderate across animals, though significant (two-sided Pearson correlation coefficient r = 0.31, p < 0.0001). (f) In the same animal, changes in MN1–5 (ΔMN) and wingbeat frequency (Δwb, comparing consecutive 1-second bins) show a stronger correlation (Pearson r = 0.6, p < 0.0001). (g) The ΔMN/Δwb correlation is also stronger across animals.
Extended Data Fig. 4 MN1–5 receive common excitatory cholinergic input and control wingbeat rate. (a) Representative confocal projection view (5 replicate animals) of the VNC flight motor neuropil in an animal with expression of UAS-CD4 td tomato (magenta) and one half of split-GFP (UAS-CD4-spGFP11) under the control of GAL4 in DLM-MNs (driven with GMRH2306-ADZ attP40; GMR30A07-DBD attP2, see also Extended Data Fig. 5a,b for expression patterns with UAS-GFP). The other half of split-GFP (spGFP1-10) is coupled to the synaptic vesicle protein synaptobrevin (nSyb) and driven under the control of LexA in cholinergic neurons (ChaT-LexA x lexAop-nSyb-spGFP1-10). GFP reconstitution across synaptic partners (GRASP) occurs upon release of synaptic vesicles from cholinergic neurons and results in GFP fluorescence at the sites where nSyb- spGFP1-10 is released in direct proximity of MN1–5 dendritic membrane with expression of CD4-spGFP11 (green). (b) Selective enlargement of synaptic activity dependent GRASP signal (green) at contacts between ChaT positive cholinergic neurons and td tomato expressing MN dendrites (magenta) indicates direct synaptic inputs from cholinergic neurons to MN1–5. (c) Dual current clamp recording from 2 MNs (here MN3 and MN4) show highly similar patterns of PSPs, providing direct evidence for shared synaptic input (representative traces from 1 animal, 4 replicate animals). (d) Representative example for similar changes in firing frequency of MN1–5 indicates shared synaptic drive (8 replicate animals). (e) Wingbeat frequencies and MN1–5 firing frequencies are calculated for 1-second bins within flight. Flight starts and stops are omitted to avoid trivial correlations. The correlation between MN1–5 firing frequency and wingbeat frequency is moderate across animals, though significant (two-sided Pearson correlation coefficient r = 0.31, p < 0.0001). (f) In the same animal, changes in MN1–5 (ΔMN) and wingbeat frequency (Δwb, comparing consecutive 1-second bins) show a stronger correlation (Pearson r = 0.6, p < 0.0001). (g) The ΔMN/Δwb correlation is also stronger across animals.CC BY · PubMed Central
Extended Data Fig. 5 Unpatterned optogenetic activation of MN1–5 during flight scales up CPG output without affecting the pattern. (a) Representative projection views of confocal image stacks (5 replicate animals) as overview of the entire ventral nerve cord (VNC, outlined by dotted line) and (b) as selective enlargement of the pterothoracic VNC with a expression of UAS-CD4-td::GFP under the control of DLM MN Split-GAL4 (GMR23H06-ADZ attP49; GMR30A07-DBD attP2). The VNC midline is indicated by a dotted white line, MN1-4 somata are labelled by white arrows on both sides of the VNC. MN5 somata (white arrows) are located closer to the midline and partially obscured by MN1–5 dendrites in the flight motor neuropil. The only other signals detected are due to autofluorescence from cuticular structures. (c,d) Optogenetic activation of MN1–5 during flight. (c) The bottom trace shows a representative recording of MN4 (arrow, smaller unit) and MN5 (arrow, large unit) with one tungsten electrode during tethered flight. Timing of unpatterned optogenetic activation of MN1–5 is indicated by a blue line. Upper three traces show the instantaneous wingbeat frequency (top trace) and the instantaneous firing frequencies of MN5 and MN4 (7 replicate animals). (d) Quantification shows that optogenetic activation increases the firing frequencies of both MNs significantly and to the same degree (horizontal bar depicts mean, error bars the SD). (di) Consequently, wingbeat frequency is increased significantly (n = 7 animals, horizontal bar depicts mean, error bars the SD). (e) The typical phase relationship of MN4 and MN5 firing that is observed in controls (Fig. 2a, Extended Data Fig. 1) and prior to optogenetic stimulation (left) remains unaltered upon increasing CPG output by unpatterned stimulation the MN1–5 (right). Coloured bars represent the average values from 7 animals and grey bars the s.e.m.
Extended Data Fig. 5 Unpatterned optogenetic activation of MN1–5 during flight scales up CPG output without affecting the pattern. (a) Representative projection views of confocal image stacks (5 replicate animals) as overview of the entire ventral nerve cord (VNC, outlined by dotted line) and (b) as selective enlargement of the pterothoracic VNC with a expression of UAS-CD4-td::GFP under the control of DLM MN Split-GAL4 (GMR23H06-ADZ attP49; GMR30A07-DBD attP2). The VNC midline is indicated by a dotted white line, MN1-4 somata are labelled by white arrows on both sides of the VNC. MN5 somata (white arrows) are located closer to the midline and partially obscured by MN1–5 dendrites in the flight motor neuropil. The only other signals detected are due to autofluorescence from cuticular structures. (c,d) Optogenetic activation of MN1–5 during flight. (c) The bottom trace shows a representative recording of MN4 (arrow, smaller unit) and MN5 (arrow, large unit) with one tungsten electrode during tethered flight. Timing of unpatterned optogenetic activation of MN1–5 is indicated by a blue line. Upper three traces show the instantaneous wingbeat frequency (top trace) and the instantaneous firing frequencies of MN5 and MN4 (7 replicate animals). (d) Quantification shows that optogenetic activation increases the firing frequencies of both MNs significantly and to the same degree (horizontal bar depicts mean, error bars the SD). (di) Consequently, wingbeat frequency is increased significantly (n = 7 animals, horizontal bar depicts mean, error bars the SD). (e) The typical phase relationship of MN4 and MN5 firing that is observed in controls (Fig. 2a, Extended Data Fig. 1) and prior to optogenetic stimulation (left) remains unaltered upon increasing CPG output by unpatterned stimulation the MN1–5 (right). Coloured bars represent the average values from 7 animals and grey bars the s.e.m.CC BY · PubMed Central
Extended Data Fig. 6 Dip around zero in phase histograms is an appropriate indicator for splayness and not affected by inhibitory chemical synapses. (a) Phase histograms for simulated MN1–5 with homogeneous coupling (occ [%] is the percentage of events in each phase bin). All-to-all rather than single-pair histograms are chosen to mitigate initial condition effects for finite run times. For low noise 4 peaks correspond to the 4 phase relations in a perfect splay state. With increasing noise, the dip around zero is more persistent than the subsequent dips. (b) Similar all-to-all phase histogram for an example experimental control. (c) Washing out of the dip around zero corresponds to decreased network splayness (y-axis, splayness index). For comparison, mean and standard deviation of experimentally measured control and Canton-S flies are shown (n = 8 animals). (d) For MN4-5 histograms the dip around zero is quantified using the fraction that falls within (−0.1,0.1). This fraction is negatively correlated to full network splayness in both simulated (considering all simulations from Fig. 3d,h) and experimental data where all 5 neurons were available (Canton-S, experimental control (GMR23H06-ADZ attP49;GMR30A07-DBD attP2 > P{UAS-GFP.VALIUM10}attP2), ShakB RNAi-kd (GMR23H06-ADZ attP49;GMR30A07-DBD attP2 > P{TRiP.HMC04895}attP2)). For the experimental data, a two-sided Pearson correlation determined a strong negative correlation (r = −0.94, p < 0.0001, n = 10). (e,f) Firing phase relationships between MN4 and MN5 in control animals (see also Fig. 2a,b, Extended Data Fig. 1) remain similar upon UAS-RNAi knockdown of receptors for inhibitory chemical synapses in MN1–5 (under the control of DLM-MN spilt-GAL4, GMR23H06-ADZ attP49; GMR30A07-DBD attP2), (e) the glutamate gated chloride channel (GluCl) and (f) Rdl GABA-ARs. GluCl-RNAi knockdown efficacy was confirmed by Western blotting and Rdl GABA-AR knockdown efficacy has previously been confirmed64. Coloured bars represent the average values from 10 animals for GluCl-RNAi, 8 animals for Rdl GABA-AR-RNAi, and grey bars the s.e.m.
Extended Data Fig. 6 Dip around zero in phase histograms is an appropriate indicator for splayness and not affected by inhibitory chemical synapses. (a) Phase histograms for simulated MN1–5 with homogeneous coupling (occ [%] is the percentage of events in each phase bin). All-to-all rather than single-pair histograms are chosen to mitigate initial condition effects for finite run times. For low noise 4 peaks correspond to the 4 phase relations in a perfect splay state. With increasing noise, the dip around zero is more persistent than the subsequent dips. (b) Similar all-to-all phase histogram for an example experimental control. (c) Washing out of the dip around zero corresponds to decreased network splayness (y-axis, splayness index). For comparison, mean and standard deviation of experimentally measured control and Canton-S flies are shown (n = 8 animals). (d) For MN4-5 histograms the dip around zero is quantified using the fraction that falls within (−0.1,0.1). This fraction is negatively correlated to full network splayness in both simulated (considering all simulations from Fig. 3d,h) and experimental data where all 5 neurons were available (Canton-S, experimental control (GMR23H06-ADZ attP49;GMR30A07-DBD attP2 > P{UAS-GFP.VALIUM10}attP2), ShakB RNAi-kd (GMR23H06-ADZ attP49;GMR30A07-DBD attP2 > P{TRiP.HMC04895}attP2)). For the experimental data, a two-sided Pearson correlation determined a strong negative correlation (r = −0.94, p < 0.0001, n = 10). (e,f) Firing phase relationships between MN4 and MN5 in control animals (see also Fig. 2a,b, Extended Data Fig. 1) remain similar upon UAS-RNAi knockdown of receptors for inhibitory chemical synapses in MN1–5 (under the control of DLM-MN spilt-GAL4, GMR23H06-ADZ attP49; GMR30A07-DBD attP2), (e) the glutamate gated chloride channel (GluCl) and (f) Rdl GABA-ARs. GluCl-RNAi knockdown efficacy was confirmed by Western blotting and Rdl GABA-AR knockdown efficacy has previously been confirmed64. Coloured bars represent the average values from 10 animals for GluCl-RNAi, 8 animals for Rdl GABA-AR-RNAi, and grey bars the s.e.m.CC BY · PubMed Central
Extended Data Fig. 7 No detection of output synapses from MN1–5 in the ventral nerve cord (VNC). (a) Representative (from 4 replicate animals) trans-synaptic labelling of postsynaptic partners (a, aii magenta) of LC visual interneurons (a, ai, green) in the adult fly brain with Trans-Tango65. (b) Representative (from 4 replicate animals) trans-synaptic labelling of postsynaptic partners (b, bii magenta) of period interneurons in the adult VNC (b, bi, green). (c) By contrast trans-synaptic labelling with Trans-Tango reveals no postsynaptic partners (c, cii, magenta) of MN1–5 (c, ci, green) in the adult fly VNC (6 replicate animals). (d) Expression of Brp-short (w;23H06-ADZ UAS-Brp.Sstraw-D3/+;30A07-DBD/+;) tagged with strawberry in MN1–5 (4 replicate animals) causes Brp-short strawberry puncta in the MN1–5 somata, where the protein is produced, but not in any central arbours (d, di, dii, MN1–5 green, Brp short magenta). By contrast, in the same preparation, Brp-short puncta (white arrows) localize to presynaptic active zones at MN axon terminals at the neuromuscular junction (e, ei, eii, MN1–5 green, Brp short magenta).
Extended Data Fig. 7 No detection of output synapses from MN1–5 in the ventral nerve cord (VNC). (a) Representative (from 4 replicate animals) trans-synaptic labelling of postsynaptic partners (a, aii magenta) of LC visual interneurons (a, ai, green) in the adult fly brain with Trans-Tango65. (b) Representative (from 4 replicate animals) trans-synaptic labelling of postsynaptic partners (b, bii magenta) of period interneurons in the adult VNC (b, bi, green). (c) By contrast trans-synaptic labelling with Trans-Tango reveals no postsynaptic partners (c, cii, magenta) of MN1–5 (c, ci, green) in the adult fly VNC (6 replicate animals). (d) Expression of Brp-short (w;23H06-ADZ UAS-Brp.Sstraw-D3/+;30A07-DBD/+;) tagged with strawberry in MN1–5 (4 replicate animals) causes Brp-short strawberry puncta in the MN1–5 somata, where the protein is produced, but not in any central arbours (d, di, dii, MN1–5 green, Brp short magenta). By contrast, in the same preparation, Brp-short puncta (white arrows) localize to presynaptic active zones at MN axon terminals at the neuromuscular junction (e, ei, eii, MN1–5 green, Brp short magenta).CC BY · PubMed Central
Extended Data Fig. 8 MN1–5 firing phase relationships require gap junctions (GJs) between MNs. For three individual male Drosophila melanogaster flies with targeted expression of RNAi knockdown for ShakB in MN1–5 (a–c) all 10 possible pairwise combinations of the MN1–5 are plotted as cumulative phase histograms from simultaneous recordings of MN1–5 during 10 min of continuous tethered flight (equalling approximately 3000 spikes of each MN). Starting with the MN1-MN2 pair on the upper left, (a1-c1), for each MN pair, the interspike intervals between two consecutive MN spikes was normalized and divided into 100 equally sized bins (x-axis). Next it was determined in which bin the spike of the other MN occurred. This was repeated as sliding window for all interspike intervals and bins were filled cumulatively and normalized to total spike count (y-axis). In all three individuals with knockdown for ShakB mediated GJs in MN1–5 (a–c) the phase relationships that are characteristic for each MN pair in control flies (see Extended Data Fig. 1) and conserved across dipteran species (see Extended Data Fig. 2) are impaired.
Extended Data Fig. 8 MN1–5 firing phase relationships require gap junctions (GJs) between MNs. For three individual male Drosophila melanogaster flies with targeted expression of RNAi knockdown for ShakB in MN1–5 (a–c) all 10 possible pairwise combinations of the MN1–5 are plotted as cumulative phase histograms from simultaneous recordings of MN1–5 during 10 min of continuous tethered flight (equalling approximately 3000 spikes of each MN). Starting with the MN1-MN2 pair on the upper left, (a1-c1), for each MN pair, the interspike intervals between two consecutive MN spikes was normalized and divided into 100 equally sized bins (x-axis). Next it was determined in which bin the spike of the other MN occurred. This was repeated as sliding window for all interspike intervals and bins were filled cumulatively and normalized to total spike count (y-axis). In all three individuals with knockdown for ShakB mediated GJs in MN1–5 (a–c) the phase relationships that are characteristic for each MN pair in control flies (see Extended Data Fig. 1) and conserved across dipteran species (see Extended Data Fig. 2) are impaired.CC BY · PubMed Central
Extended Data Fig. 9 Motoneuron model analysis and phase-reduced view on coupling. (a) Codim-2 bifurcation diagram of the motoneuron model with focus on global bifurcations that switch the PRC shape with changing Shab levels (y-axis, gshab). Small and big saddle-node loop (sSNS, bSNL) encapsulate the SNIC interval, where spiking (grey area) commences after a saddle-node bifurcation (blue line) on a limit cycle. Saddle Homoclinic loop (HOM) line is green. The Andronov-Hopf bifurcation (AH, red line), ends in a Bogdanov-Takens (BT) point. At the cusp (CP) the neuron model switches from 3 to 1 fixpoints. The three PRCs (insets, right) show distinct symmetry properties. (b) Simplified illustration how asymmetric PRC components induce stable phase relations. With spike shapes in the form of delta functions, the odd parts of the PRC and of the coupling function have the same shape. The mean PRC component is absorbed into the average firing rate and plotted is only the PRC’s odd part (grey). Upon perturbations (arrows) PRCs with phase-advance in the ISI’s first half and phase-delay in the second half cause anti-phase synchronization (top), while the reverse causes in-phase synchronization (bottom). (c) Iterated maps (cobweb plots) illustrate the qualitative behaviour of phase differences. Starting at a random phase difference, ψn, a vertical arrow is drawn from the diagonal to the function curve, constituting the new phase, ψn+1, after a perturbation. From this point a horizontal arrow is drawn back to the diagonal, such that ψn is substituted by ψn+1. Repeating these two steps, the system converges to stable fixpoints in phase differences (according to equation (3); Methods). In the case of a PRC with phase-advance in the ISI’s first half and phase-delay in the second half (left), the fix point is ψ = 0.5, while for the reverse case (right) the fix point is ψ = 0.
Extended Data Fig. 9 Motoneuron model analysis and phase-reduced view on coupling. (a) Codim-2 bifurcation diagram of the motoneuron model with focus on global bifurcations that switch the PRC shape with changing Shab levels (y-axis, gshab). Small and big saddle-node loop (sSNS, bSNL) encapsulate the SNIC interval, where spiking (grey area) commences after a saddle-node bifurcation (blue line) on a limit cycle. Saddle Homoclinic loop (HOM) line is green. The Andronov-Hopf bifurcation (AH, red line), ends in a Bogdanov-Takens (BT) point. At the cusp (CP) the neuron model switches from 3 to 1 fixpoints. The three PRCs (insets, right) show distinct symmetry properties. (b) Simplified illustration how asymmetric PRC components induce stable phase relations. With spike shapes in the form of delta functions, the odd parts of the PRC and of the coupling function have the same shape. The mean PRC component is absorbed into the average firing rate and plotted is only the PRC’s odd part (grey). Upon perturbations (arrows) PRCs with phase-advance in the ISI’s first half and phase-delay in the second half cause anti-phase synchronization (top), while the reverse causes in-phase synchronization (bottom). (c) Iterated maps (cobweb plots) illustrate the qualitative behaviour of phase differences. Starting at a random phase difference, ψn, a vertical arrow is drawn from the diagonal to the function curve, constituting the new phase, ψn+1, after a perturbation. From this point a horizontal arrow is drawn back to the diagonal, such that ψn is substituted by ψn+1. Repeating these two steps, the system converges to stable fixpoints in phase differences (according to equation (3); Methods). In the case of a PRC with phase-advance in the ISI’s first half and phase-delay in the second half (left), the fix point is ψ = 0.5, while for the reverse case (right) the fix point is ψ = 0.CC BY · PubMed Central
Extended Data Fig. 10 Shab constitutes 50% of the delayed rectifier current in MN1–5. (a) Outward current as measured in control MNs in TTX containing (10−7 M) calcium free saline by applying command voltage steps from a holding potential of −20 mV down to −60 mV and up to +50 mV in 10 mV increments (top traces). Same recording in 100 µM quinidine (middle). Bottom traces show the quinidine-sensitive Shab current by subtraction of the top minus the middle traces. (b) Same experiment but following Shab RNAi-kd (Shab-kd) in MN1–5. (c) Same experiment but following UAS-Shab overexpression (Shab-oe) in MN1–5. (d) Quantification of total delayed rectifier (DR) outward current (top), quinidine insensitive, non-Shab DR current (middle), and Shab DR current (bottom) in control (black, 6 replicate animals), with Shab-RNAi (blue, 11 replicate animals), and following Shab-overexpression in MN1–5 (red, 7 replicate animals, 5 for isolated Shab and non Shab current). In control, Shab constitutes ~50% of the DR current. Shab-RNAi significantly reduces Shab current by ~70% (ANOVA with Tukey’s posthoc comparison, p = 0.0016), but does not affect quinidine insensitive non Shab current (ANOVA with Tukey’s posthoc comparison, p = 0.8215) or total DR current (ANOVA with Tukey’s posthoc comparison, p = 0.0608). Shab overexpression significantly increases Shab current amplitude (ANOVA with Tukey’s posthoc comparison, p = 0.0029), significantly increases total DR current (ANOVA with Tukey’s posthoc comparison, p = 0.0010), but non Shab DR current remains unaffected (ANOVA with Tukey’s posthoc comparison, p = 0.6291).
Extended Data Fig. 10 Shab constitutes 50% of the delayed rectifier current in MN1–5. (a) Outward current as measured in control MNs in TTX containing (10−7 M) calcium free saline by applying command voltage steps from a holding potential of −20 mV down to −60 mV and up to +50 mV in 10 mV increments (top traces). Same recording in 100 µM quinidine (middle). Bottom traces show the quinidine-sensitive Shab current by subtraction of the top minus the middle traces. (b) Same experiment but following Shab RNAi-kd (Shab-kd) in MN1–5. (c) Same experiment but following UAS-Shab overexpression (Shab-oe) in MN1–5. (d) Quantification of total delayed rectifier (DR) outward current (top), quinidine insensitive, non-Shab DR current (middle), and Shab DR current (bottom) in control (black, 6 replicate animals), with Shab-RNAi (blue, 11 replicate animals), and following Shab-overexpression in MN1–5 (red, 7 replicate animals, 5 for isolated Shab and non Shab current). In control, Shab constitutes ~50% of the DR current. Shab-RNAi significantly reduces Shab current by ~70% (ANOVA with Tukey’s posthoc comparison, p = 0.0016), but does not affect quinidine insensitive non Shab current (ANOVA with Tukey’s posthoc comparison, p = 0.8215) or total DR current (ANOVA with Tukey’s posthoc comparison, p = 0.0608). Shab overexpression significantly increases Shab current amplitude (ANOVA with Tukey’s posthoc comparison, p = 0.0029), significantly increases total DR current (ANOVA with Tukey’s posthoc comparison, p = 0.0010), but non Shab DR current remains unaffected (ANOVA with Tukey’s posthoc comparison, p = 0.6291).CC BY · PubMed Central

Verification

Claims the paper makes

The claims and statistics of this paper haven’t been checked yet.

Free: it reads the open-access text and checks the first 5 claims that cite a source we can check. Create a free account to check every claim.

A few free checks a day · papers already verified open instantly · results are public

Claims other papers make about this one

Each is checked against this paper’s own text: does it say what the citing paper says it does?

Self-check

Percentages, sums and reported differences re-computed from the paper’s own numbers.

The self-check needs the paper’s full text.

Citations

Cites

Show all 65 references

Research works printed but not linked: 1

  1. Duch, C., Bayline, R. J. & Levine, R. B. Postembryonic development of the dorsal longitudinal flight muscle and its innervation in Manduca sexta. J. Comp. Neurol. 422, 1–17 (2000). · DOI · Paper page

Cited by

See all 68

Metadata

Authors
Hürkey, S., Niemeyer, N., Schleimer, J.-H., Ryglewski, S., Schreiber, S., & Duch, C.
Affiliations
  • Johannes Gutenberg University Mainz (DE)
  • Humboldt-Universität zu Berlin (DE)
Corresponding author
  • Schreiber, Susanne
  • Duch, Carsten
Venue
Nature
Published
2023-05-24
Volume
618
Issue
7963
Pages
118-125
ISSN
  • 0028-0836 (ISSN-L)
  • 1476-4687
OpenAlex
W4378070410
Cited by
64
References
63
Citations by year
2026: 13 · 2025: 26 · 2024: 23 · 2023: 2
FWCI
7.76
Type
journal article
Language
en
Open access
Licence
Locations
  • Nature (publishedVersion, cc-by)
  • PubMed Central (publishedVersion, cc-by)
  • PubMed (publishedVersion)
  • RePEc: Research Papers in Economics (submittedVersion)
  • Gutenberg Open Science (submittedVersion, cc-by-nd)
  • Gutenberg Open Science (cc-by)
Funders
  • European Commission (HORIZON2020, 864243)
  • Deutsche Forschungsgemeinschaft
  • Einstein Stiftung Berlin (EP‐2021‐621)
Topics
  • Life Sciences › Neuroscience › Cellular and Molecular Neuroscience › Neurobiology and Insect Physiology Research
  • Life Sciences › Neuroscience › Cognitive Neuroscience › Neural dynamics and brain function
  • Life Sciences › Biochemistry, Genetics and Molecular Biology › Molecular Biology › Connexins and lens biology
Keywords
gap junctions, electrical synapses, central pattern generator, insect flight, Drosophila, motor neurons, ion channels, connectomics
MeSH terms
Animals, Drosophila melanogaster, Flight, Animal, Motor Neurons, Neural Pathways, Gap Junctions, Electrical Synapses, Electrophysiological Phenomena

About these checks

Registry, retraction, Cites and statistics results are computed, not judged, with one exception: a printed reference that no index lists is read once by a model before it counts as a citation error. Claims are extracted by a model and kept only when their quote appears verbatim in the text; each cited source is then checked, with a model’s help, for whether it says what the claim relies on. Those verdicts can be wrong — read the claim’s quote and the cited source before relying on one.

Statistics and arithmetic are recomputed, not judged.

Confidence bands are shown only for fields calibrated on our annotated test set. None is calibrated yet, so no band is shown.

What counts as a claim ›How we measure confidence ›How we check this ›

Are you an author, or do you see a problem with this page? Request a review

How to cite

Cite CoChat for the checks on this page, and the paper for its own findings.

This page
CoChat. (2026). Citation check: Gap junctions desynchronize a neural circuit to stabilize insect flight. https://app.cochat.ai/papers/10.1038/s41586-023-06099-0
The paper
Hürkey, S., Niemeyer, N., Schleimer, J.-H., Ryglewski, S., Schreiber, S., & Duch, C. (2023). Gap junctions desynchronize a neural circuit to stabilize insect flight. Nature. https://doi.org/10.1038/s41586-023-06099-0

Data sources

Bibliographic data: Semantic Scholar, OpenAlex, Crossref.

Contains information from the Semantic Scholar Academic Graph Datasets, made available under the ODC Attribution License (ODC-BY 1.0).

Semantic Scholar’s data is described in: Kinney, R., et al. (2023). The Semantic Scholar Open Data Platform. arXiv:2301.10140.