Cited by 153Neuroscience and Neuropharmacology ResearchNeurobiology and Insect Physiology ResearchNeural dynamics and brain function

The DOI matches its Crossref record; 77 of the 77 references it cites were found in a registry or an index.

Neural signal propagation atlas of Caenorhabditis elegans

Open access

Abstract

. Here, to better understand the relationship between the structure and the function of a nervous system, we systematically measure signal propagation in 23,433 pairs of neurons across the head of the nematode Caenorhabditis elegans by direct optogenetic activation and simultaneous whole-brain calcium imaging. We measure the sign (excitatory or inhibitory), strength, temporal properties and causal direction of signal propagation between these neurons to create a functional atlas. We find that signal propagation differs from model predictions that are based on anatomy. Using mutants, we show that extrasynaptic signalling not visible from anatomy contributes to this difference. We identify many instances of dense-core-vesicle-dependent signalling, including on timescales of less than a second, that evoke acute calcium transients-often where no direct wired connection exists but where relevant neuropeptides and receptors are expressed. We propose that, in such cases, extrasynaptically released neuropeptides serve a similar function to that of classical neurotransmitters. Finally, our measured signal propagation atlas better predicts the neural dynamics of spontaneous activity than do models based on anatomy. We conclude that both synaptic and extrasynaptic signalling drive neural dynamics on short timescales, and that measurements of evoked signal propagation are crucial for interpreting neural function.

Overview

The claims and statistics of this paper haven’t been checked yet.

Run the check — free, no account needed. It reads the open-access text and checks the sources it cites.

A few free checks a day · papers already verified open instantly · results are public

Integrity signals

Registry

Crossref · 10.1038/s41586-023-06683-4

Cites

77 of 77 references verified0 citation errors · 0 not checkable

Statistics

Figures

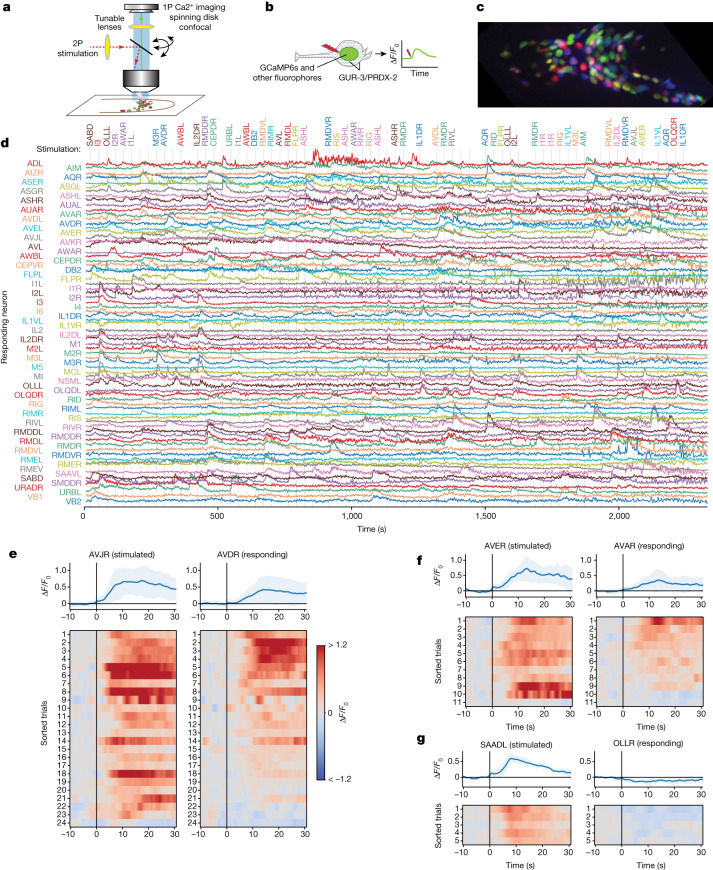
Fig. 1 Measuring neural activation and network response. a,b, Schematics of the instrument (a) and the experiment (b). c, NeuroPAL fluorophores for neural identification. d, Whole-brain cell-resolved calcium activity (GCaMP6s fluorescence normalized by noise) during stimulation of individual neurons. A stimulation was delivered once every 30 s; grey lines indicate those instances when the stimuli were delivered on-target. The targeted neurons are listed at the top. e, Paired activity of AVJR and AVDR in response to AVJR stimulation, shown as relative change (ΔF/F0). Top, mean (blue) and s.d. (shading) across trials and animals. Bottom, simultaneously recorded paired activity for individual trials (sorted by mean AVDR activity). All trials are shown that elicited activity. f, Same as e for AVER stimulation and AVAR response. g, Same as e for SAADL stimulation and OLLR response.
Fig. 1 Measuring neural activation and network response. a,b, Schematics of the instrument (a) and the experiment (b). c, NeuroPAL fluorophores for neural identification. d, Whole-brain cell-resolved calcium activity (GCaMP6s fluorescence normalized by noise) during stimulation of individual neurons. A stimulation was delivered once every 30 s; grey lines indicate those instances when the stimuli were delivered on-target. The targeted neurons are listed at the top. e, Paired activity of AVJR and AVDR in response to AVJR stimulation, shown as relative change (ΔF/F0). Top, mean (blue) and s.d. (shading) across trials and animals. Bottom, simultaneously recorded paired activity for individual trials (sorted by mean AVDR activity). All trials are shown that elicited activity. f, Same as e for AVER stimulation and AVAR response. g, Same as e for SAADL stimulation and OLLR response.CC BY · PubMed Central
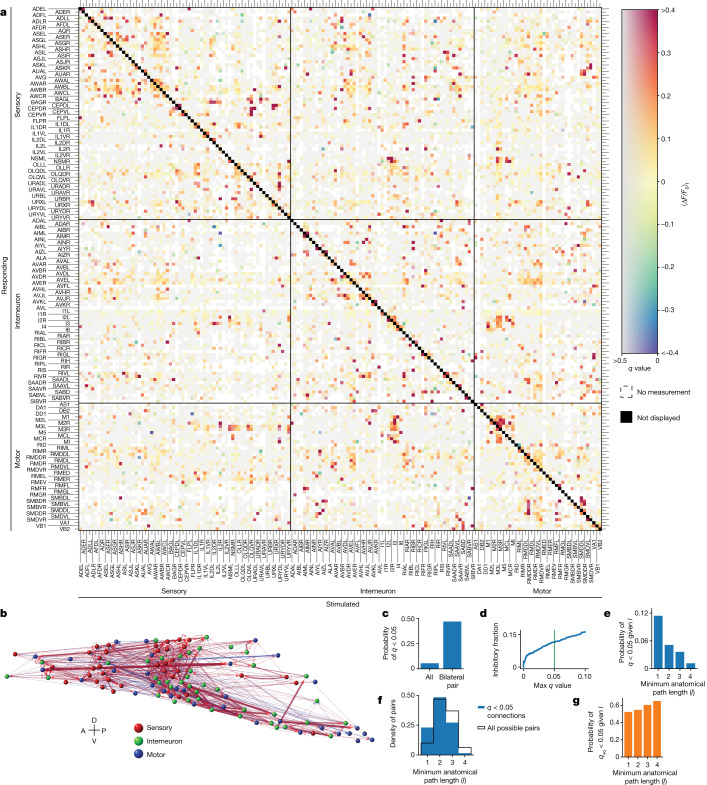
Fig. 2 Signal propagation map of C. elegans. a, Mean post-stimulus neural activity ⟨ΔF/F0⟩t averaged across trials and individuals. The q values report the false discovery rate (more grey is less significant). White indicates no measurement. An autoresponse is required for inclusion and is not shown (black diagonal). n = 113 animals. Neurons that were recorded but never stimulated are shown in Extended Data Fig. 5. b, Corresponding network graph with neurons positioned anatomically (only q < 0.05 connections). Width and transparency indicate mean response amplitude (red, excitatory; blue, inhibitory). A, anterior; D, dorsal; P, posterior; V, ventral. c, A bilaterally symmetric pair is more likely to have a q < 0.05 functional connection than is a pair chosen at random. d, Fraction of connections that are inhibitory as a function of the q-value threshold. Green indicates q < 0.05. e, Probability of being functionally connected (q < 0.05) given minimum anatomical path length l. f, Distribution of l for functionally connected pairs (blue) compared to all possible pairs (black). g, Probability of being functionally non-connected (qeq < 0.05) given l. Source Data
Fig. 2 Signal propagation map of C. elegans. a, Mean post-stimulus neural activity ⟨ΔF/F0⟩t averaged across trials and individuals. The q values report the false discovery rate (more grey is less significant). White indicates no measurement. An autoresponse is required for inclusion and is not shown (black diagonal). n = 113 animals. Neurons that were recorded but never stimulated are shown in Extended Data Fig. 5. b, Corresponding network graph with neurons positioned anatomically (only q < 0.05 connections). Width and transparency indicate mean response amplitude (red, excitatory; blue, inhibitory). A, anterior; D, dorsal; P, posterior; V, ventral. c, A bilaterally symmetric pair is more likely to have a q < 0.05 functional connection than is a pair chosen at random. d, Fraction of connections that are inhibitory as a function of the q-value threshold. Green indicates q < 0.05. e, Probability of being functionally connected (q < 0.05) given minimum anatomical path length l. f, Distribution of l for functionally connected pairs (blue) compared to all possible pairs (black). g, Probability of being functionally non-connected (qeq < 0.05) given l. Source DataCC BY · PubMed Central
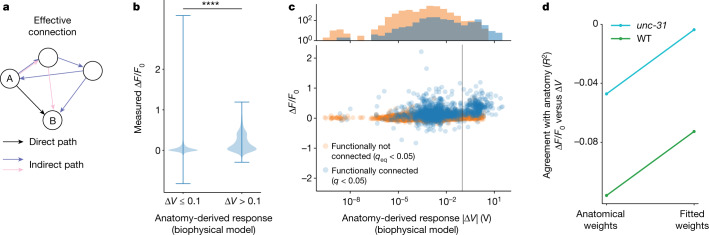
Fig. 3 Functional measurements differ from anatomy-based predictions. a, Signals propagate along all paths, including indirect and recursive (coloured). Anatomical descriptions such as synapse count describe only direct paths (black). Connectome-constrained simulations are therefore used to predict signal propagation from anatomy. b, Pairs predicted from anatomy to have large downstream responses (ΔV > 0.1 V, n = 23, 454 pairs) tend to have stronger measured responses (larger ΔF/F0) than do those predicted to have small responses (ΔV < 0.1 V, n = 614 pairs). **** indicates P = 10−88, one-sided Kolmogorov–Smirnov test; whiskers indicate range. c, Bottom, measured downstream response (ΔF/F) versus anatomy-derived response (ΔV) for pairs that we observe to be functionally connected (q < 0.05, blue) and functionally non-connected (qeq < 0.05, orange). Vertical grey line is (0.1 V) for comparison with b. Top, marginal distributions (y axis is log scale). Measured functionally connected pairs are enriched for predicted ΔV > 0.1 V, compared to functionally non-connected pairs (P < 0.0001, one-sided Kolmogorov–Smirnov test). d, Agreement of measured responses to anatomy-predicted responses is shown for WT (green) and unc-31 (cyan) animals, either using weights and signs from anatomy, or when weights and signs are fitted optimally. Agreement is reported as R2 coefficient for the line of best fit: ΔF/F0 = mΔV. Perfect agreement would be R2 = 1. Source Data
Fig. 3 Functional measurements differ from anatomy-based predictions. a, Signals propagate along all paths, including indirect and recursive (coloured). Anatomical descriptions such as synapse count describe only direct paths (black). Connectome-constrained simulations are therefore used to predict signal propagation from anatomy. b, Pairs predicted from anatomy to have large downstream responses (ΔV > 0.1 V, n = 23, 454 pairs) tend to have stronger measured responses (larger ΔF/F0) than do those predicted to have small responses (ΔV < 0.1 V, n = 614 pairs). **** indicates P = 10−88, one-sided Kolmogorov–Smirnov test; whiskers indicate range. c, Bottom, measured downstream response (ΔF/F) versus anatomy-derived response (ΔV) for pairs that we observe to be functionally connected (q < 0.05, blue) and functionally non-connected (qeq < 0.05, orange). Vertical grey line is (0.1 V) for comparison with b. Top, marginal distributions (y axis is log scale). Measured functionally connected pairs are enriched for predicted ΔV > 0.1 V, compared to functionally non-connected pairs (P < 0.0001, one-sided Kolmogorov–Smirnov test). d, Agreement of measured responses to anatomy-predicted responses is shown for WT (green) and unc-31 (cyan) animals, either using weights and signs from anatomy, or when weights and signs are fitted optimally. Agreement is reported as R2 coefficient for the line of best fit: ΔF/F0 = mΔV. Perfect agreement would be R2 = 1. Source DataCC BY · PubMed Central
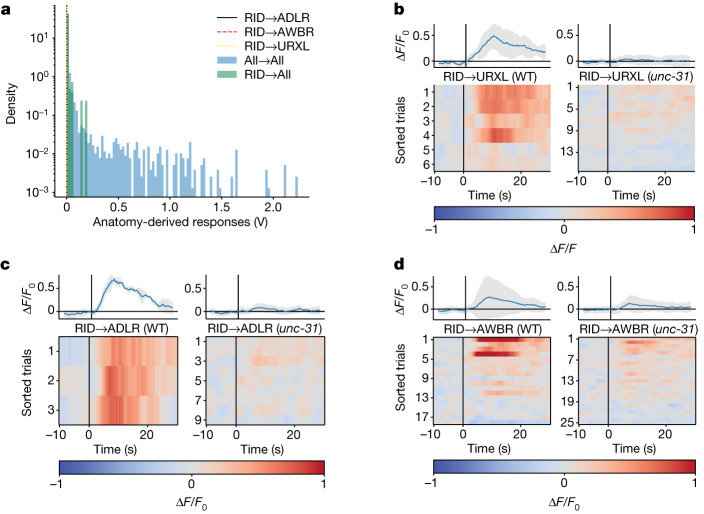
Fig. 4 Anatomy does not capture extrasynaptic signalling from the neuron RID. a, ADL, AWB and URX are predicted from anatomy to have no response to RID stimulation because there is no strong anatomical path from RID to those neurons (vertical lines at or near 0 V). Their anatomy-predicted responses are shown within the distribution of anatomy-predicted responses for all neuron pairs (blue histogram), as in Fig. 3b. b–d, Activity of neurons URXL (b), ADLR (c) and AWBR (d) to RID stimulation, in WT and unc-31-mutant backgrounds. Top, mean (blue) and s.d. (shading) across trials and animals. Bottom, individual traces are sorted across trial and animal by mean response amplitude. Here, trials are shown even in cases when RID activity was not measured. Additional neurons are shown in Extended Data Fig. 7c. Source Data
Fig. 4 Anatomy does not capture extrasynaptic signalling from the neuron RID. a, ADL, AWB and URX are predicted from anatomy to have no response to RID stimulation because there is no strong anatomical path from RID to those neurons (vertical lines at or near 0 V). Their anatomy-predicted responses are shown within the distribution of anatomy-predicted responses for all neuron pairs (blue histogram), as in Fig. 3b. b–d, Activity of neurons URXL (b), ADLR (c) and AWBR (d) to RID stimulation, in WT and unc-31-mutant backgrounds. Top, mean (blue) and s.d. (shading) across trials and animals. Bottom, individual traces are sorted across trial and animal by mean response amplitude. Here, trials are shown even in cases when RID activity was not measured. Additional neurons are shown in Extended Data Fig. 7c. Source DataCC BY · PubMed Central
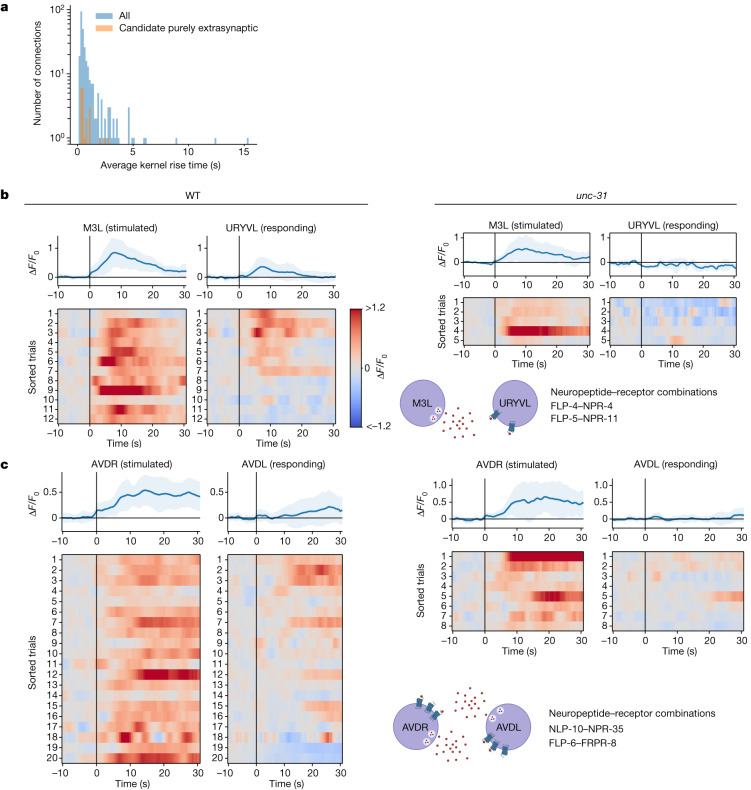
Fig. 5 Candidate purely extrasynaptic-dependent functional connections. a, Distribution of signal propagation timescales. b,c, Paired responses for M3L→URYVL (b) and AVDR→AVDL (c), for WT and unc-31 animals. unc-31 animals do not show downstream responses to stimulation. AVDR→AVDL extrasynaptic communication is putatively mediated in autocrine loops through NLP-10→NPR-35 and FLP-6→FRPR-8 signalling. Top, average (blue) and s.d. (shading) across trials and animals. Source Data
Fig. 5 Candidate purely extrasynaptic-dependent functional connections. a, Distribution of signal propagation timescales. b,c, Paired responses for M3L→URYVL (b) and AVDR→AVDL (c), for WT and unc-31 animals. unc-31 animals do not show downstream responses to stimulation. AVDR→AVDL extrasynaptic communication is putatively mediated in autocrine loops through NLP-10→NPR-35 and FLP-6→FRPR-8 signalling. Top, average (blue) and s.d. (shading) across trials and animals. Source DataCC BY · PubMed Central
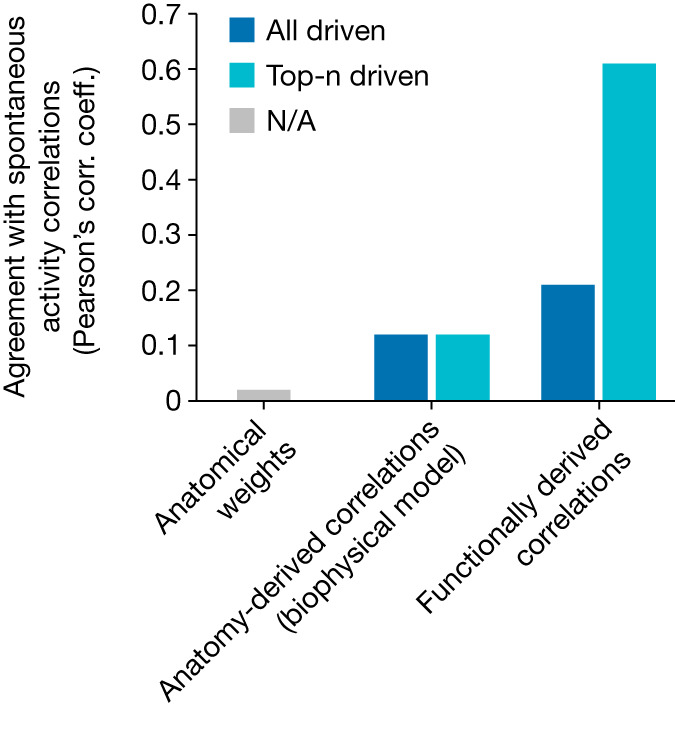
Fig. 6 Measured signal propagation better predicts spontaneous activity than anatomy does. Agreement (as Pearson’s correlation (corr.) coefficient (coeff.)) between the correlation matrix of spontaneous activity recorded from an immobilized animal and various predictions of those correlations, including: the bare anatomical weight matrix (synapse counts) (left); correlations predicted by the anatomy-derived biophysical model (middle); and correlations functionally derived from the measured signal propagation kernels (right). Anatomy-derived and functionally derived correlations are calculated by driving activity in silico in all neurons (dark blue) or only an optimal subset of top-n neurons (light blue). NA, not applicable. Source Data
Fig. 6 Measured signal propagation better predicts spontaneous activity than anatomy does. Agreement (as Pearson’s correlation (corr.) coefficient (coeff.)) between the correlation matrix of spontaneous activity recorded from an immobilized animal and various predictions of those correlations, including: the bare anatomical weight matrix (synapse counts) (left); correlations predicted by the anatomy-derived biophysical model (middle); and correlations functionally derived from the measured signal propagation kernels (right). Anatomy-derived and functionally derived correlations are calculated by driving activity in silico in all neurons (dark blue) or only an optimal subset of top-n neurons (light blue). NA, not applicable. Source DataCC BY · PubMed Central
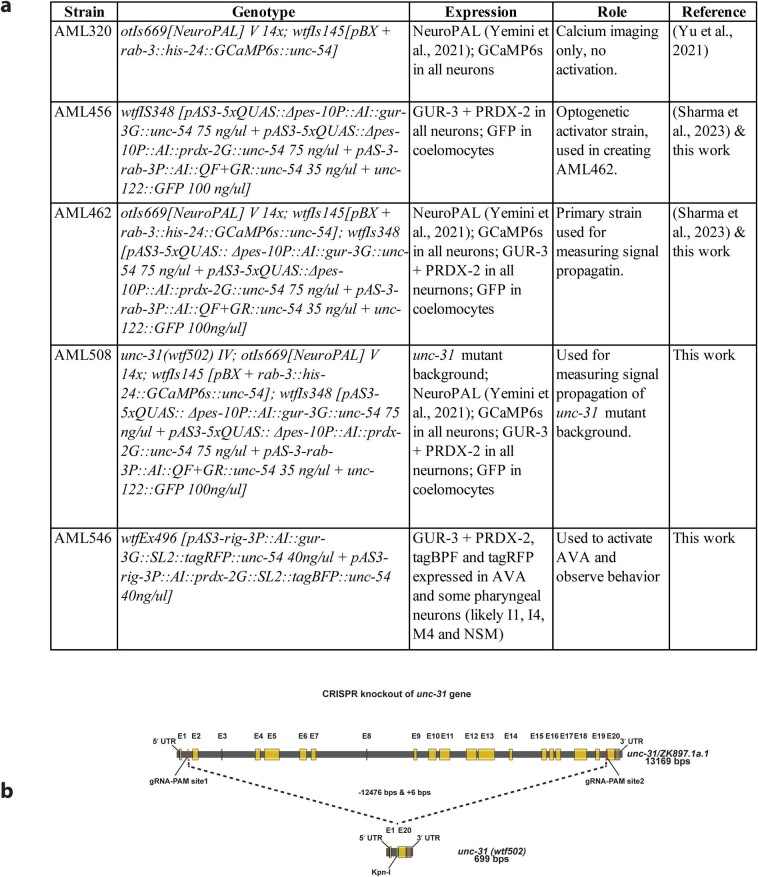
Extended Data Fig. 1 Strains. a, Table of strains used in this work. b, Schematic of CRISPR knockout of unc-31.
Extended Data Fig. 1 Strains. a, Table of strains used in this work. b, Schematic of CRISPR knockout of unc-31.CC BY · PubMed Central
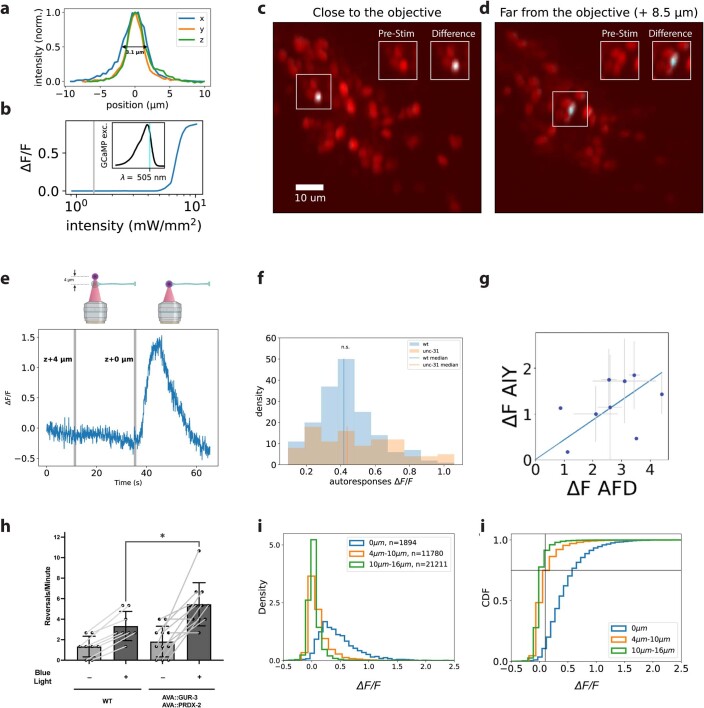
Extended Data Fig. 2 Characterization of two-photon optogenetic stimulation and evoked response. a, Two-photon (2p) stimulation spot size (point-spread function). b, Imaging excitation wavelength and intensity were chosen to avoid GUR-3/PRDX-2 activation. GCaMP response to 500 nm activation of GUR-3/PRDX-2 expressing neuron as reported in24. Vertical grey line indicates light intensity typically used for calcium imaging in present work. Inset: GCaMP6 excitation spectra from26. Vertical cyan line indicates 505-nm imaging excitation wavelength used in present work. c,d, A neuron near (c) and a neuron far (d) from the objective are photobleached to demonstrate targeted illumination. tagRFP-T is photobleached by 2p stim (20 s illumination, 200 μW, 500 kHz repetition rate, 3.1 μm diameter FWHM spot). Difference image shows tagRFP-T fluorescence merged with a false-colour blue-green image to reveal change in intensity after targeted illumination. Only targeted neuron and not nearby neurons appear photobleached. Insets shows zoomed-in image of the targeted neuron’s original tagRFP-T intensity (left) and difference image (right). Laser power was chosen to avoid saturated bleaching. For a sense of scale, C. elegans interneuron cell somas are roughly 4 microns in diameter. e, In vivo demonstration of 2p effective spot size. Activity from a neuron expressing GUR-3/PRDX-2 and GCaMP6s is shown in response to a 300-ms 2p stimulation delivered at t = 11 s,4 μm beyond the ≈ 3.5 μm diameter soma on the optical axis (z), and at t = 35 s, centred on the soma (t = 35 s). Only on-target soma stimulation evokes a transient, called an “autoresponse”. A stimulus artefact at t = 35 s is visible because no smoothing or filtering is applied to this trace. Schematic via BioRender. f, Distribution of autoresponses under typical stimulus conditions (1.2 mW, 500 kHz; 0.5 s for WT, 0.3 s for unc-31). Autoresponses are required for inclusion. g, Measured calcium response of neuron AIY to optogenetic stimulation of AFD. Compare to figure 4b in ref. 48. A variety of stimulus durations was used to generate autoresponses of different amplitudes (n = 1 (0.1 s), n = 2 (0.15 s), n = 1 (0.2 s), n = 3 (0.25 s), n = 3 (0.3 s), n = 3 (0.35 s), n = 6 (0.4 s), n = 2 (0.45 s), n = 4 (0.5 s) cross-hairs indicate s.d. h, Blue light evoked more reversals in animals expressing GUR-3/PRDX-2 in AVA (n = 11 animals) than WT (n = 8 animals). ~480 nm peaked light was delivered to freely moving animals. Unpaired t-test, p = 0.025. Bars show mean and s.d. i,j, Probability density (i) and CDF (j) of evoked calcium responses in a 30-s post-stimulus window for the targeted neuron (0 μm) or for neurons different distances away. Autoresponses are required. Cross-hairs in j, 75% cumulative distribution at ΔF/F0 = 0.1. Source Data
Extended Data Fig. 2 Characterization of two-photon optogenetic stimulation and evoked response. a, Two-photon (2p) stimulation spot size (point-spread function). b, Imaging excitation wavelength and intensity were chosen to avoid GUR-3/PRDX-2 activation. GCaMP response to 500 nm activation of GUR-3/PRDX-2 expressing neuron as reported in24. Vertical grey line indicates light intensity typically used for calcium imaging in present work. Inset: GCaMP6 excitation spectra from26. Vertical cyan line indicates 505-nm imaging excitation wavelength used in present work. c,d, A neuron near (c) and a neuron far (d) from the objective are photobleached to demonstrate targeted illumination. tagRFP-T is photobleached by 2p stim (20 s illumination, 200 μW, 500 kHz repetition rate, 3.1 μm diameter FWHM spot). Difference image shows tagRFP-T fluorescence merged with a false-colour blue-green image to reveal change in intensity after targeted illumination. Only targeted neuron and not nearby neurons appear photobleached. Insets shows zoomed-in image of the targeted neuron’s original tagRFP-T intensity (left) and difference image (right). Laser power was chosen to avoid saturated bleaching. For a sense of scale, C. elegans interneuron cell somas are roughly 4 microns in diameter. e, In vivo demonstration of 2p effective spot size. Activity from a neuron expressing GUR-3/PRDX-2 and GCaMP6s is shown in response to a 300-ms 2p stimulation delivered at t = 11 s,4 μm beyond the ≈ 3.5 μm diameter soma on the optical axis (z), and at t = 35 s, centred on the soma (t = 35 s). Only on-target soma stimulation evokes a transient, called an “autoresponse”. A stimulus artefact at t = 35 s is visible because no smoothing or filtering is applied to this trace. Schematic via BioRender. f, Distribution of autoresponses under typical stimulus conditions (1.2 mW, 500 kHz; 0.5 s for WT, 0.3 s for unc-31). Autoresponses are required for inclusion. g, Measured calcium response of neuron AIY to optogenetic stimulation of AFD. Compare to figure 4b in ref. 48. A variety of stimulus durations was used to generate autoresponses of different amplitudes (n = 1 (0.1 s), n = 2 (0.15 s), n = 1 (0.2 s), n = 3 (0.25 s), n = 3 (0.3 s), n = 3 (0.35 s), n = 6 (0.4 s), n = 2 (0.45 s), n = 4 (0.5 s) cross-hairs indicate s.d. h, Blue light evoked more reversals in animals expressing GUR-3/PRDX-2 in AVA (n = 11 animals) than WT (n = 8 animals). ~480 nm peaked light was delivered to freely moving animals. Unpaired t-test, p = 0.025. Bars show mean and s.d. i,j, Probability density (i) and CDF (j) of evoked calcium responses in a 30-s post-stimulus window for the targeted neuron (0 μm) or for neurons different distances away. Autoresponses are required. Cross-hairs in j, 75% cumulative distribution at ΔF/F0 = 0.1. Source DataCC BY · PubMed Central
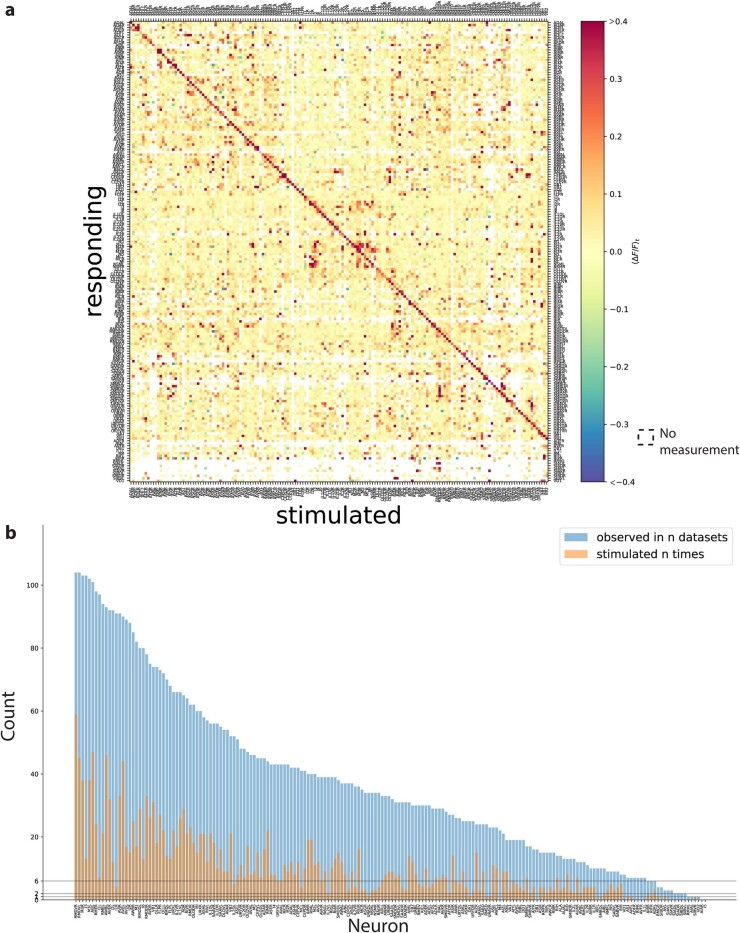
Extended Data Fig. 3 Signal propagation map. a, Mean amplitude of neural activity in a post-stimulus time window (⟨ΔF/F0⟩t) averaged across trials and individuals for WT background. White indicates no measurement. (n = 113 animals) For a measurement to be included, a stimulus event is required to evoke a response in the stimulated neuron. Same measurements as in Fig. 2a, but here all neurons that respond are shown, even if they are never stimulated. b, Number of stimulation events (orange) and number of datasets (animals) in which the neuron was observed (blue) for each neuron is shown. Source Data
Extended Data Fig. 3 Signal propagation map. a, Mean amplitude of neural activity in a post-stimulus time window (⟨ΔF/F0⟩t) averaged across trials and individuals for WT background. White indicates no measurement. (n = 113 animals) For a measurement to be included, a stimulus event is required to evoke a response in the stimulated neuron. Same measurements as in Fig. 2a, but here all neurons that respond are shown, even if they are never stimulated. b, Number of stimulation events (orange) and number of datasets (animals) in which the neuron was observed (blue) for each neuron is shown. Source DataCC BY · PubMed Central
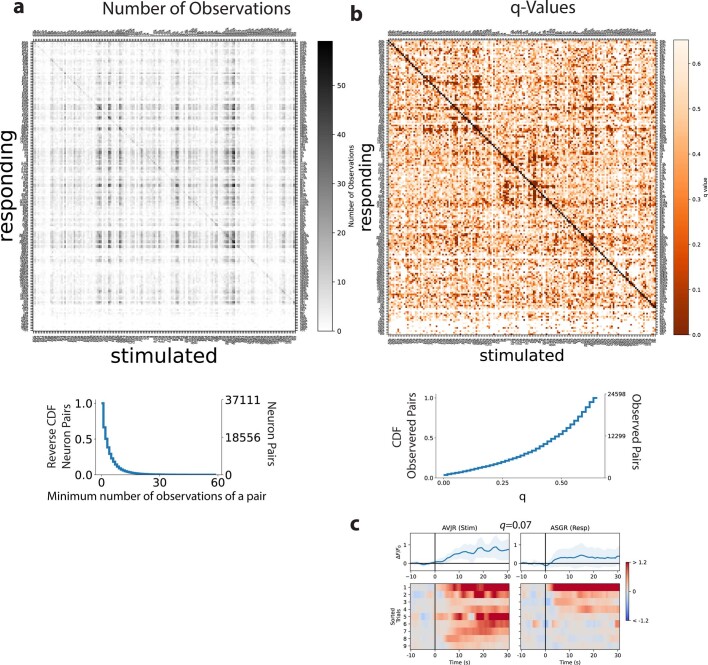
Extended Data Fig. 4 Observations and false discovery rate of neuron pairs in the signal propagation map. a, Number of observations made of each neuron pair for WT-background animals. To be considered an observation, the upstream neuron must have been stimulated, calcium imaging of both the upstream and downstream neuron must have been recorded, both neurons must have been unambiguosly identified and the upstream neuron must have exhibited an autoresponse. Sorted as in Extended Data Fig. 3a. Reverse cumulative distribution is also shown (bottom) and reports the fraction of pairs (number of observed pairs divided by the total number of possible pairs of neurons in the head). b, q values are shown for each neuron pair. q values report the false discovery rate of finding a functional connection. They provide a metric of significance for assessing whether a neuron pair is functionally connected based on the number of observations and the magnitude of the response transients, taking into consideration the number of multiple hypotheses tested. Cumulative distribution is also shown (bottom). c, ASGR often exhibits activity immediately following stimulation of AVJR, but because its q value is greater than 0.05, it does not meet the stringent statistical threshold to be deemed “functionally connected”. Top: mean (blue) and s.d. (shading) across trials and animals. Source Data
Extended Data Fig. 4 Observations and false discovery rate of neuron pairs in the signal propagation map. a, Number of observations made of each neuron pair for WT-background animals. To be considered an observation, the upstream neuron must have been stimulated, calcium imaging of both the upstream and downstream neuron must have been recorded, both neurons must have been unambiguosly identified and the upstream neuron must have exhibited an autoresponse. Sorted as in Extended Data Fig. 3a. Reverse cumulative distribution is also shown (bottom) and reports the fraction of pairs (number of observed pairs divided by the total number of possible pairs of neurons in the head). b, q values are shown for each neuron pair. q values report the false discovery rate of finding a functional connection. They provide a metric of significance for assessing whether a neuron pair is functionally connected based on the number of observations and the magnitude of the response transients, taking into consideration the number of multiple hypotheses tested. Cumulative distribution is also shown (bottom). c, ASGR often exhibits activity immediately following stimulation of AVJR, but because its q value is greater than 0.05, it does not meet the stringent statistical threshold to be deemed “functionally connected”. Top: mean (blue) and s.d. (shading) across trials and animals. Source DataCC BY · PubMed Central
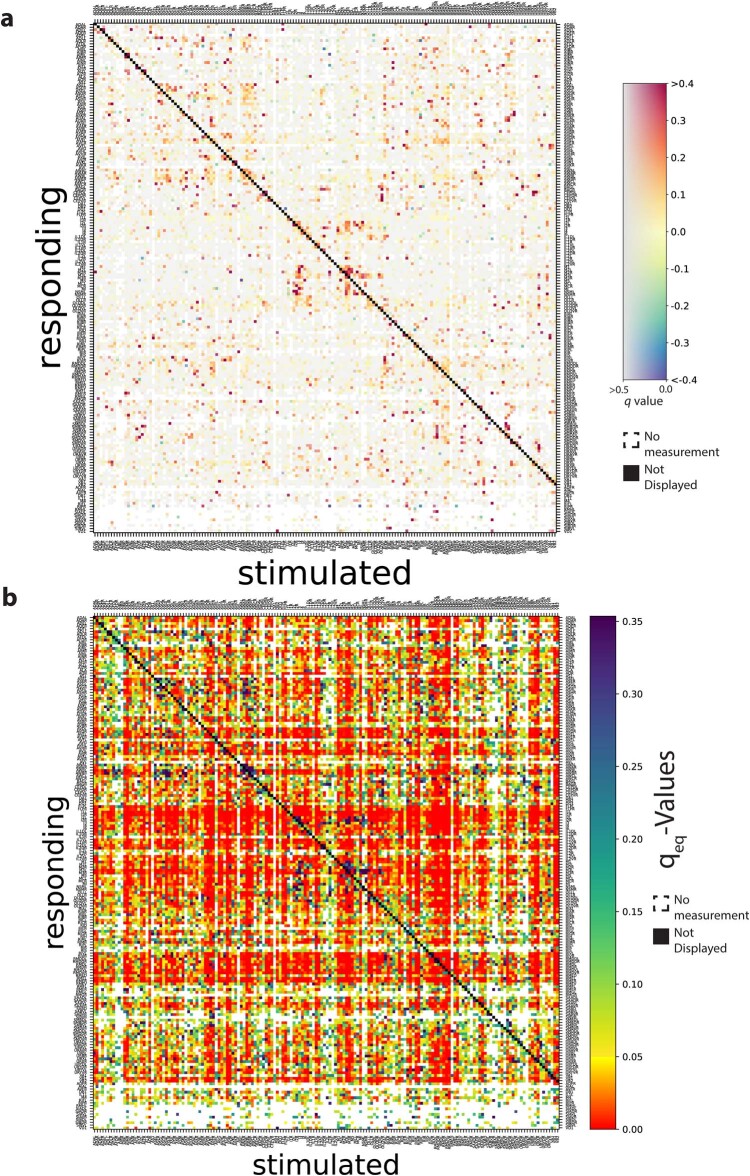
Extended Data Fig. 5 Signal propagation map showing false discovery rates for functional connections and non-connections. a, Map of functional connections showing downstream calcium response amplitude and false discovery rate for WT. Same as Fig. 2 except here neurons that are observed but not stimulated are also included. Note the colour bar has two axes. Mean amplitude of neural activity in a post-stimulus time window (⟨ΔF/F0⟩t) averaged across trials and individuals is shown. q value reports false discovery rate (more grey is less significant). White indicates no measurement. Autoresponse is required for inclusion and not displayed (black diagonal). (n =113 animals). b, Map of functionally not connected pairs. The false discovery rate, qeq, is reported for declaring a neuron pair to be not functionally connected. Lower qeq (more red) indicates higher confidence that the observed downstream calcium activity is equivalent within a bound ϵ to a null distribution of spontaneous activity. The false discovery rate takes into consideration the amplitude of the calcium transient, the number of observations and the number of hypotheses tested. Source Data
Extended Data Fig. 5 Signal propagation map showing false discovery rates for functional connections and non-connections. a, Map of functional connections showing downstream calcium response amplitude and false discovery rate for WT. Same as Fig. 2 except here neurons that are observed but not stimulated are also included. Note the colour bar has two axes. Mean amplitude of neural activity in a post-stimulus time window (⟨ΔF/F0⟩t) averaged across trials and individuals is shown. q value reports false discovery rate (more grey is less significant). White indicates no measurement. Autoresponse is required for inclusion and not displayed (black diagonal). (n =113 animals). b, Map of functionally not connected pairs. The false discovery rate, qeq, is reported for declaring a neuron pair to be not functionally connected. Lower qeq (more red) indicates higher confidence that the observed downstream calcium activity is equivalent within a bound ϵ to a null distribution of spontaneous activity. The false discovery rate takes into consideration the amplitude of the calcium transient, the number of observations and the number of hypotheses tested. Source DataCC BY · PubMed Central
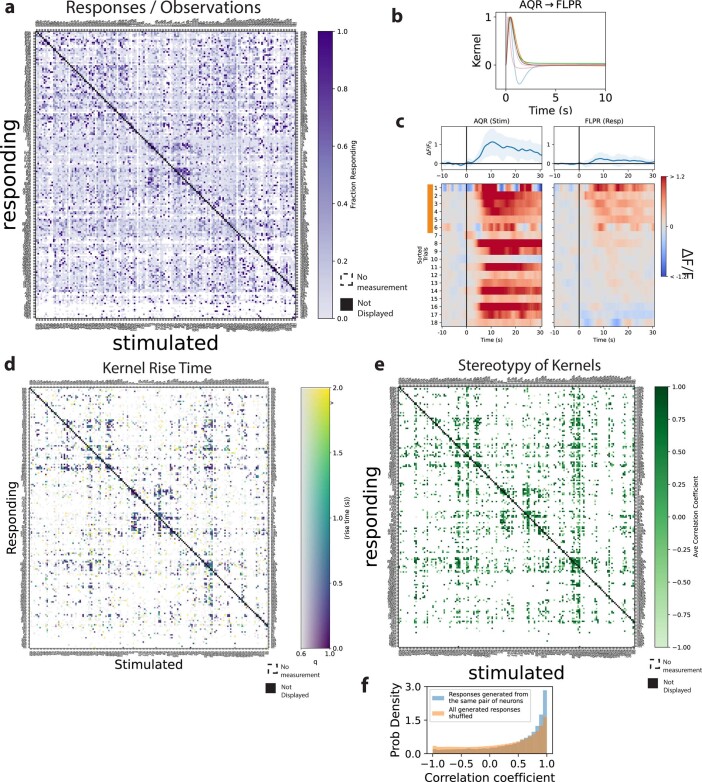
Extended Data Fig. 6 Timescales and variability of measured functional connectivity. WT. a, The fraction of stimulation events that evoked a downstream “response” is shown for each neuron pair. To be classified as a “response” requires a sufficiently large calcium transient amplitude and derivative. Autoresponses are required and not shown (black diagonal). b, Kernels are functions that return the downstream neuron’s activity when convolved with the upstream neuron’s activity. Kernels capture properties of the connection independent of variability in the upstream neuron’s autoresponse. c, Kernels are shown for each FLP response to AQR stimulation. Kernels are only calculated for stimuli that evoked downstream ‘responses’ (indicated in orange). Top: mean (blue) and s.d. (shading) across trials and animals. d, Kernel rise time for each measured neuron pair in WT is a metric of signal propagation speed. e, The stereotypy of kernels within each neuron pair is reported by calculating the average correlation coefficient among them. Only neuron pairs with at least two kernels are considered. f, Distribution of the correlation-coefficients of convolved kernels, within each pair of neurons (blue, n = 30,406), and across all kernels measured regardless of neuron pair (orange, n = 113,880,912). Source Data
Extended Data Fig. 6 Timescales and variability of measured functional connectivity. WT. a, The fraction of stimulation events that evoked a downstream “response” is shown for each neuron pair. To be classified as a “response” requires a sufficiently large calcium transient amplitude and derivative. Autoresponses are required and not shown (black diagonal). b, Kernels are functions that return the downstream neuron’s activity when convolved with the upstream neuron’s activity. Kernels capture properties of the connection independent of variability in the upstream neuron’s autoresponse. c, Kernels are shown for each FLP response to AQR stimulation. Kernels are only calculated for stimuli that evoked downstream ‘responses’ (indicated in orange). Top: mean (blue) and s.d. (shading) across trials and animals. d, Kernel rise time for each measured neuron pair in WT is a metric of signal propagation speed. e, The stereotypy of kernels within each neuron pair is reported by calculating the average correlation coefficient among them. Only neuron pairs with at least two kernels are considered. f, Distribution of the correlation-coefficients of convolved kernels, within each pair of neurons (blue, n = 30,406), and across all kernels measured regardless of neuron pair (orange, n = 113,880,912). Source DataCC BY · PubMed Central
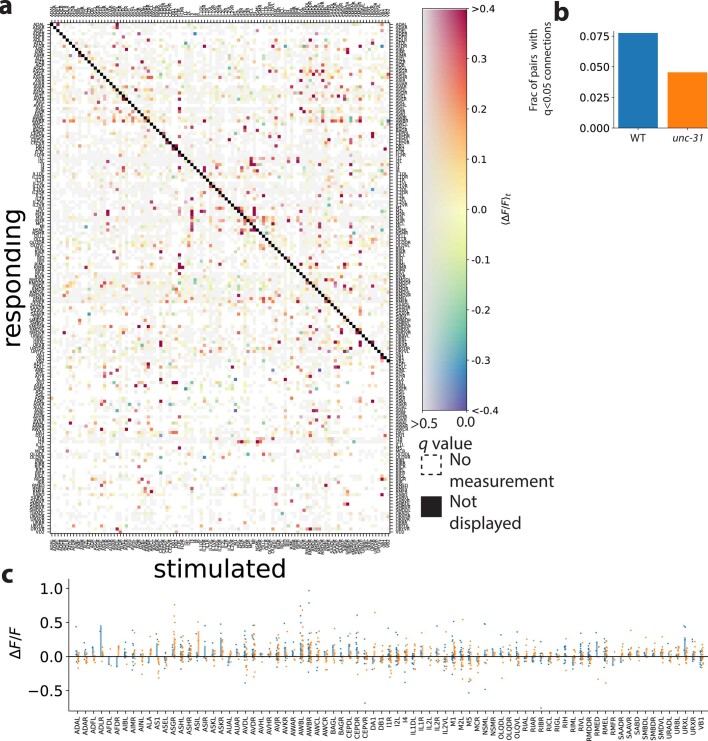
Extended Data Fig. 7 Signal propagation of the unc-31 background, with defects in dense-core-vesicle-mediated extrasynaptic signalling. a, Same format as Extended Data Fig. 5a. Mean amplitude of neural activity in a post-stimulus time window (⟨ΔF/F0⟩t) averaged across trials and individuals is shown. q value reports false discovery rate and is a metric of significance (more grey is less significant). White indicates no measurement. Autoresponse is required and not displayed (black diagonal). (n = 18 animals). b, unc-31 mutants had a smaller proportion of measured pairwise neurons that were functionally connected (q < 0.05) than WT (considering only those pairs for which data is present in both WT and unc-31 mutants). c, Responses to RID stimulation are shown for WT (blue) and unc-31 (orange). Points are responses, bar is mean across trials and animals. Neurons with the smallest amplitude responses are not shown. Corresponding traces for ADLR, AWBR and URXL are shown in Fig. 4. As in that figure, responses here are shown even for those cases when RID’s calcium activity was not measured and therefore do not appear in a. Different inclusion criteria are used here to accommodate cases in which the tagRFP-T expression is dim, as described in the Methods. Source Data
Extended Data Fig. 7 Signal propagation of the unc-31 background, with defects in dense-core-vesicle-mediated extrasynaptic signalling. a, Same format as Extended Data Fig. 5a. Mean amplitude of neural activity in a post-stimulus time window (⟨ΔF/F0⟩t) averaged across trials and individuals is shown. q value reports false discovery rate and is a metric of significance (more grey is less significant). White indicates no measurement. Autoresponse is required and not displayed (black diagonal). (n = 18 animals). b, unc-31 mutants had a smaller proportion of measured pairwise neurons that were functionally connected (q < 0.05) than WT (considering only those pairs for which data is present in both WT and unc-31 mutants). c, Responses to RID stimulation are shown for WT (blue) and unc-31 (orange). Points are responses, bar is mean across trials and animals. Neurons with the smallest amplitude responses are not shown. Corresponding traces for ADLR, AWBR and URXL are shown in Fig. 4. As in that figure, responses here are shown even for those cases when RID’s calcium activity was not measured and therefore do not appear in a. Different inclusion criteria are used here to accommodate cases in which the tagRFP-T expression is dim, as described in the Methods. Source DataCC BY · PubMed Central
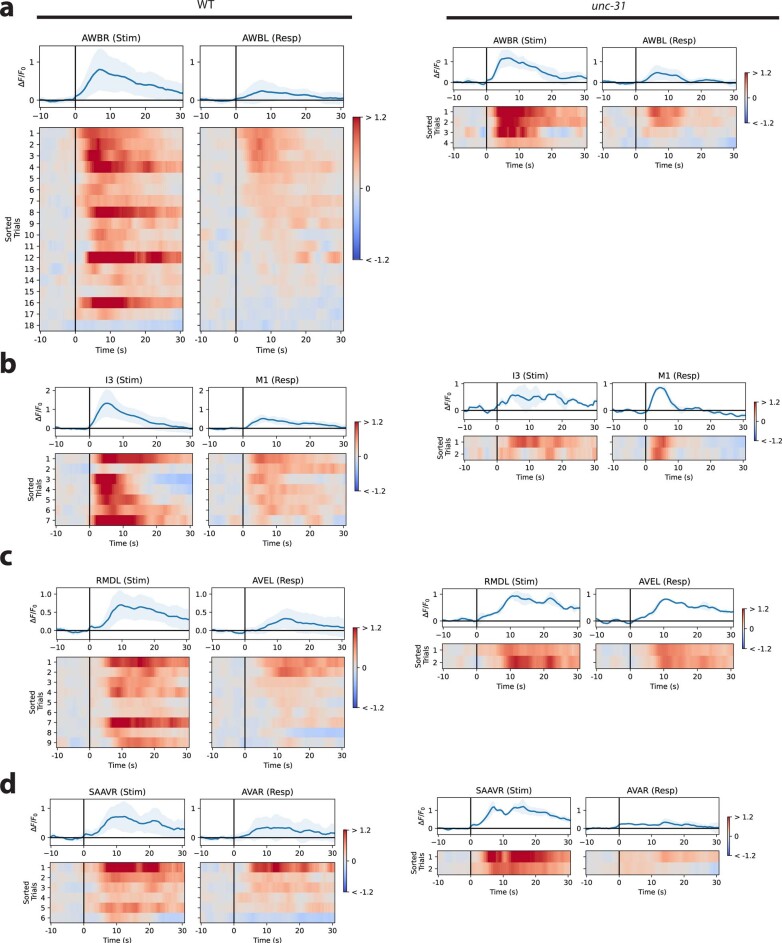
Extended Data Fig. 8 Neural responses for some pairs are similar in WT and unc-31-mutant animals. Paired stimulus and response traces of selected neuron pairs with monosynaptic gap junctions (a–c) or monosynaptic chemical synapses (d) are shown in a WT background (left) and in a unc-31-mutant background (right). Top: mean (blue) and s.d. (shading) across trials and animals.
Extended Data Fig. 8 Neural responses for some pairs are similar in WT and unc-31-mutant animals. Paired stimulus and response traces of selected neuron pairs with monosynaptic gap junctions (a–c) or monosynaptic chemical synapses (d) are shown in a WT background (left) and in a unc-31-mutant background (right). Top: mean (blue) and s.d. (shading) across trials and animals.CC BY · PubMed Central
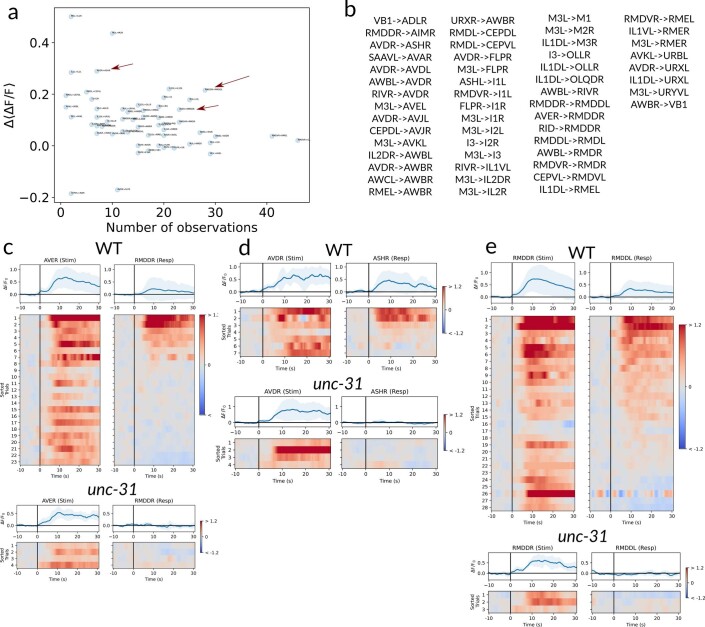
Extended Data Fig. 9 Examples of candidate purely extrasynaptic pairs. a, Change in activity Δ⟨ΔF/F⟩ versus number of WT observations for our candidate purely extrasynaptic-dependent pairs. Arrows indicate examples shown below. b, List of candidate entirely extrasynaptic-dependent connections. Relevant neuropeptide GPCR expression is listed in Supplementary Table 1, compiled from refs. 38,52, following ref. 51. c–e, Paired responses in WT and unc-31 animals for the candidate extrasynaptic pairs AVER–RMDDR (c), AVDR–ASHR (d) and RMDDR–RMDDL (e), selected among all the candidates as illustrated in a. Top: average (blue) and s.d. (shading) across trials and animals. Source Data
Extended Data Fig. 9 Examples of candidate purely extrasynaptic pairs. a, Change in activity Δ⟨ΔF/F⟩ versus number of WT observations for our candidate purely extrasynaptic-dependent pairs. Arrows indicate examples shown below. b, List of candidate entirely extrasynaptic-dependent connections. Relevant neuropeptide GPCR expression is listed in Supplementary Table 1, compiled from refs. 38,52, following ref. 51. c–e, Paired responses in WT and unc-31 animals for the candidate extrasynaptic pairs AVER–RMDDR (c), AVDR–ASHR (d) and RMDDR–RMDDL (e), selected among all the candidates as illustrated in a. Top: average (blue) and s.d. (shading) across trials and animals. Source DataCC BY · PubMed Central

Verification

Claims the paper makes

The claims and statistics of this paper haven’t been checked yet.

Run the check — free, no account needed. It reads the open-access text and checks the sources it cites.

A few free checks a day · papers already verified open instantly · results are public

Claims other papers make about this one

Each is checked against this paper’s own text: does it say what the citing paper says it does?

Self-check

Percentages, sums and reported differences re-computed from the paper’s own numbers.

The self-check needs the paper’s full text.

Citations

Cites

Show all 75 references

Cited by

Sorted by citations

See all 153

Metadata

Authors
Randi, F., Sharma, A. K., Dvali, S., & Leifer, A. M.
Affiliations
  • Regeneron (United States) (US)
  • Princeton University (US)
Corresponding author
Leifer, Andrew M.
Venue
Nature
Published
2023-11-01
Volume
623
Issue
7986
Pages
406-414
ISSN
  • 0028-0836 (ISSN-L)
  • 1476-4687
OpenAlex
W4388126567
Cited by
153
References
75
Citations by year
2026: 32 · 2025: 62 · 2024: 52 · 2023: 6
FWCI
18.43
Type
journal article
Language
en
Open access
Locations
  • Nature (publishedVersion, cc-by)
  • PubMed Central (publishedVersion, cc-by)
  • PubMed (publishedVersion)
  • RePEc: Research Papers in Economics (submittedVersion)
  • ArTS Archivio della ricerca di Trieste (University of Trieste https://www.units.it/) (submittedVersion)
Funders
  • National Institutes of Health (1dp2ns116768-01, P40OD010440)
  • National Institute of Neurological Disorders and Stroke (DP2-NS116768)
Topics
  • Life Sciences › Neuroscience › Cellular and Molecular Neuroscience › Neuroscience and Neuropharmacology Research
  • Life Sciences › Neuroscience › Cellular and Molecular Neuroscience › Neurobiology and Insect Physiology Research
  • Life Sciences › Neuroscience › Cognitive Neuroscience › Neural dynamics and brain function
Keywords
neural signal propagation, Caenorhabditis elegans, optogenetic stimulation, whole-brain calcium imaging, dense core vesicles, neuropeptides, synaptic transmission, spontaneous neuronal activity, neural dynamics, structure-function relationship
MeSH terms
Animals, Calcium, Models, Neurological, Mutation, Neural Pathways, Neurons, Neuropeptides, Synapses, Signal Transduction, Caenorhabditis elegans

About these checks

Registry, retraction, Cites and statistics results are computed, not judged, with one exception: a printed reference that no index lists is read once by a model before it counts as a citation error. Claims are extracted by a model and kept only when their quote appears verbatim in the text; each cited source is then checked, with a model’s help, for whether it says what the claim relies on. Those verdicts can be wrong — read the claim’s quote and the cited source before relying on one.

Statistics and arithmetic are recomputed, not judged.

Confidence bands are shown only for fields calibrated on our annotated test set. None is calibrated yet, so no band is shown.

What counts as a claim ›How we measure confidence ›How we check this ›

Are you an author, or do you see a problem with this page? Request a review