Cited by 189

The DOI matches its Crossref record; 4 of the 4 references it cites were found in a registry or an index.

The intrinsic substrate specificity of the human tyrosine kinome

Yaron-Barir, Tomer M., Joughin, Brian A., Huntsman, Emily M., Kerelsky, Alexander, Cizin, Daniel M., Cohen, Benjamin M., Regev, Amit, Song, Junho, Vasan, Neil, Lin, Ting-Yu, Orozco, Jose M., Schoenherr, Christina, Sagum, Cari, Bedford, Mark T., Wynn, R. Max, Tso, Shih-Chia, Chuang, David T., Li, Lei, Li, Shawn S.-C., Creixell, Pau, Krismer, Konstantin, Takegami, Mina, Lee, Harin, Zhang, Bin, Lu, Jingyi, Cossentino, Ian, Landry, Sean D., Uduman, Mohamed, Blenis, John, Elemento, Olivier, Frame, Margaret C., Hornbeck, Peter V., Cantley, Lewis C., Turk, Benjamin E., Yaffe, Michael B., Johnson, Jared L.·2024·Nature

Abstract

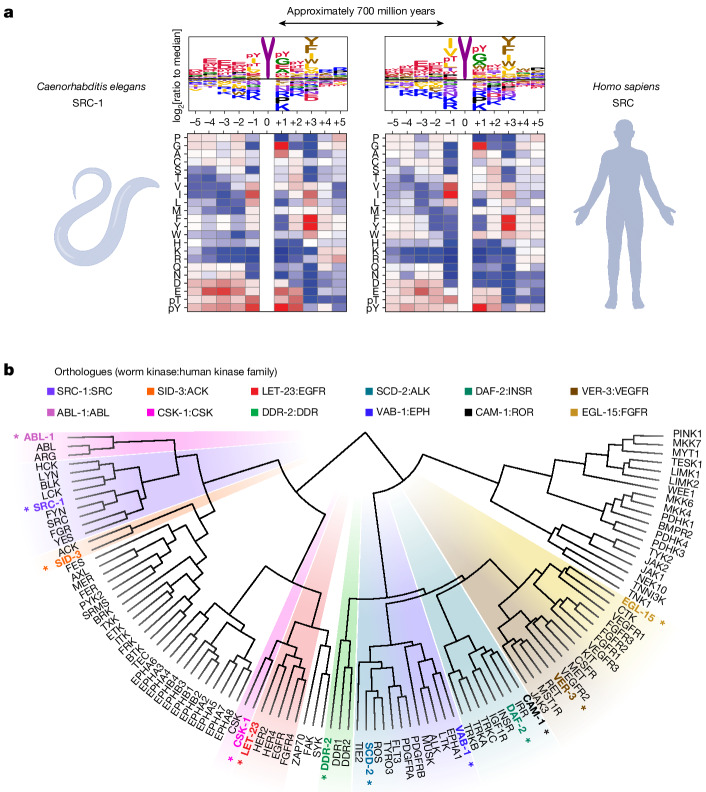
Phosphorylation of proteins on tyrosine (Tyr) residues evolved in metazoan organisms as a mechanism of coordinating tissue growth 1. Multicellular eukaryotes typically have more than 50 distinct protein Tyr kinases that catalyse the phosphorylation of thousands of Tyr residues throughout the proteome 1–3. How a given Tyr kinase can phosphorylate a specific subset of proteins at unique Tyr sites is only partially understood 4–7. Here we used combinatorial peptide arrays to profile the substrate sequence specificity of all human Tyr kinases. Globally, the Tyr kinases demonstrate considerable diversity in optimal patterns of residues surrounding the site of phosphorylation, revealing the functional organization of the human Tyr kinome by substrate motif preference. Using this information, Tyr kinases that are most compatible with phosphorylating any Tyr site can be identified. Analysis of mass spectrometry phosphoproteomic datasets using this compendium of kinase specificities accurately identifies specific Tyr kinases that are dysregulated in cells after stimulation with growth factors, treatment with anti-cancer drugs or expression of oncogenic variants. Furthermore, the topology of known Tyr signalling networks naturally emerged from a comparison of the sequence specificities of the Tyr kinases and the SH2 phosphotyrosine (pTyr)-binding domains. Finally we show that the intrinsic substrate specificity of Tyr kinases has remained fundamentally unchanged from worms to humans, suggesting that the fidelity between Tyr kinases and their protein substrate sequences has been maintained across hundreds of millions of years of evolution.

Overview

The claims and statistics of this paper haven’t been checked yet.

Run the check — free, no account needed. It reads the open-access text and checks the sources it cites.

A few free checks a day · papers already verified open instantly · results are public

Integrity signals

Registry

Crossref · 10.1038/s41586-024-07407-y

Cites

4 of 4 references verified0 citation errors · 0 not checkable

Statistics

Figures

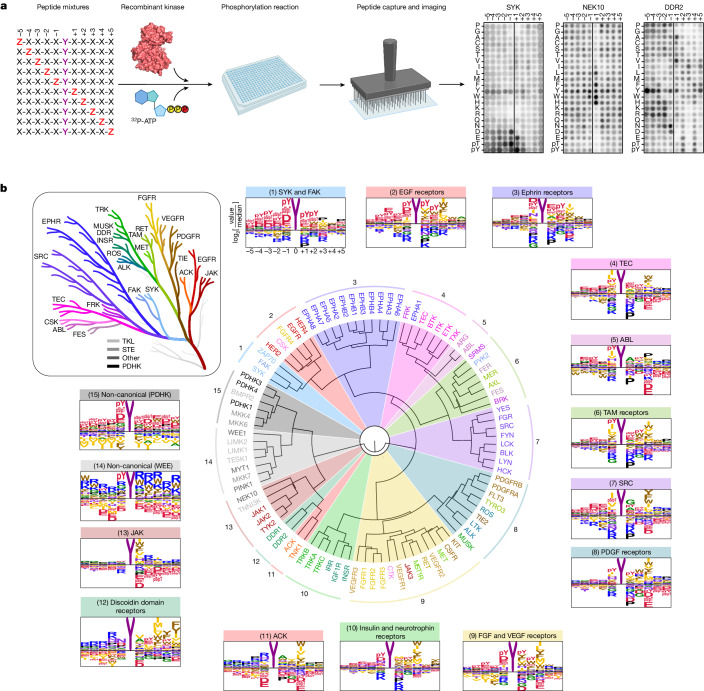
Fig. 1 Profiling optimal phosphorylation motifs reveals sequence specificity of the human Tyr kinome. a, Experimental workflow for the PSPA analysis and representative results. Z denotes fixed positions containing one of the 20 natural amino acids, phosphorylated Thr (pT) or phosphorylated Tyr (pY). X denotes unfixed positions containing randomized mixtures of all natural amino acids except for Tyr and Cys. Autoradiograms (right) indicate kinase preferences for specific amino acids at each position; darker spots indicate preferred residues. b, Hierarchical clustering of 93 Tyr kinases on the basis of their amino acid motif selectivity determined from the quantified PSPA data. Kinase names are colour coded according to catalytic domain sequence phylogeny (inset)21. The diagram in a was created using BioRender.
Fig. 1 Profiling optimal phosphorylation motifs reveals sequence specificity of the human Tyr kinome. a, Experimental workflow for the PSPA analysis and representative results. Z denotes fixed positions containing one of the 20 natural amino acids, phosphorylated Thr (pT) or phosphorylated Tyr (pY). X denotes unfixed positions containing randomized mixtures of all natural amino acids except for Tyr and Cys. Autoradiograms (right) indicate kinase preferences for specific amino acids at each position; darker spots indicate preferred residues. b, Hierarchical clustering of 93 Tyr kinases on the basis of their amino acid motif selectivity determined from the quantified PSPA data. Kinase names are colour coded according to catalytic domain sequence phylogeny (inset)21. The diagram in a was created using BioRender.CC BY · PubMed Central
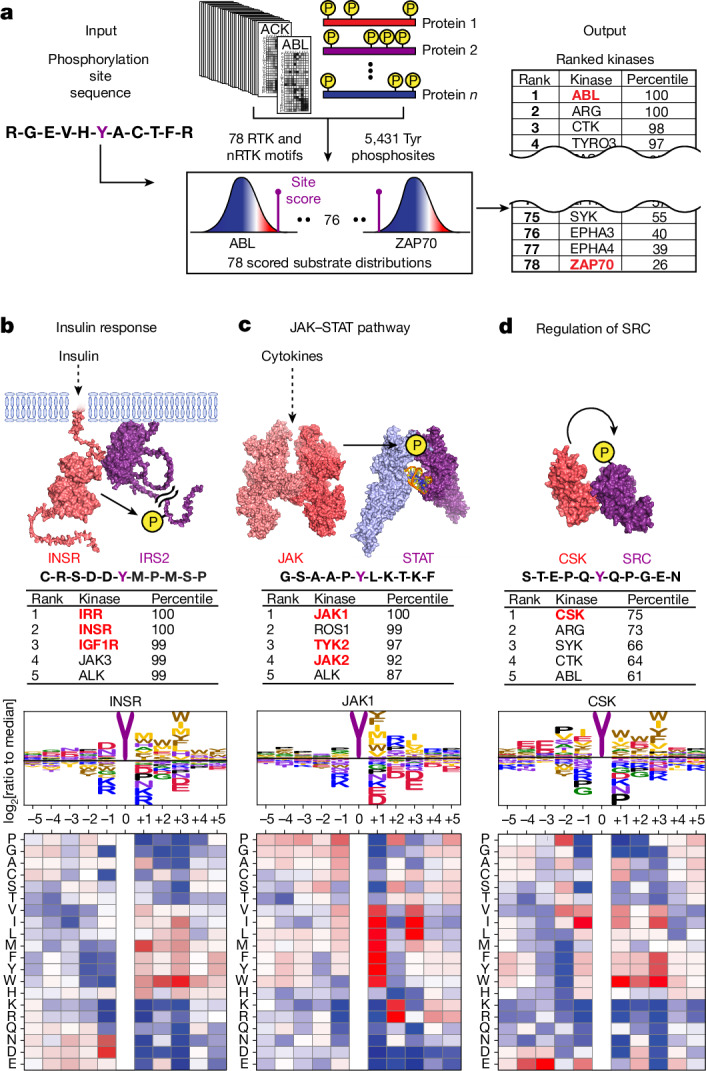
Fig. 2 The phosphorylation motifs for the human Tyr kinome enable comparison of all kinases for Tyr phosphorylation sites. a, Schematic of the substrate-scoring process. b–d, Scoring results and the substrate motif logos for Tyr675 on IRS2 and the insulin receptor kinase (b), Tyr705 on STAT3 and JAK1 (c) and Tyr530 on SRC and C-terminal SRC kinase (CSK) (d). Red text in b–d indicates known upstream kinases.
Fig. 2 The phosphorylation motifs for the human Tyr kinome enable comparison of all kinases for Tyr phosphorylation sites. a, Schematic of the substrate-scoring process. b–d, Scoring results and the substrate motif logos for Tyr675 on IRS2 and the insulin receptor kinase (b), Tyr705 on STAT3 and JAK1 (c) and Tyr530 on SRC and C-terminal SRC kinase (CSK) (d). Red text in b–d indicates known upstream kinases.CC BY · PubMed Central
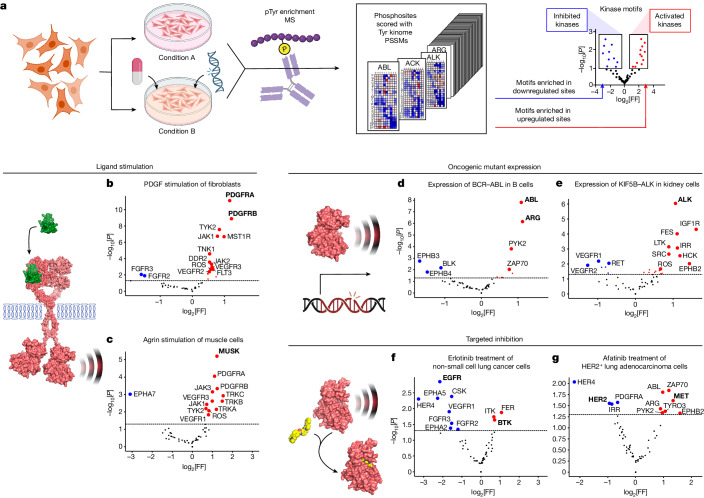
Fig. 3 Kinome-wide motif analysis of phosphoproteomic data identifies condition-dependent patterns of kinase regulation and dysregulation. a, Schematic of the motif enrichment analysis of Tyr phosphoproteomics data. FF, frequency factor. b–g, Results from published datasets in cells after ligand stimulation (b,c), oncogenic mutation (d,e) or targeted inhibition (f,g) of Tyr kinases. b, NIH3T3 fibroblasts after 15 min treatment with 100 ng ml−1 PDGF-ββ37. c, Cultured myotubes after treatment for 2 h with 10 nM agrin38. d, Ba/F3 cells after expression of BCR–ABL fusion protein41. e, HEK293 cells after expression of KIF5B–ALK fusion protein42. f, PC-9 cells after treatment for 3 h with 1 μM erlotinib44. g, H1781 cells after treatment for 3 h with 1 μM afatinib44. Kinases indicated in bold in b–g are discussed in the main text. The enrichments in b–g were determined using one-sided exact Fisher’s tests. Fully annotated versions of these plots are shown in Supplementary Fig. 3. The diagrams in a and d were created using BioRender. Source data
Fig. 3 Kinome-wide motif analysis of phosphoproteomic data identifies condition-dependent patterns of kinase regulation and dysregulation. a, Schematic of the motif enrichment analysis of Tyr phosphoproteomics data. FF, frequency factor. b–g, Results from published datasets in cells after ligand stimulation (b,c), oncogenic mutation (d,e) or targeted inhibition (f,g) of Tyr kinases. b, NIH3T3 fibroblasts after 15 min treatment with 100 ng ml−1 PDGF-ββ37. c, Cultured myotubes after treatment for 2 h with 10 nM agrin38. d, Ba/F3 cells after expression of BCR–ABL fusion protein41. e, HEK293 cells after expression of KIF5B–ALK fusion protein42. f, PC-9 cells after treatment for 3 h with 1 μM erlotinib44. g, H1781 cells after treatment for 3 h with 1 μM afatinib44. Kinases indicated in bold in b–g are discussed in the main text. The enrichments in b–g were determined using one-sided exact Fisher’s tests. Fully annotated versions of these plots are shown in Supplementary Fig. 3. The diagrams in a and d were created using BioRender. Source dataCC BY · PubMed Central
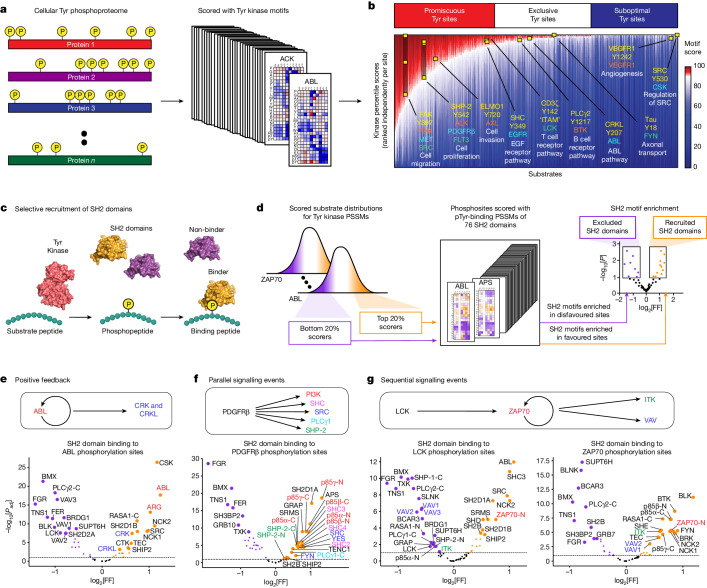
Fig. 4 Phosphorylation motifs for the human Tyr kinome enable broad categorization of phosphosites and reveal functional correspondence with the SH2-ome. a, Comprehensive scoring of the Tyr phosphoproteome by all Tyr kinase motifs. b, Annotation of the human Tyr phosphoproteome by percentile scores with all RTK and nRTK motifs. 7,315 known human phosphorylation sites2,3 were sorted along the x axis according to the number of kinases that score the site in the 90th or higher percentile of substrates for that kinase. Independently in each column of the heat map, kinases were ranked by score for that substrate. Examples of experimentally studied kinase–substrate relationships are highlighted (yellow squares). ITAM, immunoreceptor tyrosine-based activation motif. c, The overlap between phosphorylation motifs of kinases and pTyr recognition motifs of SH2 domains. d, Schematic of the calculation of enrichment of kinase phosphorylation and SH2-domain-binding motifs. e–g, Signalling schematics (top) and motif enrichment plots (bottom) of SH2-binding PSSMs53 for Tyr phosphorylation sites scored according to the kinase PSSMs of ABL (e), PDGFRβ (f), LCK (g) and ZAP70 (g). In the schematics, the arrows represent recruitment of the indicated protein’s SH2 domain by the indicated kinases. The enrichments in e–g were determined using one-sided exact Fisher’s tests and corrected for multiple hypotheses using the Benjamini–Hochberg method. Fully annotated versions of these plots are presented in Supplementary Fig. 4. The diagrams in c and d were created using BioRender.
Fig. 4 Phosphorylation motifs for the human Tyr kinome enable broad categorization of phosphosites and reveal functional correspondence with the SH2-ome. a, Comprehensive scoring of the Tyr phosphoproteome by all Tyr kinase motifs. b, Annotation of the human Tyr phosphoproteome by percentile scores with all RTK and nRTK motifs. 7,315 known human phosphorylation sites2,3 were sorted along the x axis according to the number of kinases that score the site in the 90th or higher percentile of substrates for that kinase. Independently in each column of the heat map, kinases were ranked by score for that substrate. Examples of experimentally studied kinase–substrate relationships are highlighted (yellow squares). ITAM, immunoreceptor tyrosine-based activation motif. c, The overlap between phosphorylation motifs of kinases and pTyr recognition motifs of SH2 domains. d, Schematic of the calculation of enrichment of kinase phosphorylation and SH2-domain-binding motifs. e–g, Signalling schematics (top) and motif enrichment plots (bottom) of SH2-binding PSSMs53 for Tyr phosphorylation sites scored according to the kinase PSSMs of ABL (e), PDGFRβ (f), LCK (g) and ZAP70 (g). In the schematics, the arrows represent recruitment of the indicated protein’s SH2 domain by the indicated kinases. The enrichments in e–g were determined using one-sided exact Fisher’s tests and corrected for multiple hypotheses using the Benjamini–Hochberg method. Fully annotated versions of these plots are presented in Supplementary Fig. 4. The diagrams in c and d were created using BioRender.CC BY · PubMed Central
Fig. 5 The diversity of intrinsic Tyr kinase substrate specificity is evolutionarily conserved. a, Comparison of sequence selectivity between the human and C. elegans orthologues of SRC kinase. b, Hierarchical clustering of the substrate motifs (PSSMs) of the human and nematode Tyr kinases. Worm kinase names are denoted with asterisks and colour coded according to their phylogenetic relationships with human Tyr kinase families (inset). Clusters containing distinct orthologous groups are highlighted. The diagram in a was created using BioRender.
Fig. 5 The diversity of intrinsic Tyr kinase substrate specificity is evolutionarily conserved. a, Comparison of sequence selectivity between the human and C. elegans orthologues of SRC kinase. b, Hierarchical clustering of the substrate motifs (PSSMs) of the human and nematode Tyr kinases. Worm kinase names are denoted with asterisks and colour coded according to their phylogenetic relationships with human Tyr kinase families (inset). Clusters containing distinct orthologous groups are highlighted. The diagram in a was created using BioRender.CC BY · PubMed Central
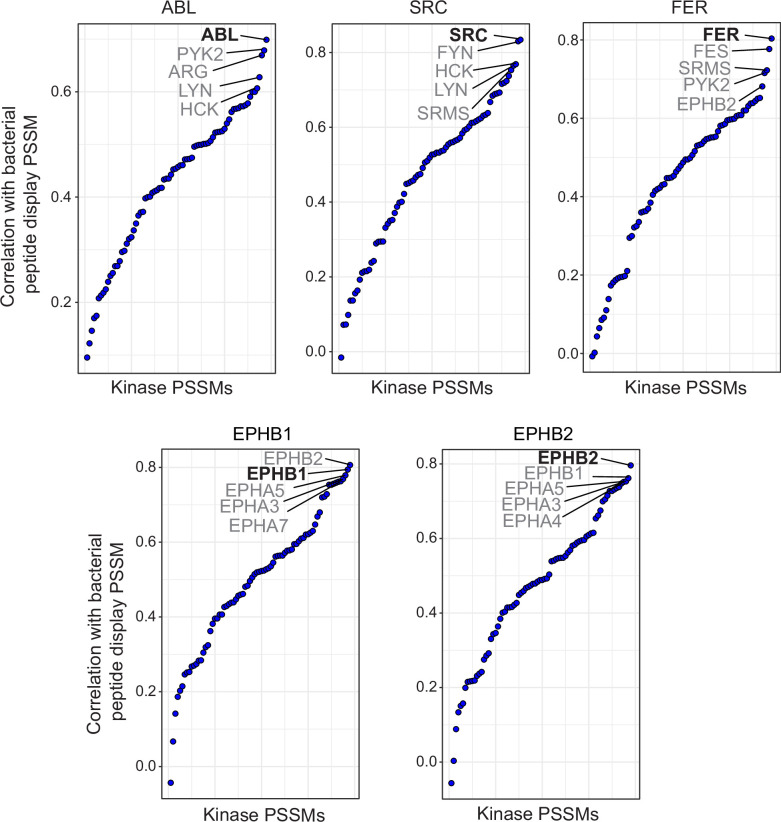
Extended Data Fig. 1 Correlation between Tyr kinase PSSMs derived from PSPA assays and bacterial peptide display. Pearson correlation coefficients for position specific scoring matrices (PSSMs) obtained previously for five kinases screened by bacterial display7 were calculated against the PSSMs of the 78 conventional RTKs and nRTKs obtained in this study. Correlation coefficients are sorted from lowest to highest with each of the 5 kinases screened by bacterial display with the 5 best-matching kinase selectivities in our study explicitly labelled.
Extended Data Fig. 1 Correlation between Tyr kinase PSSMs derived from PSPA assays and bacterial peptide display. Pearson correlation coefficients for position specific scoring matrices (PSSMs) obtained previously for five kinases screened by bacterial display7 were calculated against the PSSMs of the 78 conventional RTKs and nRTKs obtained in this study. Correlation coefficients are sorted from lowest to highest with each of the 5 kinases screened by bacterial display with the 5 best-matching kinase selectivities in our study explicitly labelled.CC BY · PubMed Central
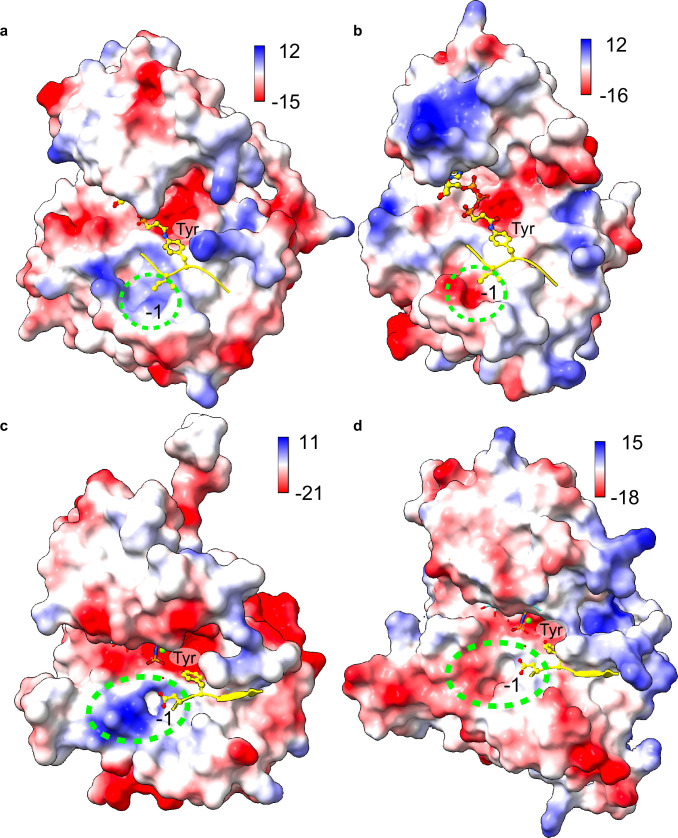
Extended Data Fig. 2 Structural models of kinase-substrate complexes. a, EGFR (PDB: 2GS6) in complex with synthetic peptide. Dotted green circle shows positive surface potential in the vicinity of the −1 residue. b, Synthetic peptide from its complex with EGFR (PDB: 2GS6) modelled onto ACK (PDB: 1U46). Dotted green circle shows negative surface potential in the vicinity of the −1 residue. c, INSR (PDB: 1IR3) in complex with synthetic peptide. Dotted green circle shows positive surface potential in the vicinity of the substrate N-terminal residues. d, Synthetic peptide from its complex with INSR (PDB: 1IR3) modelled onto DDR2 (PDB: AF-Q16832-K1A)80. Dotted green circle shows negative surface potential in the vicinity of the substrate N-terminal residues. Surface electrostatics are represented with Coulombic potential values were computed in ChimeraX and represented by scale bars (kcal/mol·e). In all panels, “Tyr” represents the site of phosphorylation and “−1” indicates the residue directly to the N-terminal side of the site of phosphorylation.
Extended Data Fig. 2 Structural models of kinase-substrate complexes. a, EGFR (PDB: 2GS6) in complex with synthetic peptide. Dotted green circle shows positive surface potential in the vicinity of the −1 residue. b, Synthetic peptide from its complex with EGFR (PDB: 2GS6) modelled onto ACK (PDB: 1U46). Dotted green circle shows negative surface potential in the vicinity of the −1 residue. c, INSR (PDB: 1IR3) in complex with synthetic peptide. Dotted green circle shows positive surface potential in the vicinity of the substrate N-terminal residues. d, Synthetic peptide from its complex with INSR (PDB: 1IR3) modelled onto DDR2 (PDB: AF-Q16832-K1A)80. Dotted green circle shows negative surface potential in the vicinity of the substrate N-terminal residues. Surface electrostatics are represented with Coulombic potential values were computed in ChimeraX and represented by scale bars (kcal/mol·e). In all panels, “Tyr” represents the site of phosphorylation and “−1” indicates the residue directly to the N-terminal side of the site of phosphorylation.CC BY · PubMed Central
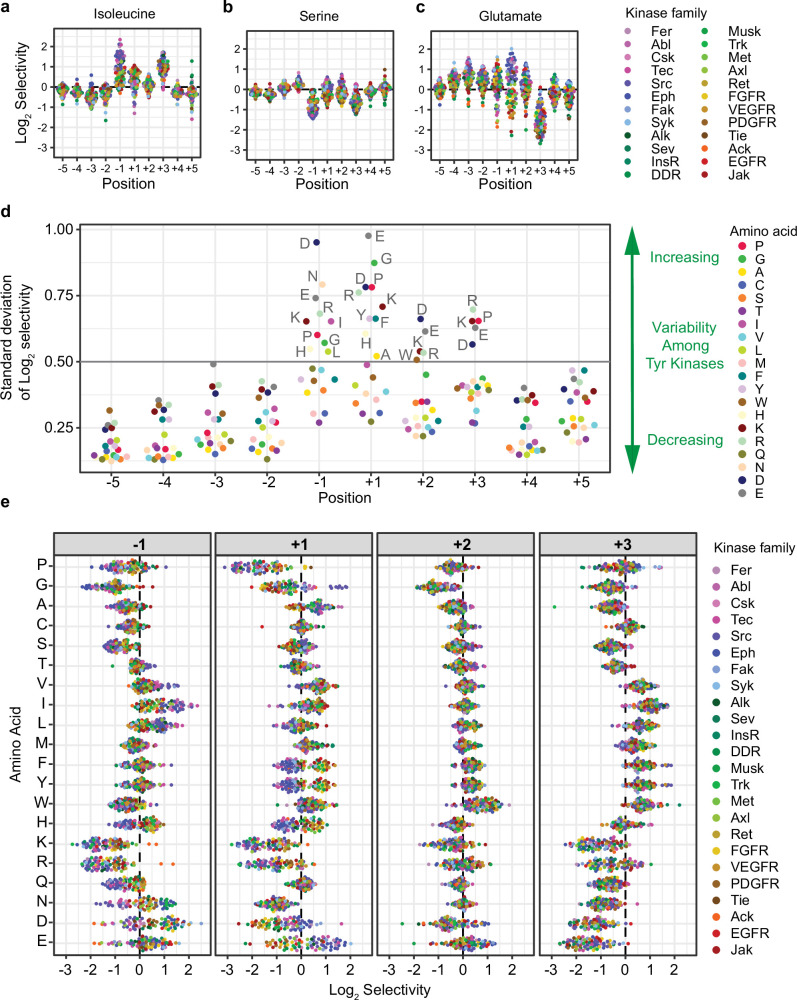
Extended Data Fig. 3 Human Tyr kinases display strong selectivities and diverse preferences for the amino acids near their Tyr phosphorylation sites. a-c, Log-selectivity of the 78 conventional RTKs and nRTKs on PSPA substrate peptides containing Tyr sites flanked by isoleucine (a), serine (b), or glutamate (c) residues relative to the 18 natural amino acids excluding cysteine and tyrosine. d, Kinome-wide variability in log-selectivity for specific amino acid residues at each position surrounding the substrate Tyr phosphorylation site. Horizontal line indicates a value of 0.5 logs, identifying positions −1 to +3 as the most variably selective positions. e, Experimental kinase selectivity for each Tyr kinase on all amino acids across the highly selective substrate positions −1 to +3.
Extended Data Fig. 3 Human Tyr kinases display strong selectivities and diverse preferences for the amino acids near their Tyr phosphorylation sites. a-c, Log-selectivity of the 78 conventional RTKs and nRTKs on PSPA substrate peptides containing Tyr sites flanked by isoleucine (a), serine (b), or glutamate (c) residues relative to the 18 natural amino acids excluding cysteine and tyrosine. d, Kinome-wide variability in log-selectivity for specific amino acid residues at each position surrounding the substrate Tyr phosphorylation site. Horizontal line indicates a value of 0.5 logs, identifying positions −1 to +3 as the most variably selective positions. e, Experimental kinase selectivity for each Tyr kinase on all amino acids across the highly selective substrate positions −1 to +3.CC BY · PubMed Central
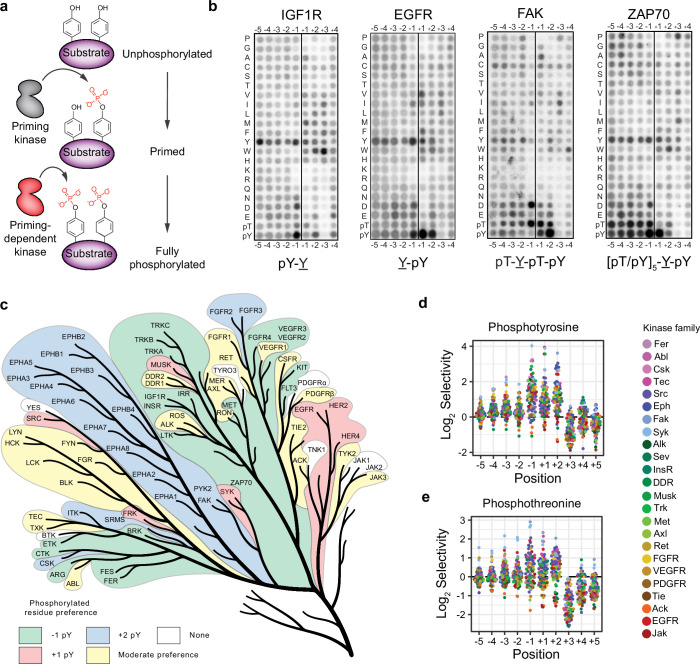
Extended Data Fig. 4 Phosphopriming favorability is a general feature of the human Tyr kinome. a, Schematic of Tyr substrate phosphopriming. b, PSPA data and simplified sequence logos highlighting various phosphopriming preferences. The Tyr phosphoacceptors in the logos are represented as Y. c, Phosphopriming favorability of the Tyr kinome. The colour scheme illustrates kinases that select phosphorylated Tyr as their top preferred residue at substrate position −1 (green), +1 (pink), or +2 (blue). Kinases with moderate phosphopriming preferences (where phosphorylated residues are the top preferred residues at certain substrate positions, but not overall favorites) are highlighted in yellow. The kinase TXK, as a notable exception, selects phosphorylated Thr (at position +1) as its overall preferred residue. d-e, Log-selectivity of the 78 conventional RTKs and nRTKs on PSPA substrate peptides containing Tyr sites flanked by phosphotyrosine (d) or phosphothreonine (e).
Extended Data Fig. 4 Phosphopriming favorability is a general feature of the human Tyr kinome. a, Schematic of Tyr substrate phosphopriming. b, PSPA data and simplified sequence logos highlighting various phosphopriming preferences. The Tyr phosphoacceptors in the logos are represented as Y. c, Phosphopriming favorability of the Tyr kinome. The colour scheme illustrates kinases that select phosphorylated Tyr as their top preferred residue at substrate position −1 (green), +1 (pink), or +2 (blue). Kinases with moderate phosphopriming preferences (where phosphorylated residues are the top preferred residues at certain substrate positions, but not overall favorites) are highlighted in yellow. The kinase TXK, as a notable exception, selects phosphorylated Thr (at position +1) as its overall preferred residue. d-e, Log-selectivity of the 78 conventional RTKs and nRTKs on PSPA substrate peptides containing Tyr sites flanked by phosphotyrosine (d) or phosphothreonine (e).CC BY · PubMed Central
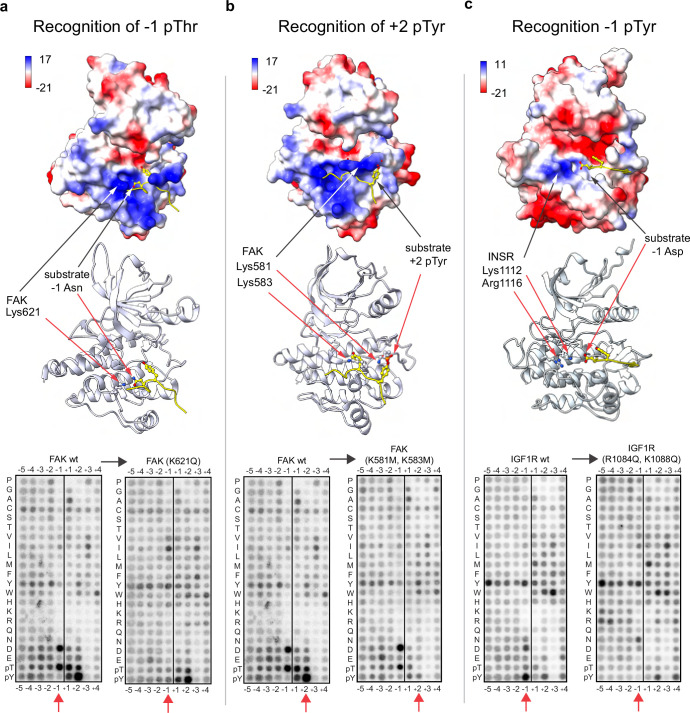
Extended Data Fig. 5 Substrate phosphopriming preferences by Tyr kinases are mediated by complementary basic residues in their catalytic domains. a, Top, structural modelling of the interaction between FAK and substrate peptides. Spatial alignment of FAK’s kinase domain structure (PDB: 6TY4) with the EPHB2-substrate peptide complex (PDB: 3FXX) where FAK and the substrate peptide are specifically shown to illustrate the role of Lys621 in the recognition of pThr at the −1 substrate position by FAK and, bottom, the corresponding experimental validation in PSPA assays. b, Top, spatial alignment of FAK’s kinase domain structure (PDB: 6TY4) with the EPHB2-substrate peptide complex (PDB: 3FXX), as performed in a, now illustrating the close proximity between pTyr at the +2 substrate position and Lys581 and Lys583 of FAK and, bottom, the corresponding experimental validation. c, Top, structural modelling of the INSR-peptide substrate complex (PDB: 1IR3), highlighting the residues in its catalytic domain that recognize pTyr at the −1 position on its substrates and, bottom, the corresponding experimental validation with its paralog IGF1R. INSR residues Lys1112 and Arg1116 are equivalent to the IGF1R residues Arg1084 and Lys1088, respectively, in their homologous alignments 68. Surface electrostatics are represented with Coulombic potential values were computed in ChimeraX and represented by scale bars (kcal/mol·e). Amino acid sidechains of Tyr phosphoacceptors, residues at substrate priming positions and indicated complementary residues in kinase domain are shown in ball-and-stick representation.
Extended Data Fig. 5 Substrate phosphopriming preferences by Tyr kinases are mediated by complementary basic residues in their catalytic domains. a, Top, structural modelling of the interaction between FAK and substrate peptides. Spatial alignment of FAK’s kinase domain structure (PDB: 6TY4) with the EPHB2-substrate peptide complex (PDB: 3FXX) where FAK and the substrate peptide are specifically shown to illustrate the role of Lys621 in the recognition of pThr at the −1 substrate position by FAK and, bottom, the corresponding experimental validation in PSPA assays. b, Top, spatial alignment of FAK’s kinase domain structure (PDB: 6TY4) with the EPHB2-substrate peptide complex (PDB: 3FXX), as performed in a, now illustrating the close proximity between pTyr at the +2 substrate position and Lys581 and Lys583 of FAK and, bottom, the corresponding experimental validation. c, Top, structural modelling of the INSR-peptide substrate complex (PDB: 1IR3), highlighting the residues in its catalytic domain that recognize pTyr at the −1 position on its substrates and, bottom, the corresponding experimental validation with its paralog IGF1R. INSR residues Lys1112 and Arg1116 are equivalent to the IGF1R residues Arg1084 and Lys1088, respectively, in their homologous alignments 68. Surface electrostatics are represented with Coulombic potential values were computed in ChimeraX and represented by scale bars (kcal/mol·e). Amino acid sidechains of Tyr phosphoacceptors, residues at substrate priming positions and indicated complementary residues in kinase domain are shown in ball-and-stick representation.CC BY · PubMed Central
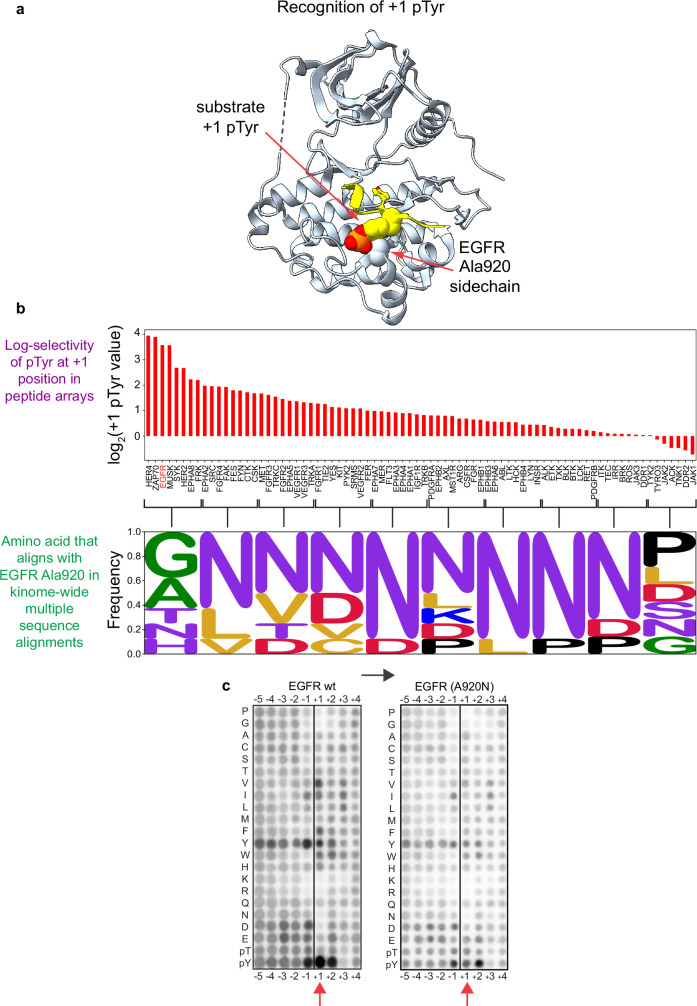
Extended Data Fig. 6 Steric accommodation of a +1 pTyr residue by EGFR. a, Structural modelling of EGFR’s recognition of +1 pTyr (PDB: 5CZH). Side chains of Ala920 on EGFR and +1 pTyr on the peptide substrate as shown in spacefill representation. Sidechain of Tyr phosphoacceptor is shown in ball-and-stick representation. b, Top, log-selectivity of the 78 conventional kinases for +1 pTyr, arranged in order of decreasing favorability. Bottom, corresponding amino acid residues that align with Ala920 of EGFR (bin size: 8 kinases in the left 8 bins; 7 kinases in the right two bins)68. c, Experimental validation of the importance of Ala920 in facilitating phosphorylation of +1 pTyr substrate by EGFR.
Extended Data Fig. 6 Steric accommodation of a +1 pTyr residue by EGFR. a, Structural modelling of EGFR’s recognition of +1 pTyr (PDB: 5CZH). Side chains of Ala920 on EGFR and +1 pTyr on the peptide substrate as shown in spacefill representation. Sidechain of Tyr phosphoacceptor is shown in ball-and-stick representation. b, Top, log-selectivity of the 78 conventional kinases for +1 pTyr, arranged in order of decreasing favorability. Bottom, corresponding amino acid residues that align with Ala920 of EGFR (bin size: 8 kinases in the left 8 bins; 7 kinases in the right two bins)68. c, Experimental validation of the importance of Ala920 in facilitating phosphorylation of +1 pTyr substrate by EGFR.CC BY · PubMed Central
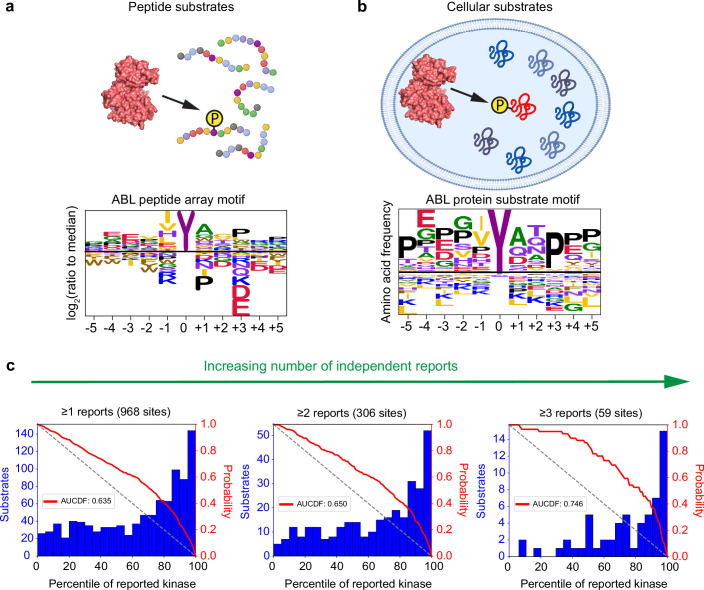
Extended Data Fig. 7 Correspondence between Tyr kinase motif-based predictions and their literature-annotated substrates. a,b, Schema and phosphorylation site motif logos for ABL derived from PSPA experiments (a) and literature-annotated cellular substrates2 (b). c, Percentile-score distributions of substrates for their literature-annotated kinases2. Higher number of reports correlates with more favourable percentile-scores between the reported kinase and its substrate (AUCDF = area under the cumulative distribution function). The diagrams in a and b were created using BioRender.
Extended Data Fig. 7 Correspondence between Tyr kinase motif-based predictions and their literature-annotated substrates. a,b, Schema and phosphorylation site motif logos for ABL derived from PSPA experiments (a) and literature-annotated cellular substrates2 (b). c, Percentile-score distributions of substrates for their literature-annotated kinases2. Higher number of reports correlates with more favourable percentile-scores between the reported kinase and its substrate (AUCDF = area under the cumulative distribution function). The diagrams in a and b were created using BioRender.CC BY · PubMed Central
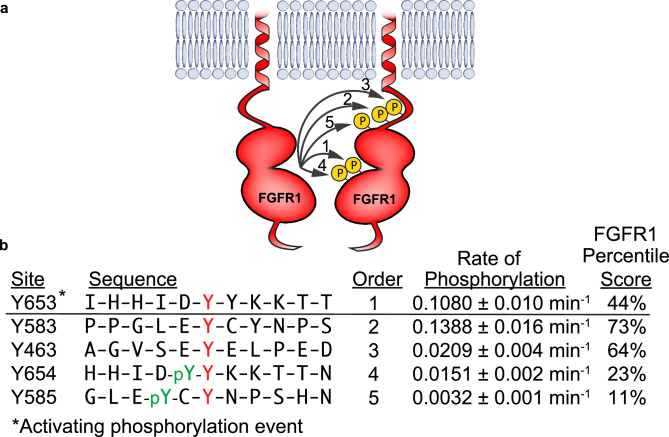
Extended Data Fig. 8 Correspondence between the order of RTK auto-trans-phosphorylation events and motif-based scores. a, Illustration of FGFR1 autophosphorylation. b, Reported rates and sequential order of auto-trans-phosphorylation of five Tyr sites on FGFR136 alongside their corresponding percentile scores for FGFR1’s PSSM. Noncentral Tyr residues were treated as phosphopriming events (that is, scored as pTyr) if they preceded the central Tyr in their reported order of phosphorylation36. Sites of phosphorylation are indicated in red. Priming phosphorylations are indicated in green.
Extended Data Fig. 8 Correspondence between the order of RTK auto-trans-phosphorylation events and motif-based scores. a, Illustration of FGFR1 autophosphorylation. b, Reported rates and sequential order of auto-trans-phosphorylation of five Tyr sites on FGFR136 alongside their corresponding percentile scores for FGFR1’s PSSM. Noncentral Tyr residues were treated as phosphopriming events (that is, scored as pTyr) if they preceded the central Tyr in their reported order of phosphorylation36. Sites of phosphorylation are indicated in red. Priming phosphorylations are indicated in green.CC BY · PubMed Central
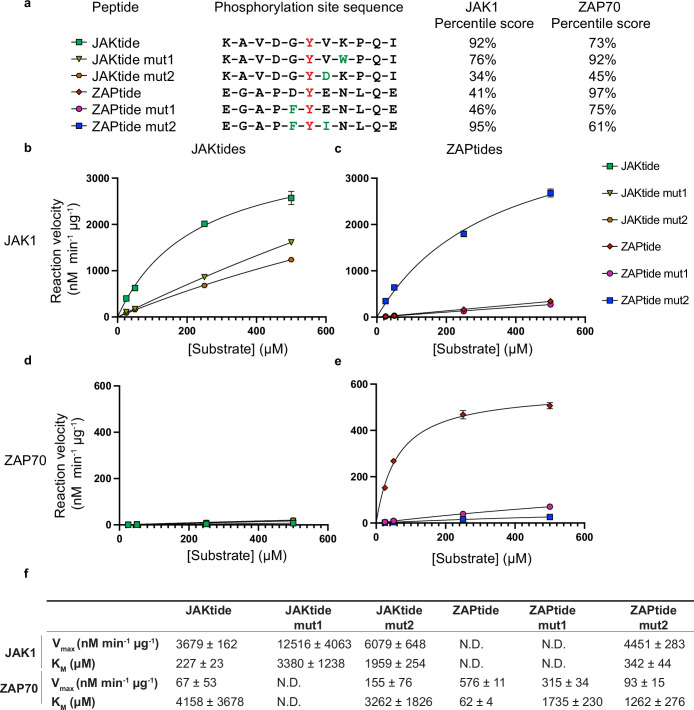
Extended Data Fig. 9 Kinetics of peptide phosphorylation by JAK1 and ZAP70. a, Sequences of Tyr substrate peptides. The peptides are modelled after JAK’s physiological substrate STAT5A Tyr694 (JAK-tide) and ZAP70’s physiological substrate LAT1 Tyr255 (ZAP-tide), with amino acid substitutions introduced at the indicated positions in green. Right, the corresponding percentile scores for each peptide based on the PSSMs of JAK1 and ZAP70. b-c, Kinetics of peptide phosphorylation by JAK1 on JAKtide substrates (b) and ZAPtide substrates (c). Best-fit lines illustrate fitting of the data points to Michaelis-Menten kinetics function using GraphPad Prism 10.1. Data shows mean values with error bars indicating the standard deviations of the data (n = 3 independent reactions). d-e, Kinetics of peptide phosphorylation by ZAP70 on JAKtide substrates (d) and ZAPtide substrates (e). Best-fit lines illustrate fitting of the data points to Michaelis-Menten kinetics function using GraphPad Prism 10.1. Data shows mean values with error bars indicating the standard deviations of the data (n = 3 independent reactions). f, Kinetic parameters for phosphorylation of the indicated peptides by JAK1 and ZAP70 in b-e. The standard errors of the linear fits are indicated (±). The corresponding experimental data for all these plots are presented in Supplementary Fig. 2.
Extended Data Fig. 9 Kinetics of peptide phosphorylation by JAK1 and ZAP70. a, Sequences of Tyr substrate peptides. The peptides are modelled after JAK’s physiological substrate STAT5A Tyr694 (JAK-tide) and ZAP70’s physiological substrate LAT1 Tyr255 (ZAP-tide), with amino acid substitutions introduced at the indicated positions in green. Right, the corresponding percentile scores for each peptide based on the PSSMs of JAK1 and ZAP70. b-c, Kinetics of peptide phosphorylation by JAK1 on JAKtide substrates (b) and ZAPtide substrates (c). Best-fit lines illustrate fitting of the data points to Michaelis-Menten kinetics function using GraphPad Prism 10.1. Data shows mean values with error bars indicating the standard deviations of the data (n = 3 independent reactions). d-e, Kinetics of peptide phosphorylation by ZAP70 on JAKtide substrates (d) and ZAPtide substrates (e). Best-fit lines illustrate fitting of the data points to Michaelis-Menten kinetics function using GraphPad Prism 10.1. Data shows mean values with error bars indicating the standard deviations of the data (n = 3 independent reactions). f, Kinetic parameters for phosphorylation of the indicated peptides by JAK1 and ZAP70 in b-e. The standard errors of the linear fits are indicated (±). The corresponding experimental data for all these plots are presented in Supplementary Fig. 2.CC BY · PubMed Central
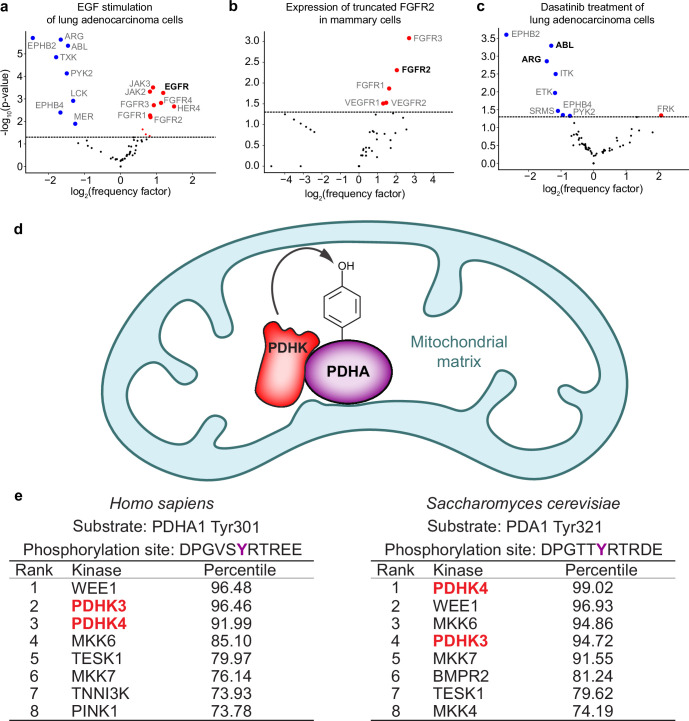
Extended Data Fig. 10 Motif-enrichment analysis of phosphoproteomics data and motif-scoring results for a suboptimal Tyr phosphorylation site on the pyruvate dehydrogenase complex. a, Motif-enrichment results from published datasets in cells after ligand stimulation (a), oncogenic mutation (b), or targeted inhibition (c) of Tyr kinases. a, A549 cells after 5 min treatment with 100 ng/mL EGF40. b, NMuMG cells after expression of FGFR2Δ18 mutant43. c, H2286 cells after treatment for 3 h with 1 μM dasatinib44. Kinases indicated in bold in a-c are discussed in the main text. The enrichments in a-c were determined using one-sided exact Fisher’s tests. d, Illustration of the mitochondrial-localized regulation of the pyruvate dehydrogenase complex by the PDHKs. e, Scoring results for human pyruvate dehydrogenase E1 component subunit alpha (PDHA1) Tyr301 and homologous site on the yeast ortholog PDA1, highlighting PDHK family members. Source data
Extended Data Fig. 10 Motif-enrichment analysis of phosphoproteomics data and motif-scoring results for a suboptimal Tyr phosphorylation site on the pyruvate dehydrogenase complex. a, Motif-enrichment results from published datasets in cells after ligand stimulation (a), oncogenic mutation (b), or targeted inhibition (c) of Tyr kinases. a, A549 cells after 5 min treatment with 100 ng/mL EGF40. b, NMuMG cells after expression of FGFR2Δ18 mutant43. c, H2286 cells after treatment for 3 h with 1 μM dasatinib44. Kinases indicated in bold in a-c are discussed in the main text. The enrichments in a-c were determined using one-sided exact Fisher’s tests. d, Illustration of the mitochondrial-localized regulation of the pyruvate dehydrogenase complex by the PDHKs. e, Scoring results for human pyruvate dehydrogenase E1 component subunit alpha (PDHA1) Tyr301 and homologous site on the yeast ortholog PDA1, highlighting PDHK family members. Source dataCC BY · PubMed Central

Verification

Claims the paper makes

The claims and statistics of this paper haven’t been checked yet.

Run the check — free, no account needed. It reads the open-access text and checks the sources it cites.

A few free checks a day · papers already verified open instantly · results are public

Claims other papers make about this one

Each is checked against this paper’s own text: does it say what the citing paper says it does?

Self-check

Percentages, sums and reported differences re-computed from the paper’s own numbers.

The self-check needs the paper’s full text.

Citations

Cites

Research works printed but not linked: 74

  1. Hunter, T. The genesis of tyrosine phosphorylation. Cold Spring Harb. Perspect. Biol. 6, a020644 (2014). · DOI
  2. Hornbeck, P. V. et al. 15 years of PhosphoSitePlus®: integrating post-translationally modified sites, disease variants and isoforms. Nucleic Acids Res. 47, D433–D441 (2019). · DOI
  3. Lemmon, M. A. & Schlessinger, J. Cell signaling by receptor tyrosine kinases. Cell 141, 1117–1134 (2010). · DOI · Paper page
  4. Shah, N. H., Amacher, J. F., Nocka, L. M. & Kuriyan, J. The Src module: an ancient scaffold in the evolution of cytoplasmic tyrosine kinases. Crit. Rev. Biochem. Mol. Biol. 53, 535–563 (2018). · DOI
  5. Shah, N. H. et al. An electrostatic selection mechanism controls sequential kinase signaling downstream of the T cell receptor. eLife 5, e20105 (2016). · DOI
  6. Li, A., Voleti, R., Lee, M., Gagoski, D. & Shah, N. H. High-throughput profiling of sequence recognition by tyrosine kinases and SH2 domains using bacterial peptide display. eLife 12, e82345 (2023). · DOI
  7. Rush, J. et al. Immunoaffinity profiling of tyrosine phosphorylation in cancer cells. Nat. Biotechnol. 23, 94–101 (2005). · DOI
  8. Rikova, K. et al. Global survey of phosphotyrosine signaling identifies oncogenic kinases in lung cancer. Cell 131, 1190–1203 (2007). · DOI · Paper page
  9. Gerritsen, J. S. & White, F. M. Phosphoproteomics: a valuable tool for uncovering molecular signaling in cancer cells. Expert Rev. Proteom. 18, 661–674 (2021). · DOI
  10. Eckhart, W., Hutchinson, M. A. & Hunter, T. An activity phosphorylating tyrosine in polyoma T antigen immunoprecipitates. Cell 18, 925–933 (1979). · DOI
  11. Hunter, T. & Sefton, B. M. Transforming gene product of Rous sarcoma virus phosphorylates tyrosine. Proc. Natl Acad. Sci. USA 77, 1311–1315 (1980). · DOI
  12. Druker, B. J. et al. Efficacy and safety of a specific inhibitor of the BCR-ABL tyrosine kinase in chronic myeloid leukemia. N. Engl. J. Med. 344, 1031–1037 (2001). · DOI
  13. Cohen, P., Cross, D. & Jänne, P. A. Kinase drug discovery 20 years after imatinib: progress and future directions. Nat. Rev. Drug Discov. 20, 551–569 (2021). · DOI
  14. Trenker, R. & Jura, N. Receptor tyrosine kinase activation: from the ligand perspective. Curr. Opin. Cell Biol. 63, 174–185 (2020). · DOI
  15. Sadowski, I., Stone, J. C. & Pawson, T. A noncatalytic domain conserved among cytoplasmic protein-tyrosine kinases modifies the kinase function and transforming activity of Fujinami sarcoma virus P130gag-fps. Mol. Cell. Biol. 6, 4396–4408 (1986). · DOI
  16. Yaffe, M. B. Phosphotyrosine-binding domains in signal transduction. Nat. Rev. Mol. Cell Biol. 3, 177–186 (2002). · DOI
  17. Lim, W. A. & Pawson, T. Phosphotyrosine signaling: evolving a new cellular communication system. Cell 142, 661–667 (2010). · DOI
  18. Needham, E. J., Parker, B. L., Burykin, T., James, D. E. & Humphrey, S. J. Illuminating the dark phosphoproteome. Science Signal. 12, eaau8645 (2019). · DOI
  19. Manning, G., Whyte, D. B., Martinez, R., Hunter, T. & Sudarsanam, S. The protein kinase complement of the human genome. Science 298, 1912–1934 (2002). · DOI · Paper page
  20. Sugiyama, N., Imamura, H. & Ishihama, Y. Large-scale discovery of substrates of the human kinome. Sci. Rep. 9, 10503 (2019). · DOI
  21. Van de Kooij, B. et al. Comprehensive substrate specificity profiling of the human Nek kinome reveals unexpected signaling outputs. eLife 8, e44635 (2019). · DOI
  22. Lagoutte, E. et al. LIMK regulates tumor-cell invasion and matrix degradation through tyrosine phosphorylation of MT1-MMP. Sci. Rep. 6, 24925 (2016). · DOI
  23. Kettenbach, A. N. et al. Rapid determination of multiple linear kinase substrate motifs by mass spectrometry. Chem. Biol. 19, 608–618 (2012). · DOI
  24. Mayer, B. J. Perspective: dynamics of receptor tyrosine kinase signaling complexes. FEBS Lett. 586, 2575–2579 (2012). · DOI
  25. Yeung, W. et al. Evolution of functional diversity in the holozoan tyrosine kinome. Mol. Biol. Evol. 38, 5625–5639 (2021). · DOI
  26. Sieg, D. J. et al. Pyk2 and Src-family protein-tyrosine kinases compensate for the loss of FAK in fibronectin-stimulated signaling events but Pyk2 does not fully function to enhance FAK− cell migration. EMBO J. 17, 5933–5947 (1998). · DOI
  27. Dawson, J. C., Serrels, A., Stupack, D. G., Schlaepfer, D. D. & Frame, M. C. Targeting FAK in anticancer combination therapies. Nat. Rev. Cancer 21, 313–324 (2021). · DOI
  28. Philips, R. L. et al. The JAK-STAT pathway at 30: much learned, much more to do. Cell 185, 3857–3876 (2022). · DOI
  29. Begley, M. J. et al. EGF-receptor specificity for phosphotyrosine-primed substrates provides signal integration with Src. Nat. Struct. Mol. Biol. 22, 983–990 (2015). · DOI
  30. Davis, T. L. et al. Structural recognition of an optimized substrate for the ephrin family of receptor tyrosine kinases. FEBS J. 276, 4395–4404 (2009). · DOI
  31. Courtney, A. H., Lo, W.-L. & Weiss, A. TCR signaling: mechanisms of initiation and propagation. Trends Biochem. Sci 43, 108–123 (2018). · DOI
  32. Yaffe, M. B. et al. A motif-based profile scanning approach for genome-wide prediction of signaling pathways. Nat. Biotechnol. 19, 348–353 (2001). · DOI · Paper page
  33. Yaron, T. M. et al. Host protein kinases required for SARS-CoV-2 nucleocapsid phosphorylation and viral replication. Sci. Signal. 15, eabm0808 (2022). · DOI
  34. Lew, E. D., Furdui, C. M., Anderson, K. S. & Schlessinger, J. The precise sequence of FGF receptor autophosphorylation is kinetically driven and is disrupted by oncogenic mutations. Sci. Signal. 2, ra6 (2009).
  35. Batth, T. S. et al. Large-scale phosphoproteomics reveals Shp-2 phosphatase-dependent regulators of Pdgf receptor signaling. Cell Rep. 22, 2784–2796 (2018). · DOI
  36. Budayeva, H. G. et al. Phosphoproteome profiling of the receptor tyrosine kinase MuSK identifies tyrosine phosphorylation of Rab GTPases. Mol. Cell. Proteom. 21, 100221 (2022). · DOI
  37. Kim, N. et al. Lrp4 is a receptor for Agrin and forms a complex with MuSK. Cell 135, 334–342 (2008). · DOI · Paper page
  38. Lundby, A. et al. Oncogenic mutations rewire signaling pathways by switching protein recruitment to phosphotyrosine sites. Cell 179, 543–560 (2019). · DOI
  39. Reckel, S. et al. Differential signaling networks of Bcr–Abl p210 and p190 kinases in leukemia cells defined by functional proteomics. Leukemia 31, 1502–1512 (2017). · DOI
  40. Wagner, S. A., Szczesniak, P. P., Voigt, A., Gräf, J. F. & Beli, P. Proteomic analysis of tyrosine phosphorylation induced by exogenous expression of oncogenic kinase fusions identified in lung adenocarcinoma. Proteomics 21, 2000283 (2021). · DOI
  41. Zingg, D. et al. Truncated FGFR2 is a clinically actionable oncogene in multiple cancers. Nature 608, 609–617 (2022). · DOI
  42. Ross, K. E. et al. Network models of protein phosphorylation, acetylation, and ubiquitination connect metabolic and cell signaling pathways in lung cancer. PLoS Comput. Biol. 19, e1010690 (2023). · DOI
  43. Lombardo, L. J. et al. Discovery of N-(2-chloro-6-methyl-phenyl)-2-(6-(4-(2-hydroxyethyl)-piperazin-1-yl)-2-methylpyrimidin-4-ylamino) thiazole-5-carboxamide (BMS-354825), a dual Src/Abl kinase inhibitor with potent antitumor activity in preclinical assays. J. Med. Chem. 47, 6658–6661 (2004). · DOI
  44. Yeh, C.-T. et al. Bruton’s tyrosine kinase (BTK) mediates resistance to EGFR inhibition in non-small-cell lung carcinoma. Oncogenesis 10, 56 (2021).
  45. Booth, L. et al. The afatinib resistance of in vivo generated H1975 lung cancer cell clones is mediated by SRC/ERBB3/c-KIT/c-MET compensatory survival signaling. Oncotarget 7, 19620 (2016). · DOI
  46. Sanchez-Vega, F. et al. EGFR and MET amplifications determine response to HER2 inhibition in ERBB2-amplified esophagogastric cancer. Cancer Discov. 9, 199–209 (2019). · DOI
  47. Levinson, N. M., Seeliger, M. A., Cole, P. A. & Kuriyan, J. Structural basis for the recognition of c-Src by its inactivator Csk. Cell 134, 124–134 (2008). · DOI
  48. Fan, J. et al. Tyr-301 phosphorylation inhibits pyruvate dehydrogenase by blocking substrate binding and promotes the Warburg effect. J. Biol. Chem. 289, 26533–26541 (2014). · DOI
  49. Songyang, Z. & Cantley, L. C. Recognition and specificity in protein tyrosine kinase-mediated signalling. Trends Biochem. Sci. 20, 470–475 (1995). · DOI
  50. Zhou, S. et al. SH2 domains recognize specific phosphopeptide sequences. Cell 72, 767–778 (1993). · DOI
  51. Li, L. et al. Prediction of phosphotyrosine signaling networks using a scoring matrix-assisted ligand identification approach. Nucleic Acids Res. 36, 3263–3273 (2008). · DOI
  52. Shan, X. & Wange, R. L. Itk/Emt/Tsk activation in response to CD3 cross-linking in Jurkat T cells requires ZAP-70 and Lat and is independent of membrane recruitment. J. Biol. Chem. 274, 29323–29330 (1999). · DOI
  53. Salojin, K. V., Zhang, J., Meagher, C. & Delovitch, T. L. ZAP-70 is essential for the T cell antigen receptor-induced plasma membrane targeting of SOS and Vav in T cells. J. Biol. Chem. 275, 5966–5975 (2000). · DOI
  54. Plowman, G. D., Sudarsanam, S., Bingham, J., Whyte, D. & Hunter, T. The protein kinases of Caenorhabditis elegans: a model for signal transduction in multicellular organisms. Proc. Natl Acad. Sci. USA 96, 13603–13610 (1999). · DOI
  55. Joughin, B. A., Liu, C., Lauffenburger, D. A., Hogue, C. W. & Yaffe, M. B. Protein kinases display minimal interpositional dependence on substrate sequence: potential implications for the evolution of signalling networks. Philos. Trans. R. Soc. B 367, 2574–2583 (2012). · DOI
  56. Suga, H. & Miller, W. T. Src signaling in a low-complexity unicellular kinome. Sci. Rep. 8, 5362 (2018). · DOI
  57. Miller, M. L. et al. Linear motif atlas for phosphorylation-dependent signaling. Sci. Signal. 1, ra2 (2008). · DOI
  58. Chen, M. J., Dixon, J. E. & Manning, G. Genomics and evolution of protein phosphatases. Sci. Signal. 10, eaag1796 (2017). · DOI
  59. Wynn, R. M., Davie, J. R., Cox, R. P. & Chuang, D. T. Chaperonins groEL and groES promote assembly of heterotetramers (alpha 2 beta 2) of mammalian mitochondrial branched-chain alpha-keto acid decarboxylase in Escherichia coli. J. Biol. Chem. 267, 12400–12403 (1992). · DOI
  60. Song, J.-L., Li, J., Huang, Y.-S. & Chuang, D. T. Encapsulation of an 86-kDa assembly intermediate inside the cavities of GroEL and its single-ring variant SR1 by GroES. J. Biol. Chem. 278, 2515–2521 (2003). · DOI
  61. Park, J. M. et al. The nonreceptor tyrosine kinase SRMS inhibits autophagy and promotes tumor growth by phosphorylating the scaffolding protein FKBP51. PLoS Biol. 19, e3001281 (2021). · DOI
  62. Wickham, H. ggplot2: Elegant Graphics for Data Analysis (Springer, 2016). · DOI
  63. Wagih, O. ggseqlogo: a versatile R package for drawing sequence logos. Bioinformatics 33, 3645–3647 (2017). · DOI
  64. Modi, V. & Dunbrack Jr, R. L. A structurally-validated multiple sequence alignment of 497 human protein kinase domains. Sci. Rep. 9, 19790 (2019).
  65. Metz, K. S. et al. Coral: clear and customizable visualization of human kinome data. Cell Syst. 7, 347–350 (2018). · DOI
  66. Pettersen, E. F. et al. UCSF ChimeraX: structure visualization for researchers, educators, and developers. Protein Sci. 30, 70–82 (2021). · DOI
  67. Hubbard, S. R., Wei, L. & Hendrickson, W. A. Crystal structure of the tyrosine kinase domain of the human insulin receptor. Nature 372, 746–754 (1994). · DOI
  68. Glassman, C. R. et al. Structure of a Janus kinase cytokine receptor complex reveals the basis for dimeric activation. Science 376, 163–169 (2022). · DOI
  69. Chen, X. et al. Crystal structure of a tyrosine phosphorylated STAT-1 dimer bound to DNA. Cell 93, 827–839 (1998). · DOI
  70. Endres, N. F. et al. Conformational coupling across the plasma membrane in activation of the EGF receptor. Cell 152, 543–556 (2013). · DOI
  71. Lu, C. et al. Structural evidence for loose linkage between ligand binding and kinase activation in the epidermal growth factor receptor. Mol. Cell. Biol. 30, 5432–5443 (2010). · DOI
  72. Nagar, B. et al. Crystal structures of the kinase domain of c-Abl in complex with the small molecule inhibitors PD173955 and imatinib (STI-571). Cancer Res. 62, 4236–4243 (2002).
  73. Waksman, G. et al. Crystal structure of the phosphotyrosine recognition domain SH2 of v-src complexed with tyrosine-phosphorylated peptides. Nature 358, 646–653 (1992). · DOI
  74. Modi, V. & Dunbrack Jr, R. L. Kincore: a web resource for structural classification of protein kinases and their inhibitors. Nucleic Acids Res. 50, D654–D664 (2022). · DOI · Paper page

Cited by

Sorted by citations

See all 189

Metadata

Authors
Yaron-Barir, T. M., Joughin, B. A., Huntsman, E. M., Kerelsky, A., Cizin, D. M., Cohen, B. M., Regev, A., Song, J., Vasan, N., Lin, T.-Y., Orozco, J. M., Schoenherr, C., Sagum, C., Bedford, M. T., Wynn, R. M., Tso, S.-C., Chuang, D. T., Li, L., Li, S. S.-C., Creixell, P., Krismer, K., Takegami, M., Lee, H., Zhang, B., Lu, J., Cossentino, I., Landry, S. D., Uduman, M., Blenis, J., Elemento, O., Frame, M. C., Hornbeck, P. V., Cantley, L. C., Turk, B. E., Yaffe, M. B., & Johnson, J. L.
Venue
Nature
Published
2024-05-08
Volume
629
Issue
8014
Pages
1174-1181
ISSN
  • 0028-0836
  • 1476-4687
Cited by
189
References
4
Language
en

About these checks

Registry, retraction, Cites and statistics results are computed, not judged, with one exception: a printed reference that no index lists is read once by a model before it counts as a citation error. Claims are extracted by a model and kept only when their quote appears verbatim in the text; each cited source is then checked, with a model’s help, for whether it says what the claim relies on. Those verdicts can be wrong — read the claim’s quote and the cited source before relying on one.

Statistics and arithmetic are recomputed, not judged.

Confidence bands are shown only for fields calibrated on our annotated test set. None is calibrated yet, so no band is shown.

What counts as a claim ›How we measure confidence ›How we check this ›

Are you an author, or do you see a problem with this page? Request a review