

The DOI matches its Crossref record; 64 of the 64 references it cites were found in a registry or an index.
High-throughput microbial culturomics using automation and machine learning
Open accessAbstract
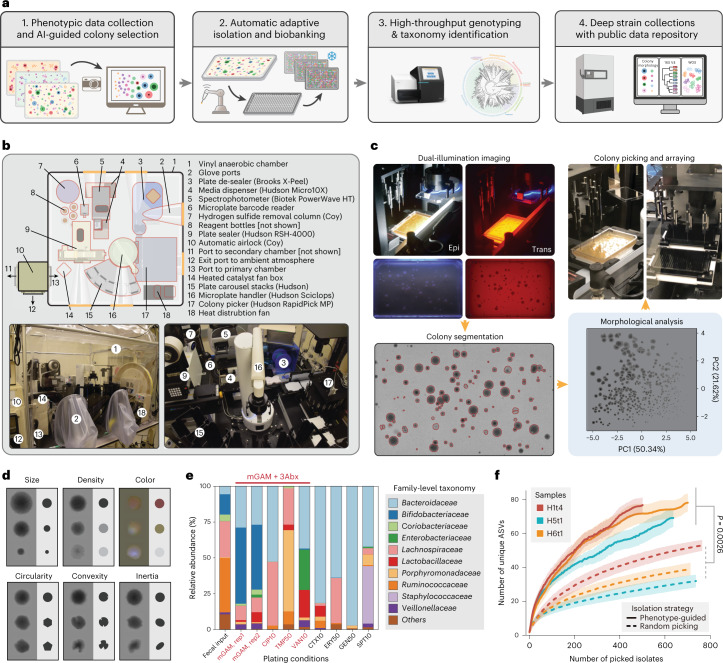
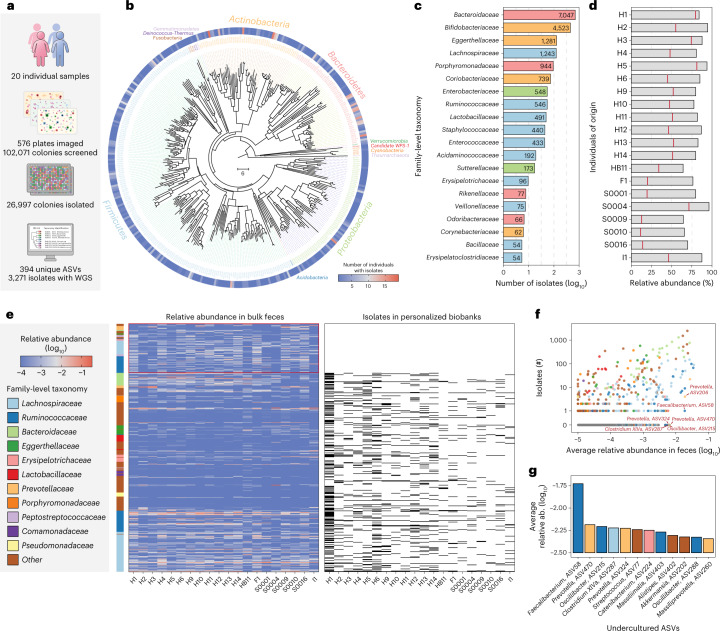
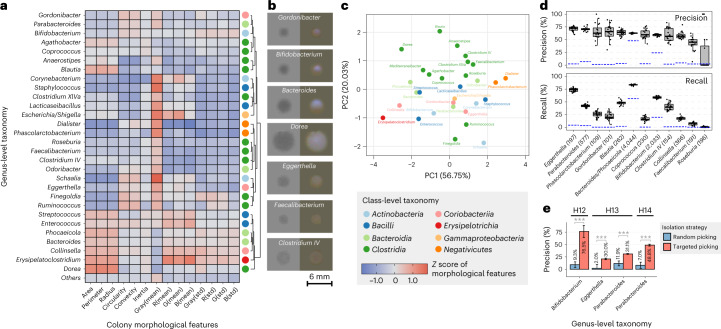
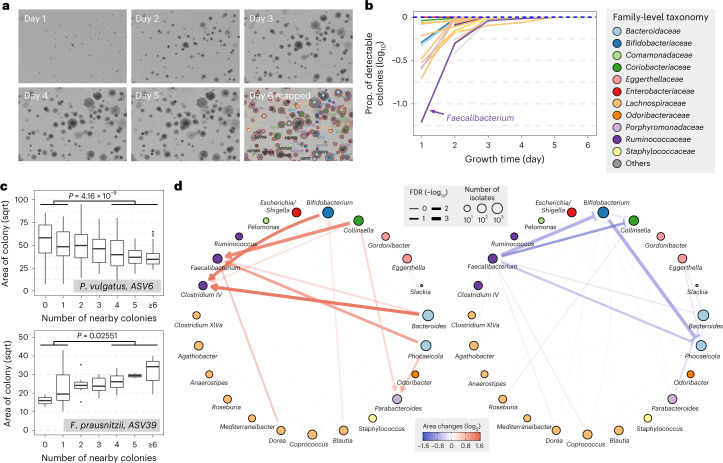
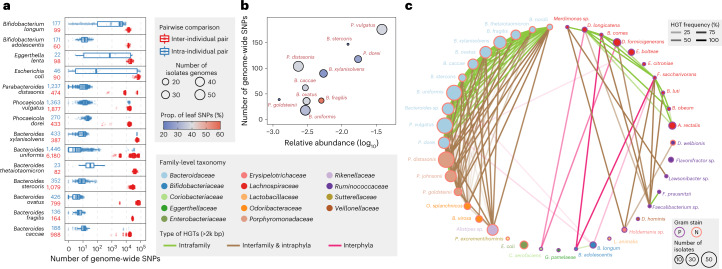
Pure bacterial cultures remain essential for detailed experimental and mechanistic studies in microbiome research, and traditional methods to isolate individual bacteria from complex microbial ecosystems are labor-intensive, difficult-to-scale and lack phenotype-genotype integration. Here we describe an open-source high-throughput robotic strain isolation platform for the rapid generation of isolates on demand. We develop a machine learning approach that leverages colony morphology and genomic data to maximize the diversity of microbes isolated and enable targeted picking of specific genera. Application of this platform on fecal samples from 20 humans yields personalized gut microbiome biobanks totaling 26,997 isolates that represented >80% of all abundant taxa. Spatial analysis on >100,000 visually captured colonies reveals cogrowth patterns between Ruminococcaceae, Bacteroidaceae, Coriobacteriaceae and Bifidobacteriaceae families that suggest important microbial interactions. Comparative analysis of 1,197 high-quality genomes from these biobanks shows interesting intra- and interpersonal strain evolution, selection and horizontal gene transfer. This culturomics framework should empower new research efforts to systematize the collection and quantitative analysis of imaging-based phenotypes with high-resolution genomics data for many emerging microbiome studies.
Overview
The claims and statistics of this paper haven’t been checked yet.
Run the check — free, no account needed. It reads the open-access text and checks the sources it cites.
Integrity signals
Registry
Cites
Statistics
Figures
Verification
Claims the paper makes
The claims and statistics of this paper haven’t been checked yet.
Run the check — free, no account needed. It reads the open-access text and checks the sources it cites.
Claims other papers make about this one
Each is checked against this paper’s own text: does it say what the citing paper says it does?
In the citing paper
“However, particularly for the gut microbiome, largescale cultivation projects 134 and massive metagenomic assembly efforts 135 are quickly expanding and completing reference databases needed for taxonomic profiling tools. 136”
From Key determinants of success in fecal microbiota transplantation: From microbiome to clinic (2023) · cites this paper as [134]
Self-check
Percentages, sums and reported differences re-computed from the paper’s own numbers.
The self-check needs the paper’s full text.
Citations
Cites
The Sequence Alignment/Map format and SAMtools
Li, H., Handsaker, B., Wysoker, A., Fennell, T., Ruan, J., Homer, N., Marth, G., Abecasis, G., Durbin, R., & 1000 Genome Project Data Processing Subgroup (2009) · Bioinformatics · doi:10.1093/bioinformatics/btp352 · Cited by 62,041
Fast gapped-read alignment with Bowtie 2
Langmead, B., & Salzberg, S. L. (2012) · Nature Methods · doi:10.1038/nmeth.1923 · Cited by 56,400
MUSCLE: multiple sequence alignment with high accuracy and high throughput
Edgar, R. C. (2004) · Nucleic Acids Research · doi:10.1093/nar/gkh340 · Cited by 44,662
MEGA X: Molecular Evolutionary Genetics Analysis across Computing Platforms
Kumar, S., Stecher, G., Li, M., Knyaz, C., & Tamura, K. (2018) · Molecular Biology and Evolution · doi:10.1093/molbev/msy096 · Cited by 37,683
BLAST+: architecture and applications
Camacho, C., Coulouris, G., Avagyan, V., Ma, N., Papadopoulos, J., Bealer, K., & Madden, T. L. (2009) · BMC Bioinformatics · doi:10.1186/1471-2105-10-421 · Cited by 22,074
Search and clustering orders of magnitude faster than BLAST
Edgar, R. C. (2010) · Bioinformatics · doi:10.1093/bioinformatics/btq461 · Cited by 21,098
Naive Bayesian Classifier for Rapid Assignment of rRNA Sequences into the New Bacterial Taxonomy
Wang, Q., Garrity, G. M., Tiedje, J. M., & Cole, J. R. (2007) · Applied and Environmental Microbiology · doi:10.1128/aem.00062-07 · Cited by 20,145
Prokka: rapid prokaryotic genome annotation
Seemann, T. (2014) · Bioinformatics · doi:10.1093/bioinformatics/btu153 · Cited by 18,937
Parks, D. H., Imelfort, M., Skennerton, C. T., Hugenholtz, P., & Tyson, G. W. (2015) · Genome Research · doi:10.1101/gr.186072.114 · Cited by 12,496
QUAST: quality assessment tool for genome assemblies
Gurevich, A., Saveliev, V., Vyahhi, N., & Tesler, G. (2013) · Bioinformatics · doi:10.1093/bioinformatics/btt086 · Cited by 11,172
Research works printed but not linked: 1
- Huang, Y. et al. High-throughput microbial culturomics using automation and machine learning. WGS of isolates collection. Sequence Read Archive. https://www.ncbi.nlm.nih.gov/bioproject/PRJNA745993 (2023).
Cited by
Sorted by citations
Items 201–286 of 286
Chaboy‐Cansado, R., Talavera‐Marcos, S., Gallego, R., Cobeta, P., Roscales, G., Rastrojo, A., & de Cárcer, D. A. (2025) · iMetaOmics. · doi:10.1002/imo2.70037 · Cited by 1
Zwicky, S. N., Mordasini, L., Spari, D., Yılmaz, B., & Beldi, G. (2025) · Journal of Translational Medicine · doi:10.1186/s12967-025-06462-x · Cited by 2
Exploring New Species of Lactic Acid Bacteria in Fermented Foods: A Case Study of Zha‐Chili
Qu, D., Wang, Y., Yan, L., Hou, Q., Zhao, H., & Guo, Z. (2025) · Food Science & Nutrition · doi:10.1002/fsn3.71090 · Cited by 1
Machine learning for personalized antimicrobial susceptibility breakpoints
Zhong, Y., Hope, W. W., Buchan, I. E., Velluva, A., Gerada, A., Rosato, C., Green, P. L., & Howard, A. (2025) · Journal of Antimicrobial Chemotherapy · doi:10.1093/jac/dkaf419 · Cited by 1
A State of the Art on Applications, Recent Challenges, and Future Trends of Artificial Intelligence
Kumari, S. S., & Priyadharsini, S. S. (2025) · International Conference on Power, Instrumentation, Control and Computing (PICC) · doi:10.1109/picc67314.2025.11291239 · Cited by 1
High-throughput single-cell isolation of Bifidobacterium strains from the human gut microbiome
Ha, L. H., On, Y. Y., Pohan, C., Lee, J., How, S. H. C., Teo, Y., Seedorf, H., Gounot, J.-S., & Nagarajan, N. (2025) · Microbiology Spectrum · doi:10.1128/spectrum.03033-25 · Cited by 1
Solution‐Processable Perovskite Solar Cells in Ambient: From Mechanism to Strategy
Tu, Y., Zhou, Z., Zang, Y., Song, J., Li, Z., & Yan, W. (2026) · Small · doi:10.1002/smll.202514157 · Cited by 1
SAMMBA is a high-throughput pipeline for isolating and phenotyping macroalgal strains
Alves-Lima, C., Barreto, L. M., Mónico, C., Gouvêa, L. P., Félix, F., Varga, B., Filipe, J., Camacho, R. M. B. A., Lymperaki, M. M., Alberto, F., et al. (2026) · Algal Research · doi:10.1016/j.algal.2026.104547 · Cited by 1
Rapp, J., Verhülsdonk, A., Garcke, A., Stadelmann, A., Farke, N., Troßmann, F., Kronenberger, T., Alvarado, A., Petras, D., & Link, H. (2026) · Cell Systems · doi:10.1016/j.cels.2025.101518 · Cited by 1
Microbial interactions as modular: Implications for ecosystem dynamics and evolution
Henderson, A. D., Schubert, O. T., van Vliet, S., & Ackermann, M. (2026) · Ecological Monographs · doi:10.1002/ecm.70072 · Cited by 1
Chen, X., Wang, J., Tang, L., Zeng, Z., Gao, D., 伊媛琪, Qin, L., Xiao, Y., Yang, H., & Yang, B. (2026) · Plants · doi:10.3390/plants15142118 · Cited by 1
Multi‐omics–driven precision medicine
Li, H., Zhao, Z., Zhang, Y., Ma, Y., Hu, G., Zeng, M., Yang, Z., Zhao, Z., Zhou, X., Hu, W., et al. (2026) · iMeta · doi:10.1002/imt2.70165 · Cited by 1
Self-citationValeri, J. A., Krishnan, A., & Collins, J. J. (2023) · Nature Microbiology · doi:10.1038/s41564-023-01390-2 · Cited by 1
Predicting microbial genome-scale metabolic networks directly from 16S rRNA gene sequencesPreprint
Øyås, O., Kobel, C. M., Vik, J. O., & Pope, P. B. (2024) · bioRxiv (Cold Spring Harbor Laboratory) · doi:10.1101/2024.01.26.576649 · Cited by 1
A widespread gut bacterial lineage distinguished by redox metabolism and phage defensePreprint
Noecker, C. A., Guo, L., Daté, C., Rai, N., Daramy, F., Hernandez, L. A. R., Kyaw, T. S., Trepka, K. R., Gupta, C. L., Ha, C. W. Y., et al. (2026) · bioRxiv (Cold Spring Harbor Laboratory) · doi:10.64898/2026.03.31.715625 · Cited by 1
Engineering Microbial Communities: Frontier Science for the Bioeconomy Workshop Series
Cregger, M., Silberg, J. J., Bonito, G., Henry, C., Hofmockel, K., O’Malley, M., & You, L. (2025) · OSTI OAI (U.S. Department of Energy Office of Scientific and Technical Information) · doi:10.2172/2589381 · Cited by 1
Simonin, M., Guschinskaya, N., Marchi, M., Marais, C., Préveaux, A., Briand, M., Kavunu, N., Bosc-Bierne, A., Labourgade, L., Dutrieux, C., et al. (2026) · bioRxiv (Cold Spring Harbor Laboratory) · doi:10.64898/2026.04.29.721552 · Cited by 1
Modelling Institutional Values Transmission through a Comparative Case study of Three Schools
Trubshaw, D. M. (2014) · University of Derby Online Research Archive. (University of Derby) · doi:10.13140/rg.2.2.12552.62724
Nedyalkova, M., Demirci, G., Cortat, Y., Schindler, K., Rhamani, F., Pavić, A., Zobi, F., & Lattuada, M. (2023) · ChemRxiv · doi:10.26434/chemrxiv-2023-6hngt
Nedyalkova, M., Demirci, G., Cortat, Y., Schindler, K., Rhamani, F., Pavić, A., Zobi, F., & Lattuada, M. (2023) · ChemRxiv · doi:10.26434/chemrxiv-2023-6hngt-v2
Nedyalkova, M., Demirci, G., Cortat, Y., Schindler, K., Rhamani, F., Horner, J., Crochet, A., Pavić, A., Mamula, O., Zobi, F., et al. (2023) · Research Square · doi:10.21203/rs.3.rs-3457929/v1
Heat Stress and Cultivable Intestinal Bacteria of Lehmann Brown Hens
Harutyunyan, N., Chitchyan, Z. T., Բադալյան, Մ., & Pepoyan, A. (2024) · AgriScience and Technology · doi:10.52276/25792822-2023.4-359
Chou, W., Guo, X., Wang, L., Xing, X., Wang, Y., & Zhang, C. (2025) · Journal of Visualized Experiments · doi:10.3791/67925
Gut Microbiota and Future Research Directions
Gayen, S., Chattopadhyay, S., Hazra, R., Mallick, A., & Roy, S. (2025) · BENTHAM SCIENCE PUBLISHERS eBooks · doi:10.2174/9789815324549125010014
Precision culturomics enabled by unlabeled single-cell morphology and Raman spectra
Liang, Q., Lan, X., Wu, J., Wei, W., Li, L. Y., Tang, X., Zhao, G., Guo, R., & Jia, H. (2026) · Nature Communications · doi:10.1038/s41467-026-74582-z
Large-scale culturing of the tree microbiome enables targeted disease suppressionPreprint
Ordonez, A., Cambon, M. C., Downie, J., Kajamuhan, A., Hussain, U., Crampton, B. G., Richardson, M. K., Jones, M., Green, R., Pettifor, B. J., et al. (2025) · bioRxiv (Cold Spring Harbor Laboratory) · doi:10.1101/2025.11.18.689053
Self-citationAn Intelligent Strategy for Colony De-Replication Using Raman Spectroscopy and Hybrid Clustering
Li, X., Liu, M., Sun, J., & Wang, S. (2025) · Fermentation · doi:10.3390/fermentation11120691
Jiang, M.-Z., Zhang, Z., Wang, Z., Zhu, X., Abdugheni, R., Jiang, H., Wang, Y., Wang, Z., Zhang, L., Cheng, Y., et al. (2026) · MicrobiologyOpen · doi:10.1002/mbo3.70224
Teng, X., Sun, Q., Jing, G., Duan, Y., Wang, X., Yi, X., Wu, C., Zhu, H., Xu, J., Zheng, X., et al. (2026) · bioRxiv (Cold Spring Harbor Laboratory) · doi:10.64898/2026.02.13.705682
Microbial ecology for all: A vision of accessibility, unity, and responsibility
Sorouri, B., Bernardin, J. R., Favier, A. I., Garces, K. R., McMullen, J. G., & McGuire, R. M. (2026) · Ecology · doi:10.1002/ecy.70342
Definition and importance of the human microbiome
Gupta, A., Syed, M., Choudhury, A., Narad, P., & Sengupta, A. (2026) · Elsevier eBooks · doi:10.1016/b978-0-443-40483-2.00053-4
Miho, E., Marquez, S., Stervbo, U., Mertz, K. D., Kruta, J., Schkommodau, E., & Meysman, P. (2026) · Journal of Translational Medicine · doi:10.1186/s12967-026-07693-2
Computational modeling of biotic interactions structure and function in marine plankton ecosystems
Gaudin, M. (2024) · theses.fr (ABES) · doi:10.70675/62554a42z2b8cz4abez8fb5zc3b7684202b9
Investigating Marine Mass Mortality Using Rapid Nucleic Acid Sequencing and Artificial Intelligence
Hewson, I., & Rede, J. E. (2026) · Oxford University Press eBooks · doi:10.1093/9780197790847.003.0003
Advancing the study of microbial symbionts of amphibians and reptiles
Doolin, M. L., & Woodhams, D. C. (2026) · Frontiers in Amphibian and Reptile Science · doi:10.3389/famrs.2026.1810202
Carco, C., Young, W., Mullaney, J. A., Heenan, P. E., Gearry, R. B., Forbes‐Blom, E., Keenan, J. I., Talley, N. J., Crispie, F., Cotter, P. D., et al. (2026) · Heliyon · doi:10.1016/j.heliyon.2026.e44952
Olayo-Gordillo, A. S., Ramírez-Malule, H., & Ríos, D. G. (2026) · Journal of Applied Biology & Biotechnology · doi:10.7324/jabb.2026.289589
Zhu, Y., Luo, S., Luo, Y., Guo, Z., Jiang, Y., Ma, Q., Fu, X., Zheng, C., You, F., Kuang, Q., et al. (2026) · Virulence · doi:10.1080/21505594.2026.2673632
Challenges, Limitations, and Future Directions in Microbial Deciphering
Sobti, R. C., & Khan, M. A. (2026) · Springer eBooks · doi:10.1007/978-981-95-8840-4_10
Microbial biobanking: safeguarding the tiny treasures for sustainable human welfare
Lagashetti, A. C., Teotia, A. K., Thota, P., Pandey, M. K., & Kalaiselvan, V. (2026) · Folia Microbiologica · doi:10.1007/s12223-026-01518-x
Microbial Dark Matter, A Multi-layer Mystery
Ma, X., Wu, E., Guo, Y., Wei, Z., Zhou, Q., Voigt, A. Y., Liu, Y., Shen, X., Feng, L., Ismail, S. A., et al. (2026) · Phenomics · doi:10.1007/s43657-026-00311-7
Suzuki, H., Détain, A., Flet, O., Ballanger, T., Anilkumar, A., Corniaux, N., Holm, J., Donat, C., Posewitz, M. C., & Hulatt, C. J. (2026) · bioRxiv (Cold Spring Harbor Laboratory) · doi:10.64898/2026.06.14.731673
Liu, Y., Wang, K.-L., Hong, Y., Yuan, Y., Wang, H. B., Chen, Y., Yu, S.-S., Lu, Z.-X., Pan, Y., & Zhu, T. (2026) · Environmental Pollution · doi:10.1016/j.envpol.2026.128591
Self-citationWang, G., Su, J., Lv, Z., Xu, Y., & Zhao, M. (2026) · Research Square · doi:10.21203/rs.3.rs-9819081/v1
Zhao, W. H., Zhu, L., Song, L., Liu, H., Lu, Z., Zhao, D., Wang, J., Qi, T., Zhang, J. C., Gong, W., et al. (2026) · Medical Review · doi:10.1515/mr-2026-0023
Perera, T. (2026) · Elsevier eBooks · doi:10.1016/b978-0-443-40362-0.00006-x
Dobrinin, M. (2026) · Queensland University of Technology · doi:10.5204/thesis.eprints.266509
Martín-Cuadrado, A.-B., Haro-Moreno, J. M., & Rodríguez‐Valera, F. (2026) · bioRxiv (Cold Spring Harbor Laboratory) · doi:10.64898/2026.06.30.735289
Synthetic ecology of coastal ecosystems
Qian, L., Su, R., Wang, W., Yan, B., Qiu, L., Zhao, Z., Yang, X., Li, Y., Ding, C., Hu, R., et al. (2026) · Cell Reports · doi:10.1016/j.celrep.2026.117665
Plant holobionts in a changing climate: Genome–microbiome integration for sustainable food systems
Sharma, M., Prabhakar, S. S., Ankem, H. C., Laishram, P., Tagra, D., Yumnam, S., Devi, G., Sharma, N., & Kumar, A. (2026) · Total Environment Microbiology · doi:10.1016/j.temicr.2026.100098
Enagbonma, B. J., & Babalola, O. O. (2026) · IGI Global eBooks · doi:10.4018/979-8-2600-2100-2.ch002
Liu, W., Tang, Q., Shen, M., Zhang, L., & Jia, X. (2026) · Applied Microbiology and Biotechnology · doi:10.1007/s00253-026-13917-8
ColonyInsight automated workflow reveals complex dominance in mixed yeast colonies
Gaizer, T., Gaizer, B. T., Pillér, B., Madár, V., Juhász, J., Csikász‐Nagy, A., & Pongor, C. I. (2026) · iScience · doi:10.1016/j.isci.2026.116639
Yeni, D. K., Güven, D., BÜYÜK, F., & Gökmen, M. C. (2026) · Journal of Microbiological Methods · doi:10.1016/j.mimet.2026.107638
Eggerthella lenta: metabolism, pathogenesis and therapeutic implications
Rock, R. R., Zhang, S., Noecker, C. A., & Turnbaugh, P. J. (2026) · Nature Reviews Microbiology · doi:10.1038/s41579-026-01344-5 · Cited by 1
Chen, W., Zhong, K., Li, L., Liu, Y., Wang, H., Qian, D., & Ma, H. (2026) · Journal of Applied Microbiology · doi:10.1093/jambio/lxag100
Self-citationKirchman, D. L., & Shade, A. L. (2026) · Oxford University Press eBooks · doi:10.1093/9780197831632.003.0010
Kirchman, D. L., & Shade, A. L. (2026) · Oxford University Press eBooks · doi:10.1093/9780197831632.003.0009
Elements, Biochemicals, and Cellular Structures
Kirchman, D. L., & Shade, A. L. (2026) · Oxford University Press eBooks · doi:10.1093/9780197831632.003.0002
Kirchman, D. L., & Shade, A. L. (2026) · Oxford University Press eBooks · doi:10.1093/9780197831632.003.0004
The Physical-Chemical Environment
Kirchman, D. L., & Shade, A. L. (2026) · Oxford University Press eBooks · doi:10.1093/9780197831632.003.0003
Kirchman, D. L., & Shade, A. L. (2026) · Oxford University Press eBooks · doi:10.1093/9780197831632.002.0004
Kirchman, D. L., & Shade, A. L. (2026) · Oxford University Press eBooks · doi:10.1093/9780197831632.003.0005
Kirchman, D. L., & Shade, A. L. (2026) · Oxford University Press eBooks · doi:10.1093/9780197831632.003.0001
Kirchman, D. L., & Shade, A. L. (2026) · Oxford University Press eBooks · doi:10.1093/9780197831632.003.0006
Kirchman, D. L., & Shade, A. L. (2026) · Oxford University Press eBooks · doi:10.1093/9780197831632.003.0013
Kirchman, D. L., & Shade, A. L. (2026) · Oxford University Press eBooks · doi:10.1093/9780197831632.003.0015
Kirchman, D. L., & Shade, A. L. (2026) · Oxford University Press eBooks · doi:10.1093/9780197831632.003.0012
Kishore, D., Ranjan, P., Neely, C. J., Cashman, M., Sakkaff, Z., Riehl, W. J., Joachimiak, M. P., Edirisinghe, J. N., Faria, J. P., Weisenhorn, P. B., et al. (2026) · bioRxiv (Cold Spring Harbor Laboratory) · doi:10.64898/2026.08.06.743333
Self-driving labs: A new paradigm in cell culture
Grzelak, N. L., Gadsden, S. A., & Selvaganapathy, P. R. (2026) · Expert Systems with Applications · doi:10.1016/j.eswa.2026.134110
A roadmap to create FAIR collections of microbial strains
Hitch, T. C. A., Sakamoto, M., Overmann, J., & Clavel, T. (2026) · Nature Microbiology · doi:10.1038/s41564-026-02446-9
Automated microbial recognition from gram-stained micrographs via CNN and metadata decision support
Erarslan, A., Ciftci, F., & Rahebi, J. (2026) · Frontiers in Cellular and Infection Microbiology · doi:10.3389/fcimb.2026.1811365
Shakri, A. R., Mishra, S. P., Lawless, S., Pani, S., Mishra, P., Page, C. L., Dutta, G., & Sharma, C. (2026) · Vaccines · doi:10.3390/vaccines14090791
Sequencing-Based Microbiome Profiling
Camarinha‐Silva, A., Schirmer, M., & Fricke, W. F. (2026) · Springer eBooks · doi:10.1007/978-3-032-26410-7_4
Accelerating natural product discovery, characterization and engineering by biofoundries
Hu, L., Pan, Y., & Zhao, H. (2026) · Natural Product Reports · doi:10.1039/d6np00061d
Lu, J., Xuan, M., Yu, L., Xie, Z., Chu, Q., Wei, S., Wang, T., Xue, C., & Li, L. (2026) · MedComm · doi:10.1002/mco2.70994
The benefits and biases of artificial intelligence in microbiology
Aransiola, S. A., Onyinoyi, A. H., Akhigbe, J. O., Onoruoiza, S. I., Esenogho, E., & Maddela, N. R. (2026) · Computational Biology and Chemistry · doi:10.1016/j.compbiolchem.2026.109457
Wang, Y., Liu, H., Chen, J., Zeng, X., & Wang, J. (2026) · ASM Food Microbiology · doi:10.1128/asmfm.00014-26
Li, H., Yan, X., Yue, W., Ao, D., Zhang, S., Cai, Z., & Zhang, Y. (2026) · Biochemical Engineering Journal · doi:10.1016/j.bej.2026.110435
No strain, no gain: within-host bacterial microdiversity and human health
Wojtkowiak, A., Shinfuku, M. S., & Lewin, G. R. (2026) · Infection and Immunity · doi:10.1128/iai.00062-26
Liu, Y., Cheng, X., Wang, Q., Huang, Q., Xue, C., & Wei, Z. (2026) · Trends in Food Science & Technology · doi:10.1016/j.tifs.2026.106164
Microfluidic cultivation enables probiotic growth under thermal stressPreprint
Karimi, A., Yaghoobi, M., Zhang, S., Flock, G. H., Ahnrud, G. P., Marek, P. J., Simpson, K. W., & Abbaspourrad, A. (2026) · bioRxiv (Cold Spring Harbor Laboratory) · doi:10.64898/2026.10.23.761394
Studying Unculturable Diversity from Extreme Environments
Lavanya, A. K., Darshan, K., Meena, K., Majumdar, B., Rani, V., Dakhore, R., Kar, G., Mohan, N., Manjunatha, B. S., Sharma, L. K., et al. (2026) · Springer protocols handbooks/Springer protocols · doi:10.1007/978-1-0716-5595-5_5
Fruit microbiome: from descriptive profiling to functional understanding and applications
Hou, H., Zeng, M., Lyu, H., Qu, H., Wicaksono, W. A., Zhang, T., Yang, J., Yousuf, S., Jiang, Y., Berg, G., et al. (2026) · aBIOTECH · doi:10.1016/j.abiote.2026.100110
Wang, H., Mohamad, O. A. A., Li, K., Guo, D., Huang, M., Peng, Z., Wang, P., Zhang, D., Li, J., Li, W., et al. (2026) · Journal of Systematics and Evolution · doi:10.1111/jse.70117
Self-citation
Metadata
- Authors
- Huang, Y., Sheth, R. U., Zhao, S., Cohen, L. A., Dabaghi, K., Moody, T., Sun, Y., Ricaurte, D., Richardson, M., Velez-Cortes, F., Blazejewski, T., Kaufman, A., Ronda, C., & Wang, H. H.
- Affiliations
- Columbia University (US)
- Corresponding author
- Wang, Harris H.
- ORCID
- Venue
- Nature Biotechnology
- Published
- 2023-02-20
- Volume
- 41
- Issue
- 10
- Pages
- 1424-1433
- ISSN
- 0733-222X (ISSN-L)
- 1087-0156
- 1546-1696
- PMC
- PMC10567565
- OpenAlex
- W4321369770
- Cited by
- 283
- References
- 63
- Citations by year
- 2026: 95 · 2025: 94 · 2024: 62 · 2023: 29
- FWCI
- 24.73
- Type
- journal article
- Language
- en
- Open access
- hybrid
- doi.org
- Locations
- Nature Biotechnology (publishedVersion, cc-by)
- PubMed Central (publishedVersion, cc-by)
- PubMed (publishedVersion)
- Funders
- National Science Foundation (MCB-2025515, DGE-1644869)
- U.S. Department of Health & Human Services | National Institutes of Health (1R01AI132403, 1R21AI146817, T32GM007367)
- United States Department of Defense | United States Navy | Office of Naval Research (N00014-18-1-2237, N00014-17-1-2353)
- Burroughs Wellcome Fund (1016691)
- Irma T. Hirschl Trust (NA)
- Schaefer Research Award
- Hertz Foundation (NA)
- Junior Fellows Scholarship from the Simons Society of Fellows
- Topics
- Life Sciences › Biochemistry, Genetics and Molecular Biology › Molecular Biology › Gut microbiota and health
- Life Sciences › Biochemistry, Genetics and Molecular Biology › Molecular Biology › Genomics and Phylogenetic Studies
- Health Sciences › Medicine › Microbiology (medical) › Bacterial Identification and Susceptibility Testing
- Keywords
- culturomics, colony morphology, fecal microbiota, microbial co-culture, Ruminococcaceae, Bacteroidaceae, Coriobacteriaceae, Bifidobacteriaceae, strain evolution, horizontal gene transfer
- MeSH terms
- Machine Learning, Automation, Bacteria, Humans, Genomics, Microbiota
About these checks
Registry, retraction, Cites and statistics results are computed, not judged, with one exception: a printed reference that no index lists is read once by a model before it counts as a citation error. Claims are extracted by a model and kept only when their quote appears verbatim in the text; each cited source is then checked, with a model’s help, for whether it says what the claim relies on. Those verdicts can be wrong — read the claim’s quote and the cited source before relying on one.
Statistics and arithmetic are recomputed, not judged.
Confidence bands are shown only for fields calibrated on our annotated test set. None is calibrated yet, so no band is shown.
What counts as a claim ›How we measure confidence ›How we check this ›
Are you an author, or do you see a problem with this page? Request a review
