

The DOI matches its Crossref record; 83 of the 83 references it cites were found in a registry or an index.
The vaginal microbiome and preterm birth
Open accessAbstract
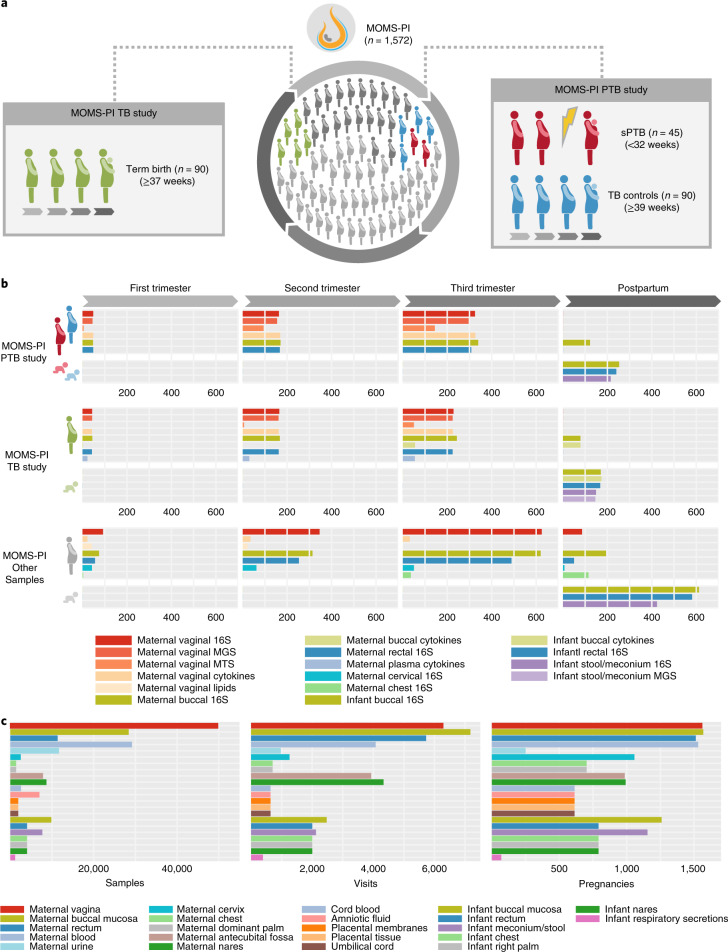
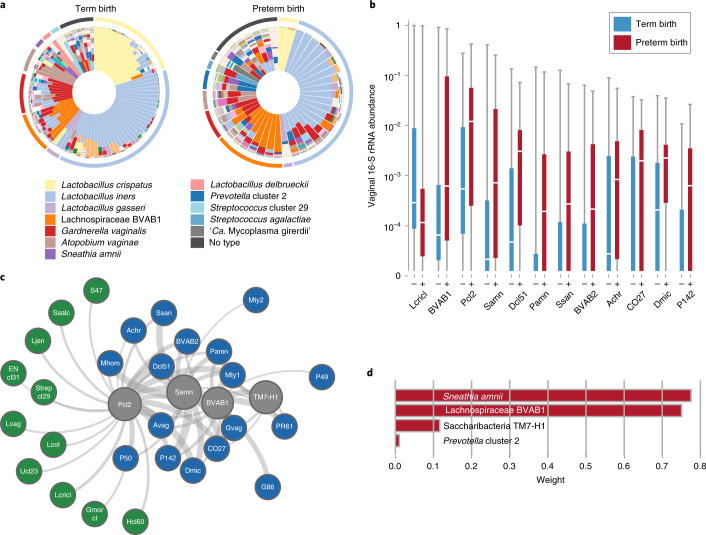
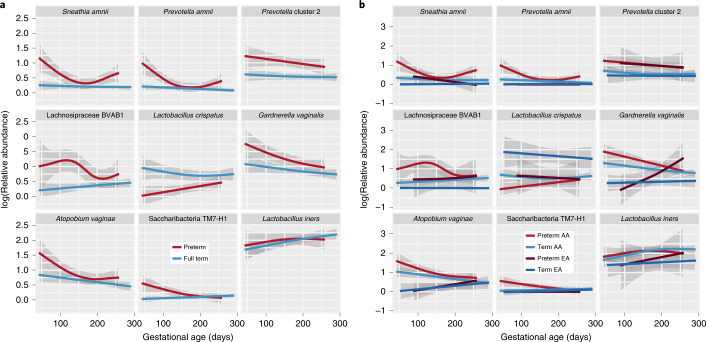
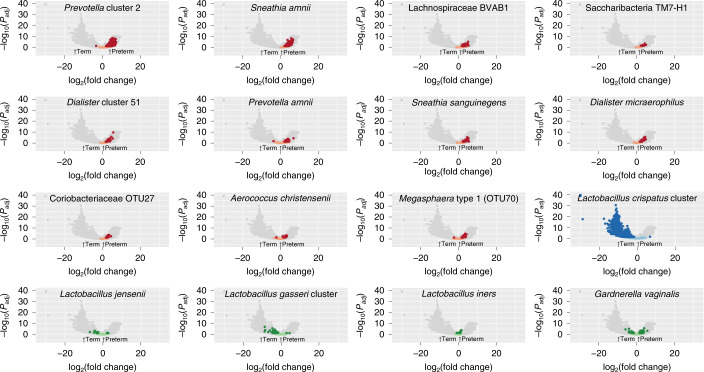
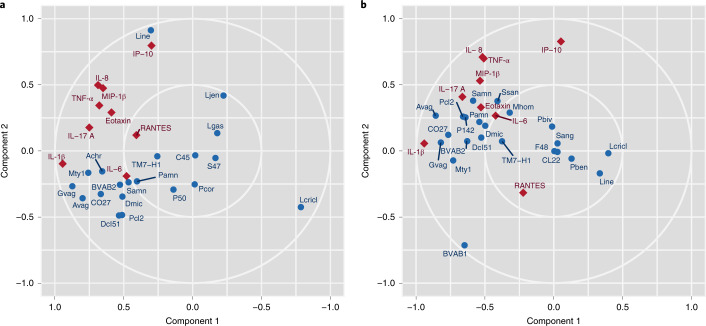
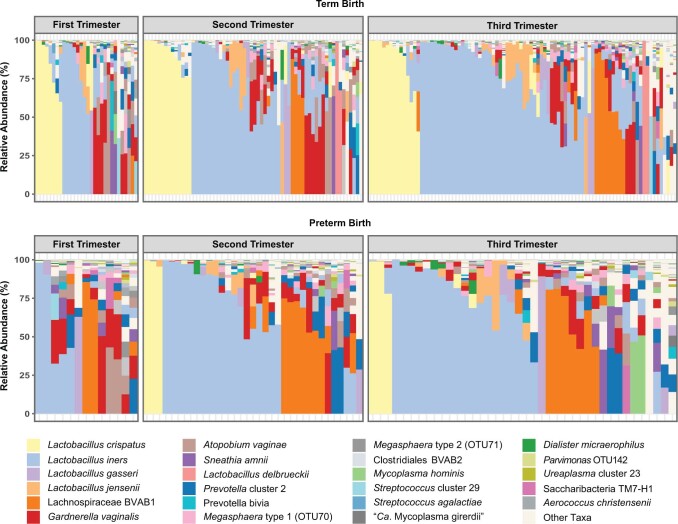
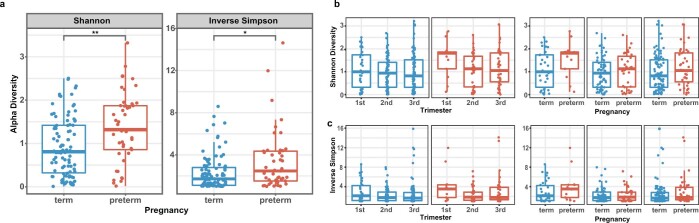
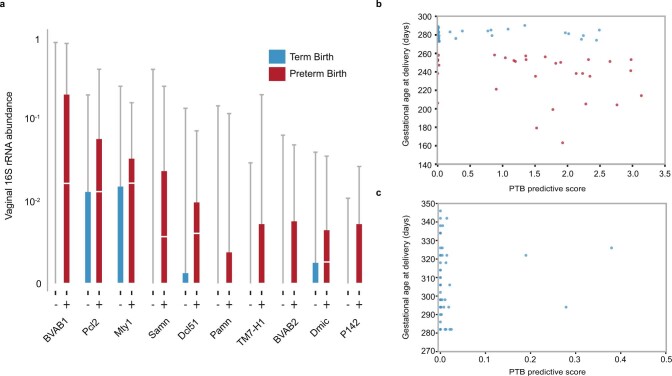
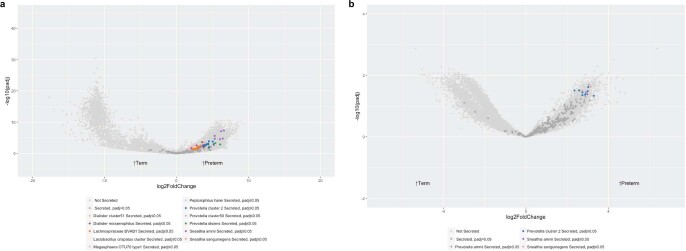
The incidence of preterm birth exceeds 10% worldwide. There are significant disparities in the frequency of preterm birth among populations within countries, and women of African ancestry disproportionately bear the burden of risk in the United States. In the present study, we report a community resource that includes ‘omics’ data from approximately 12,000 samples as part of the integrative Human Microbiome Project. Longitudinal analyses of 16S ribosomal RNA, metagenomic, metatranscriptomic and cytokine profiles from 45 preterm and 90 term birth controls identified harbingers of preterm birth in this cohort of women predominantly of African ancestry. Women who delivered preterm exhibited significantly lower vaginal levels of Lactobacillus crispatus and higher levels of BVAB1, Sneathia amnii, TM7-H1, a group of Prevotella species and nine additional taxa. The first representative genomes of BVAB1 and TM7-H1 are described. Preterm-birth-associated taxa were correlated with proinflammatory cytokines in vaginal fluid. These findings highlight new opportunities for assessment of the risk of preterm birth.
Overview
The claims and statistics of this paper haven’t been checked yet.
Run the check — free, no account needed. It reads the open-access text and checks the sources it cites.
Integrity signals
Registry
Cites
Statistics
Figures
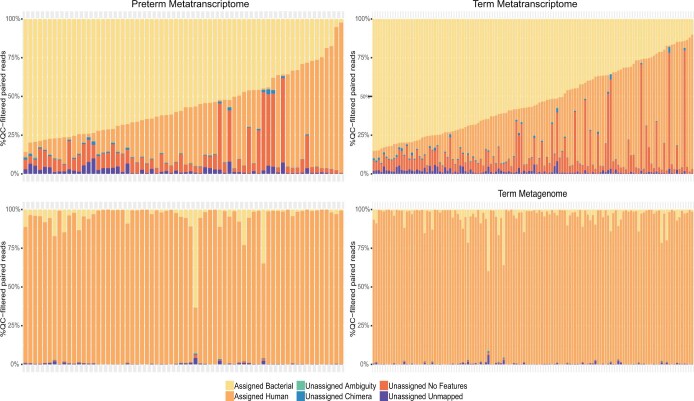
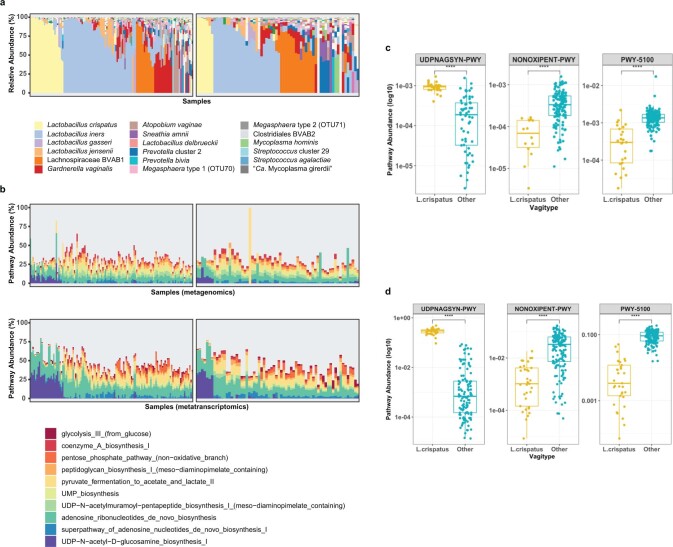
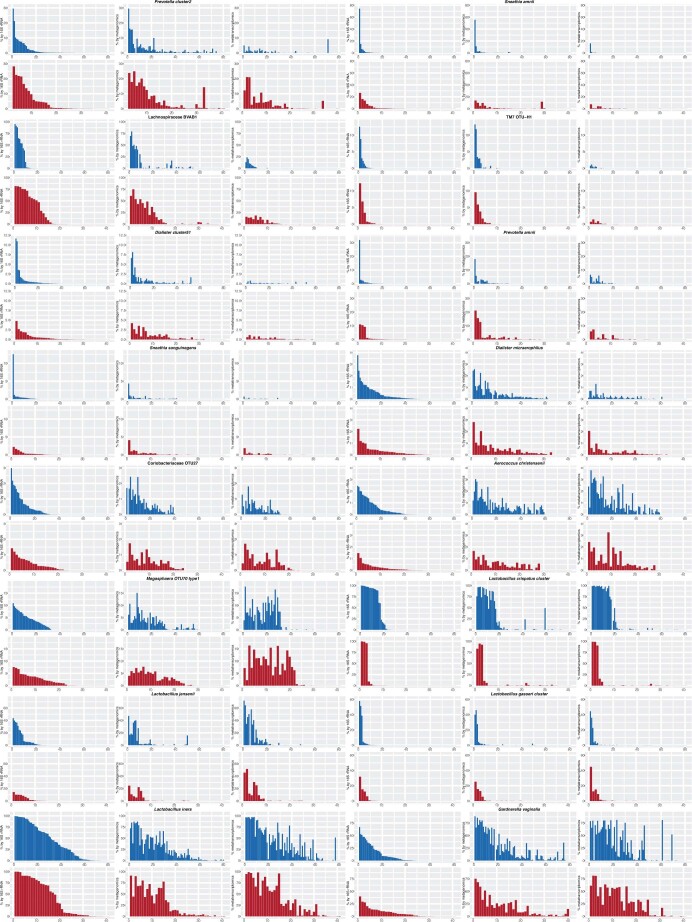
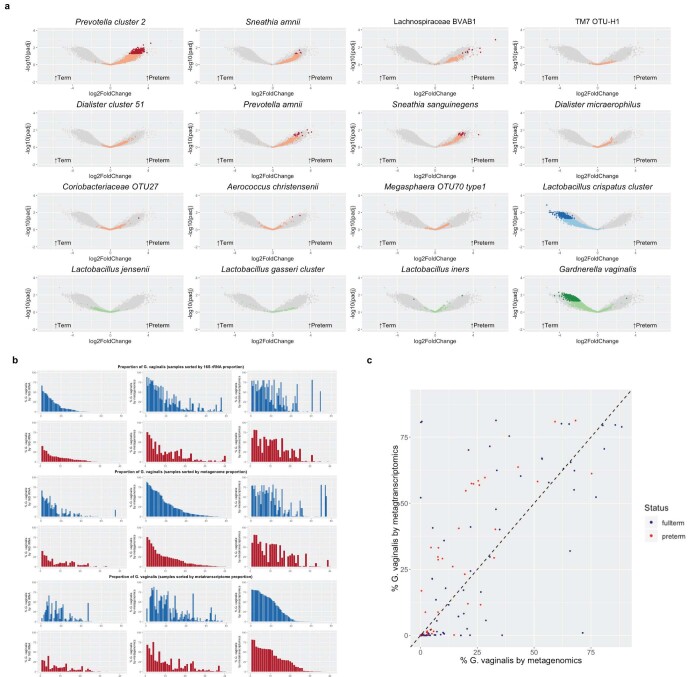
Verification
Claims the paper makes
The claims and statistics of this paper haven’t been checked yet.
Run the check — free, no account needed. It reads the open-access text and checks the sources it cites.
Claims other papers make about this one
Each is checked against this paper’s own text: does it say what the citing paper says it does?
In the citing paper
“The MOMS-PI team (http://vmc.vcu.edu/momspi) also identified signatures of higher risk for PTB in women who experienced spontaneous preterm birth at less than 37 weeks of gestation50.”
From The Integrative Human Microbiome Project (2019) · cites this paper as [50]
In the citing paper
“These studies, which have now reached the first stage of completion49–51, together provide a wealth of information and insights about not only microbial dynamics, but also associated human host responses and microbial inter-relationships.”
From The Integrative Human Microbiome Project (2019) · cites this paper as [50]
Self-check
Percentages, sums and reported differences re-computed from the paper’s own numbers.
The self-check needs the paper’s full text.
Citations
Cites
Moderated estimation of fold change and dispersion for RNA-seq data with DESeq2
Love, M. I., Huber, W., & Anders, S. (2014) · Genome Biology · doi:10.1186/s13059-014-0550-8 · Cited by 95,106
Scikit-learn: Machine Learning in Python
Pedregosa, F., Varoquaux, G., Gramfort, A., Michel, V., Thirion, B., Grisel, O., Blondel, M., Müller, A., Nothman, J., Louppe, G., et al. (2012) · arXiv · doi:10.48550/arxiv.1201.0490 · Cited by 71,016
UCHIME improves sensitivity and speed of chimera detection
Edgar, R. C., Haas, B. J., Clemente, J. C., Quince, C., & Knight, R. (2011) · Bioinformatics · doi:10.1093/bioinformatics/btr381 · Cited by 15,114
Pathogen Recognition and Innate Immunity
Akira, S., Uematsu, S., & Takeuchi, O. (2006) · Cell · doi:10.1016/j.cell.2006.02.015 · Cited by 11,976
Predictive functional profiling of microbial communities using 16S rRNA marker gene sequences
Langille, M. G. I., Zaneveld, J., Caporaso, J. G., McDonald, D., Knights, D., Reyes, J. A., Clemente, J. C., Burkepile, D. E., Vega Thurber, R. L., Knight, R., et al. (2013) · Nature Biotechnology · doi:10.1038/nbt.2676 · Cited by 9,116
Epidemiology and causes of preterm birth
Goldenberg, R. L., Culhane, J. F., Iams, J. D., & Romero, R. (2008) · The Lancet · doi:10.1016/s0140-6736(08)60074-4 · Cited by 7,801
Blencowe, H., Cousens, S., Oestergaard, M. Z., Chou, D., Moller, A.-B., Narwal, R., Adler, A., Vera Garcia, C., Rohde, S., Say, L., et al. (2012) · The Lancet · doi:10.1016/s0140-6736(12)60820-4 · Cited by 4,568
Vaginal microbiome of reproductive-age women
Ravel, J., Gajer, P., Abdo, Z., Schneider, G. M., Koenig, S. S. K., McCulle, S. L., Karlebach, S., Gorle, R., Russell, J., Tacket, C. O., et al. (2011) · Proceedings of the National Academy of Sciences · doi:10.1073/pnas.1002611107 · Cited by 4,254
mixOmics: An R package for ‘omics feature selection and multiple data integration
Rohart, F., Gautier, B., Singh, A., & Lê Cao, K.-A. (2017) · PLOS Computational Biology · doi:10.1371/journal.pcbi.1005752 · Cited by 4,056
Liu, L., Oza, S., Hogan, D., Chu, Y., Perin, J., Zhu, J., Lawn, J. E., Cousens, S., Mathers, C., & Black, R. E. (2016) · The Lancet · doi:10.1016/s0140-6736(16)31593-8 · Cited by 3,453
Research works printed but not linked: 1
- Behrman, R. E. & Butler, A. S. (eds), for Institute of Medicine Committee on Understanding Premature Birth and Assuring Healthy Outcomes. Societal Costs of Preterm Birth (National Academies Press, 2007).
Cited by
Sorted by citations
Items 101–200 of 994
Microdiversity of the vaginal microbiome is associated with preterm birth
Liao, J., Shenhav, L., Urban, J. A., Serrano, M. G., Zhu, B., Buck, G. A., & Korem, T. (2023) · Nature Communications · doi:10.1038/s41467-023-40719-7 · Cited by 69
Self-citationThe reproductive microbiome – clinical practice recommendations for fertility specialists
García-Velasco, J. A., Budding, D., Campe, H., Malfertheiner, S. F., Hamamah, S., Santjohanser, C., Schuppe‐Koistinen, I., Nielsen, H. S., Vieira‐Silva, S., & Laven, J. S. E. (2020) · Reproductive BioMedicine Online · doi:10.1016/j.rbmo.2020.06.014 · Cited by 65
Neuroprotective Role of Lactoferrin during Early Brain Development and Injury through Lifespan
Schirmbeck, G. H., Sizonenko, S. V., & Sanches, E. F. (2022) · Nutrients · doi:10.3390/nu14142923 · Cited by 68
Sneathia: an emerging pathogen in female reproductive disease and adverse perinatal outcomes
Theis, K. R., Сергеевна, Ф. В., Romero, R. J., Borisov, A. B., Winters, A. D., Galaz, J., & Gomez‐Lopez, N. (2021) · Critical Reviews in Microbiology · doi:10.1080/1040841x.2021.1905606 · Cited by 65
Beyond bacterial vaginosis: vaginal lactobacilli and HIV risk
Armstrong, E., & Kaul, R. (2021) · Microbiome · doi:10.1186/s40168-021-01183-x · Cited by 66
Holm, J. B., France, M., Ma, B., McComb, E. J., Robinson, C. K., Mehta, A., Tallon, L. J., Brotman, R. M., & Ravel, J. (2020) · Frontiers in Cellular and Infection Microbiology · doi:10.3389/fcimb.2020.00117 · Cited by 64
Margarita, V., Fiori, P. L., & Rappelli, P. (2020) · Frontiers in Cellular and Infection Microbiology · doi:10.3389/fcimb.2020.00179 · Cited by 62
Zhu, M., Frank, M. W., Radka, C. D., Jeanfavre, S., Xu, J., Tse, M. W., Pacheco, J. A., Kim, J. S., Pierce, K., Deik, A., et al. (2024) · Cell · doi:10.1016/j.cell.2024.07.029 · Cited by 61
Self-citationLi, H., Zang, Y., Wang, C., Li, H., Fan, A., Han, C., & Xue, F. (2020) · Frontiers in Cellular and Infection Microbiology · doi:10.3389/fcimb.2020.609488 · Cited by 61
Cervicovaginal microbiota and metabolome predict preterm birth risk in an ethnically diverse cohort
Flaviani, F., Hezelgrave, N. L., Kanno, T., Prosdocimi, E. M., Chin-Smith, E. C., Ridout, A. E., von Maydell, D. K., Mistry, V., Wade, W. G., Shennan, A. H., et al. (2021) · JCI Insight · doi:10.1172/jci.insight.149257 · Cited by 61
Kang, G.-U., Jung, D.-R., Lee, Y. H., Jeon, S. Y., Han, H. S., Chong, G. O., & Shin, J. (2021) · Microorganisms · doi:10.3390/microorganisms9020294 · Cited by 61
Microflora in the Reproductive Tract of Cattle: A Review
Appiah, M. O., Wang, J., & Lu, W. (2020) · Agriculture · doi:10.3390/agriculture10060232 · Cited by 59
Naud, S., Ibrahim, A., Valles, C., Maatouk, M., Bittar, F., Alou, M. T., & Raoult, D. (2022) · Clinical Microbiology Reviews · doi:10.1128/cmr.00140-21 · Cited by 58
A multi-kingdom collection of 33,804 reference genomes for the human vaginal microbiome
Huang, L., Guo, R., Li, S., Wu, X., Zhang, Y., Guo, S., Lv, Y., Xiao, Z., Kang, J., Meng, J., et al. (2024) · Nature Microbiology · doi:10.1038/s41564-024-01751-5 · Cited by 61
Balla, B., Illés, A., Tóbiás, B., Pikó, H., Beke, A., Sipos, M., Lakatos, P. L., & Kosa, J. P. (2024) · International Journal of Molecular Sciences · doi:10.3390/ijms252313227 · Cited by 62
Comparative Analysis of Lower Genital Tract Microbiome Between PCOS and Healthy Women
Tu, Y., Zheng, G., Ding, G., Wu, Y., Xi, J., Ge, Y., Gu, H., Wang, Y., Sheng, J., Liu, X., et al. (2020) · Frontiers in Physiology · doi:10.3389/fphys.2020.01108 · Cited by 57
Davidson, G. L., Somers, S. E., Wiley, N., Johnson, C. N., Reichert, M. S., Ross, R. P., Stanton, C., & Quinn, J. L. (2021) · Journal of Animal Ecology · doi:10.1111/1365-2656.13428 · Cited by 57
Mtshali, A., San, J. E., Osman, F., Garrett, N., Balle, C., Giandhari, J., Onywera, H., Mngomezulu, K., Mzobe, G. F., de Oliveira, T., et al. (2021) · Frontiers in Immunology · doi:10.3389/fimmu.2021.730986 · Cited by 57
Modelling host–microbiome interactions in organ-on-a-chip platforms
Shin, Y. C., Than, N., Min, S., Shin, W., & Kim, H. J. (2023) · Nature Reviews Bioengineering · doi:10.1038/s44222-023-00130-9 · Cited by 58
Preterm neonatal immunology at the intestinal interface
Belkum, M. V., Alvarez, L. M., & Neu, J. (2019) · Cellular and Molecular Life Sciences · doi:10.1007/s00018-019-03316-w · Cited by 59
Basavaprabhu, H. N., Shivanna, S. K., & Prabha, R. (2020) · Microbial Pathogenesis · doi:10.1016/j.micpath.2020.104029 · Cited by 57
Zakis, D. R., Paulissen, E., Kornete, L., Kaan, A. M., Nicu, E. A., & Zaura, E. (2021) · Journal of Reproductive Immunology · doi:10.1016/j.jri.2021.103455 · Cited by 58
Genital Micro-Organisms in Pregnancy
Bagga, R., & Arora, P. (2020) · Frontiers in Public Health · doi:10.3389/fpubh.2020.00225 · Cited by 57
Siena, M. D., Laterza, L., Matteo, M. V., Mignini, I., Schepis, T., Rizzatti, G., Ianiro, G., Rinninella, E., Cintoni, M., & Gasbarrini, A. (2021) · Microorganisms · doi:10.3390/microorganisms9030473 · Cited by 56
Racism and perinatal health inequities research: where we have been and where we should go
Headen, I. E., Elovitz, M. A., Battarbee, A. N., Lo, J. O.-T., & Debbink, M. P. (2022) · American Journal of Obstetrics and Gynecology · doi:10.1016/j.ajog.2022.05.033 · Cited by 60
Borges, L. G. D. A., Pastuschek, J., Heimann, Y., Dawczynski, K., PEONS study group, Bergner, M., Haase, R., Stubert, J., Olbertz, D. M., Plumeier, I., et al. (2023) · BMC Medicine · doi:10.1186/s12916-023-02805-x · Cited by 59
Cervicovaginal Microbiome Composition Is Associated with Metabolic Profiles in Healthy Pregnancy
Oliver, A. S., LaMere, B. J., Weihe, C., Wandro, S., Lindsay, K. L., Wadhwa, P. D., Mills, D. A., Pride, D. T., Fiehn, O., Northen, T. R., et al. (2020) · mBio · doi:10.1128/mbio.01851-20 · Cited by 56
Liu, L., Wang, H., Rao, X., Yu, Y., Li, W., Zheng, P., Zhao, L., Zhou, C., Pu, J., Yang, D., et al. (2020) · Journal of Advanced Research · doi:10.1016/j.jare.2020.12.002 · Cited by 55
Reiss, J. D., Peterson, L. S., Nesamoney, S. N., Chang, A. L., Pașca, A. M., Marić, I., Shaw, G. M., Gaudilliere, B. L., Wong, R. J., Sylvester, K. G., et al. (2022) · Experimental Neurology · doi:10.1016/j.expneurol.2022.113988 · Cited by 54
Skafte-Holm, A., Humaidan, P., Bernabeu, A., Lledó, B., Jensen, J. S., & Haahr, T. (2021) · Pathogens · doi:10.3390/pathogens10030295 · Cited by 52
Association of female reproductive tract microbiota with egg production in layer chickens
Su, Y., Tian, S., Li, D., Zhu, W., Wang, T., Mishra, S. K., Wei, R., Xu, Z., He, M., Zhao, X., et al. (2021) · GigaScience · doi:10.1093/gigascience/giab067 · Cited by 52
Das, S., Bhattacharjee, M. J., Mukherjee, A. K., & Khan, M. R. (2023) · Critical Reviews in Microbiology · doi:10.1080/1040841x.2022.2049696 · Cited by 51
Mima, K., Kosumi, K., Baba, Y., Hamada, T., Baba, H., & Ogino, S. (2020) · Human Genetics · doi:10.1007/s00439-020-02235-2 · Cited by 51
Goodfellow, L., Verwijs, M., Care, A., Sharp, A., Ivandić, J., Poljak, B., Roberts, D., Bronowski, C., Gill, A., Darby, A., et al. (2021) · BJOG An International Journal of Obstetrics & Gynaecology · doi:10.1111/1471-0528.16816 · Cited by 51
Multicenter assessment of shotgun metagenomics for pathogen detection
Liu, D., Zhou, H., Xu, T., Yang, Q., Mo, X., Shi, D., Ai, J., Zhang, J., Tao, Y., Wen, D., et al. (2021) · EBioMedicine · doi:10.1016/j.ebiom.2021.103649 · Cited by 51
Rosa, P. A. D., Miglioli, C., Caglioni, M., Tiberio, F., Mosser, K. H. H., Vignotto, E., Canini, M., Baldoli, C., Falini, A., Candiani, M., et al. (2021) · BMC Pregnancy and Childbirth · doi:10.1186/s12884-021-03654-3 · Cited by 50
Jaffe, A. L., Thomas, A. D., He, C., Keren, R., Valentin-Alvarado, L. E., Munk, P., Bouma‐Gregson, K., Farag, I., Amano, Y., Sachdeva, R., et al. (2021) · mBio · doi:10.1128/mbio.00521-21 · Cited by 50
The effects of microbiota on reproductive health: A review
Wang, N., Chen, L., Yi, K., Zhang, B., Li, C., & Zhou, X. (2022) · Critical Reviews in Food Science and Nutrition · doi:10.1080/10408398.2022.2117784 · Cited by 51
Golob, J. L., Oskotsky, T., Tang, A., Roldan, A., Chung, V., Ha, C. W. Y., Wong, R. J., Flynn, K. J., Chai, R., Dubin, C., et al. (2023) · Cell Reports Medicine · doi:10.1016/j.xcrm.2023.101350 · Cited by 53
Vaginal lactobacilli produce anti-inflammatory β-carboline compounds
Glick, V. J., Webber, C. A., Simmons, L. E., Martin, M. C., Ahmad, M., Kim, C., Adams, A. N. D., Bang, S., Chao, M. C., Howard, N. C., et al. (2024) · Cell Host & Microbe · doi:10.1016/j.chom.2024.09.014 · Cited by 50
The Vaginal Microbiota of Pregnant Women Varies with Gestational Age, Maternal Age, and Parity
Romero, R. J., Theis, K. R., Gomez‐Lopez, N., Winters, A. D., Panzer, J. J., Huang, L., Galaz, J., Greenberg, J. M., Shaffer, Z., Kracht, D. J., et al. (2023) · Microbiology Spectrum · doi:10.1128/spectrum.03429-22 · Cited by 48
Huang, C. D., Gin, C., Fettweis, J. M., Foxman, B., Gelaye, B., MacIntyre, D. A., Subramaniam, A., Fraser, W. D., Tabatabaei, N., & Callahan, B. J. (2023) · BMC Biology · doi:10.1186/s12915-023-01702-2 · Cited by 49
Self-citationGut microbiome-metabolome interactions predict host condition
Shtossel, O., Koren, O., Shai, I., Rinott, E., & Louzoun, Y. (2024) · Microbiome · doi:10.1186/s40168-023-01737-1 · Cited by 49
Daele, E. V., Knol, J., & Belzer, C. (2019) · Critical Reviews in Microbiology · doi:10.1080/1040841x.2019.1680601 · Cited by 49
Protection and Risk: Male and Female Genital Microbiota and Sexually Transmitted Infections
Tuddenham, S., Ravel, J., & Marrazzo, J. M. (2020) · The Journal of Infectious Diseases · doi:10.1093/infdis/jiaa762 · Cited by 51
Pace, R. M., Chu, D. M., Prince, A., Ma, J., Seferovic, M. D., & Aagaard, K. M. (2021) · Med · doi:10.1016/j.medj.2021.06.001 · Cited by 48
Multi-omics and machine learning for the prevention and management of female reproductive health
Kharb, S., & Joshi, A. (2023) · Frontiers in Endocrinology · doi:10.3389/fendo.2023.1081667 · Cited by 49
Heat exposure induced risks of preterm birth mediated by maternal hypertension
Wang, L., Di, J., Wang, Q., Zhang, H., Zhao, W., Shi, X., Di, Q., Ji, J. S., Liang, W., & Huang, C. (2024) · Nature Medicine · doi:10.1038/s41591-024-03002-w · Cited by 47
Vaginal dysbiosis and the potential of vaginal microbiome-directed therapeutics
Valeriano, V. D., Lahtinen, E., Hwang, I., Zhang, Y., Du, J., & Schuppe‐Koistinen, I. (2024) · Frontiers in Microbiomes · doi:10.3389/frmbi.2024.1363089 · Cited by 49
Exploring the global vaginal microbiome and its impact on human health
Chacra, L. A., & Fenollar, F. (2021) · Microbial Pathogenesis · doi:10.1016/j.micpath.2021.105172 · Cited by 47
Verstraelen, H., Vieira‐Baptista, P., Seta, F. D., Ventolini, G., Lonnee-Hoffmann, R., & Lev‐Sagie, A. (2021) · Journal of Lower Genital Tract Disease · doi:10.1097/lgt.0000000000000643 · Cited by 46
Bacterial vaginosis: A state of microbial dysbiosis
Mondal, A. S., Sharma, R., & Trivedi, N. (2023) · Medicine in Microecology · doi:10.1016/j.medmic.2023.100082 · Cited by 44
Yao, T., Han, X., Guan, T., Wang, Z., Zhang, S., Liu, C., Liu, C., & Chen, L. (2020) · Forensic Science International · doi:10.1016/j.forsciint.2020.110417 · Cited by 44
Park, S., Moon, J., Kang, N., Kim, Y. H., You, Y., Kwon, E., Ansari, A., Hur, Y. M., Park, T., & Kim, Y. J. (2022) · Frontiers in Microbiology · doi:10.3389/fmicb.2022.912853 · Cited by 44
Ventolini, G., Vieira‐Baptista, P., Seta, F. D., Verstraelen, H., Hoffmann, R., & Lev‐Sagie, A. (2021) · Journal of Lower Genital Tract Disease · doi:10.1097/lgt.0000000000000646 · Cited by 42
The hormonal control of parturition
Hamburg‐Shields, E., & Mesiano, S. A. (2024) · Physiological Reviews · doi:10.1152/physrev.00019.2023 · Cited by 46
Prevotella are major contributors of sialidases in the human vaginal microbiome
Pelayo, P., Hussain, F. A., Werlang, C. A., Wu, C. M., Woolston, B. M., Xiang, C. M., Rutt, L., France, M., Ravel, J., Ribbeck, K., et al. (2024) · Proceedings of the National Academy of Sciences · doi:10.1073/pnas.2400341121 · Cited by 43
Vaginal microbiome diversity and preterm birth: results of a nested case–control study in Peru
Blostein, F., Gelaye, B., Sánchez, S. E., Williams, M. A., & Foxman, B. (2019) · Annals of Epidemiology · doi:10.1016/j.annepidem.2019.11.004 · Cited by 43
Happel, A., Varsani, A., Balle, C., Passmore, J.-A. S., & Jaspan, H. B. (2020) · Viruses · doi:10.3390/v12080832 · Cited by 43
Hong, X., Qin, P., Yin, J., Yong Quan, S. H. I., Xuan, Y., Chen, Z., Zhou, X., Yu, H., Peng, D., & Wang, B. (2021) · Frontiers in Endocrinology · doi:10.3389/fendo.2021.662725 · Cited by 43
Computational Modeling of the Human Microbiome
Chowdhury, S., & Fong, S. S. (2020) · Microorganisms · doi:10.3390/microorganisms8020197 · Cited by 43
Self-citationInsights into the role of vaginal microbiome in women's health
Deka, N., Hassan, S., Kiran, G. S., & Selvin, J. (2021) · Journal of Basic Microbiology · doi:10.1002/jobm.202100421 · Cited by 42
The vaginal microbiome in women of reproductive age with healthy weight versus overweight/obesity
Allen, N. G., Edupuganti, L., Edwards, D., Jimenez, N. R., Buck, G. A., Jefferson, K. K., Strauss, J. F., Wickham, E. P., & Fettweis, J. M. (2021) · Obesity · doi:10.1002/oby.23306 · Cited by 41
Self-citationThe emerging potential ofmicrobiome transplantation on human health interventions
Junca, H., Pieper, D. H., & Medina, E. (2022) · Computational and Structural Biotechnology Journal · doi:10.1016/j.csbj.2022.01.009 · Cited by 41
Semen microbiota in normal and leukocytospermic males
Yao, Y., Qiu, X.-J., Wang, D., Luo, J., Tang, T., Li, Y., Zhang, C., Liu, H., Zhou, L., & Zhao, L. (2021) · Asian Journal of Andrology · doi:10.4103/aja202172 · Cited by 41
Noninvasive Prenatal Testing Using Circulating DNA and RNA: Advances, Challenges, and Possibilities
Moufarrej, M. N., Bianchi, D. W., Shaw, G. M., Stevenson, D. K., & Quake, S. R. (2023) · Annual Review of Biomedical Data Science · doi:10.1146/annurev-biodatasci-020722-094144 · Cited by 43
Bifidobacteria, Lactobacilli... when, how and why to use them
Matera, M. (2024) · Global Pediatrics · doi:10.1016/j.gpeds.2024.100139 · Cited by 43
The Vaginal Microbial Signatures of Preterm Birth Delivery in Indian Women
Kumar, S., Kumari, N., Talukdar, D., Kothidar, A., Sarkar, M., Mehta, O., Kshetrapal, P., Wadhwa, N., Thiruvengadam, R., Desiraju, B. K., et al. (2021) · Frontiers in Cellular and Infection Microbiology · doi:10.3389/fcimb.2021.622474 · Cited by 40
Karaer, A., Doğan, B., Günal, S., Tuncay, G., Düz, S. A., Ünver, T., & Tecellioglu, N. (2021) · BJOG An International Journal of Obstetrics & Gynaecology · doi:10.1111/1471-0528.16782 · Cited by 40
Understanding and interpreting community sequencing measurements of the vaginal microbiome
Berman, H. L., McLaren, M. R., & Callahan, B. J. (2019) · BJOG An International Journal of Obstetrics & Gynaecology · doi:10.1111/1471-0528.15978 · Cited by 40
Lactobacillus Probiotics Improve Vaginal Dysbiosis in Asymptomatic Women
Ansari, A., Son, D., Hur, Y. M., Park, S., You, Y., Kim, S. M., Lee, G., Kang, S., Chung, Y., Lim, S., et al. (2023) · Nutrients · doi:10.3390/nu15081862 · Cited by 39
Vaginal and endometrial microbiome dysbiosis associated with adverse embryo transfer outcomes
Su, W., Gong, C., Zhong, H., Yang, H., Chen, Y., Wu, X., Jin, J., Xi, H., & Zhao, J. (2024) · Reproductive Biology and Endocrinology · doi:10.1186/s12958-024-01274-y · Cited by 43
Lin, C.-Y., Lin, C., Yeh, Y., Yang, L., Lee, Y., Chao, A., Chin, C.-Y., Chao, A., & Yang, C. (2020) · Scientific Reports · doi:10.1038/s41598-020-75534-3 · Cited by 39
Pierro, F. D., Criscuolo, A. A., Giudici, A. D., Senatori, R., Sesti, F., Ciotti, M., & Piccione, E. (2021) · Minerva Obstetrics and Gynecology · doi:10.23736/s2724-606x.21.04752-7 · Cited by 39
Alterations in the vaginal microbiota of patients with preterm premature rupture of membranes
Yan, C., Hong, F., Xin, G., Duan, S., Deng, X., & Xu, Y. (2022) · Frontiers in Cellular and Infection Microbiology · doi:10.3389/fcimb.2022.858732 · Cited by 39
The Role of Neutrophils in Pregnancy, Term and Preterm Labour
Gimeno-Molina, B., Müller, I., Kropf, P., & Sykes, L. (2022) · Life · doi:10.3390/life12101512 · Cited by 39
Maternal and infant factors that shape neonatal gut colonization by bacteria
O’Neill, I. J., Sánchez-Gallardo, R., Saldova, R., Murphy, E. F., Cotter, P. D., McAuliffe, F. M., & van Sinderen, D. (2020) · Expert Review of Gastroenterology & Hepatology · doi:10.1080/17474124.2020.1784725 · Cited by 38
Maternal microbiota and gestational diabetes: impact on infant health
Singh, P., Elhag, D. A., Ibrahim, I., Abdullahi, H., & Khodor, S. A. (2023) · Journal of Translational Medicine · doi:10.1186/s12967-023-04230-3 · Cited by 41
Variation of the Vaginal Microbiome During and After Pregnancy in Chinese Women
Zhang, X., Zhai, Q., Wang, J., Ma, X., Xing, B., Fan, H., Gao, Z., Zhao, F., & Liu, W. Y. (2022) · Genomics Proteomics & Bioinformatics · doi:10.1016/j.gpb.2021.08.013 · Cited by 38
Goodfellow, L., Care, A., & Alfirević, Ž. (2020) · BJOG An International Journal of Obstetrics & Gynaecology · doi:10.1111/1471-0528.16544 · Cited by 37
Wei, X. L., Tsai, M.-S., Liang, L., Jiang, L., Hung, C.-J., Jelliffe‐Pawlowski, L. L., Rand, L., Snyder, M. P., & Jiang, C. (2024) · Cell Reports · doi:10.1016/j.celrep.2024.114078 · Cited by 37
Distributional bias compromises leave-one-out cross-validation
Austin, G. I., Pe’er, I., & Korem, T. (2025) · Science Advances · doi:10.1126/sciadv.adx6976 · Cited by 39
Dietary macronutrient intake and molecular-bacterial vaginosis: Role of fiber
Shivakoti, R., Tuddenham, S., Caulfield, L. E., Murphy, C., Robinson, C. K., Ravel, J., Ghanem, K. G., & Brotman, R. M. (2020) · Clinical Nutrition · doi:10.1016/j.clnu.2020.01.011 · Cited by 37
The association between obesity and weight loss after bariatric surgery on the vaginal microbiota
Raglan, O., MacIntyre, D. A., Mitra, A., Lee, Y. S., Smith, A., Assi, N., Nautiyal, J., Purkayastha, S., Gunter, M. J., Gabra, H., et al. (2021) · Microbiome · doi:10.1186/s40168-021-01011-2 · Cited by 39
Nunez, N., Réot, L., & Menu, E. (2021) · Vaccines · doi:10.3390/vaccines9060584 · Cited by 37
Gut microbiota in acute leukemia: Current evidence and future directions
Zhou, Y., Zhou, C., & Zhang, A. (2022) · Frontiers in Microbiology · doi:10.3389/fmicb.2022.1045497 · Cited by 37
Resident microbes shape the vaginal epithelial glycan landscape
Agarwal, K., Choudhury, B., Robinson, L. S., Morrill, S. R., Bouchibiti, Y., Chilin-Fuentes, D., Rosenthal, S. B., Fisch, K. M., Peipert, J. F., Lebrilla, C. B., et al. (2023) · Science Translational Medicine · doi:10.1126/scitranslmed.abp9599 · Cited by 37
Effect of Antibiotic Use Within First 48 Hours of Life on the Preterm Infant Microbiome
Kim, C. S., Grady, N., Derrick, M., Yu, Y., Oliphant, K., Lu, J. N., & Claud, E. C. (2020) · Archives of Pediatrics and Adolescent Medicine · doi:10.1001/jamapediatrics.2020.4916 · Cited by 36
Life History Recorded in the Vagino-Cervical Microbiome Along with Multi-Omes
Jie, Z., Chen, C., Hao, L., Li, F., Song, L., Zhang, X., Zhu, J., Tian, L., Tong, X., Cai, K., et al. (2021) · Genomics Proteomics & Bioinformatics · doi:10.1016/j.gpb.2021.01.005 · Cited by 36
Runge, S., & Rosshart, S. P. (2021) · Frontiers in Immunology · doi:10.3389/fimmu.2021.702378 · Cited by 36
Ansari, A., Bose, S., You, Y., Park, S., & Kim, Y. J. (2021) · International Journal of Molecular Sciences · doi:10.3390/ijms22158145 · Cited by 37
Characteristics of Vaginal Microbiota of Women of Reproductive Age with Infections
Dong, W., Wang, S., Wang, X., Xu, G., Liu, Q., Li, Z., Lv, N., Pan, Y., Xiong, Q., Liu, D., et al. (2024) · Microorganisms · doi:10.3390/microorganisms12051030 · Cited by 35
Ravel, J., Simmons, S. L., Greenwood, E. A., Gottfried, S., Greene, M., Kellogg‐Spadt, S., Gevers, D., & Harper, D. M. (2025) · npj Biofilms and Microbiomes · doi:10.1038/s41522-025-00788-6 · Cited by 35
Sun, N., Ding, H., Yu, H., Ji, Y., Xifang, X., Pang, W., Wang, X., Zhang, Q., & Li, W. (2021) · Frontiers in Cellular and Infection Microbiology · doi:10.3389/fcimb.2021.649067 · Cited by 34
Norenhag, J., Edfeldt, G., Stålberg, K., García, F. R., Hugerth, L. W., Engstrand, L. G., Fransson, E., Du, J., Schuppe‐Koistinen, I., & Olovsson, M. (2024) · Scientific Reports · doi:10.1038/s41598-024-61942-2 · Cited by 38
Zhao, F., Chen, Y., Gao, J., Wu, M., Cui, L., Wang, Z., Huang, N., Cui, L., Du, M., & Ying, C. (2021) · Frontiers in Cellular and Infection Microbiology · doi:10.3389/fcimb.2021.680643 · Cited by 34
Lithgow, K., Buchholz, V., Ku, E., Konschuh, S., D’Aubeterre, A., & Sycuro, L. K. (2022) · npj Biofilms and Microbiomes · doi:10.1038/s41522-022-00270-7 · Cited by 34
Brown, B. P., Feng, C., Tanko, R. F., Jaumdally, S. Z., Bunjun, R., Dabee, S., Happel, A., Gasper, M. A., Nyangahu, D. D., Onono, M. A., et al. (2023) · Nature Communications · doi:10.1038/s41467-023-36002-4 · Cited by 38
Microbiota and Recurrent Pregnancy Loss (RPL); More than a Simple Connection
Garmendia, J. V., Sanctis, C. V. D., Hajdúch, M., & Sanctis, J. B. D. (2024) · Microorganisms · doi:10.3390/microorganisms12081641 · Cited by 33
Oral Microbiome Analysis in Prospective Genome Cohort Studies of the Tohoku Medical Megabank Project
Saito, S., Aoki, Y., Tamahara, T., Goto, M., Matsui, H., Kawashima, J., Danjoh, I., Hozawa, A., Kuriyama, S., Suzuki, Y., et al. (2021) · Frontiers in Cellular and Infection Microbiology · doi:10.3389/fcimb.2020.604596 · Cited by 34
Metadata
- Authors
- Fettweis, J. M., Serrano, M. G., Brooks, J. P., Edwards, D. J., Girerd, P. H., Parikh, H. I., Huang, B., Arodz, T. J., Edupuganti, L., Glascock, A. L., Xu, J., Jimenez, N. R., Vivadelli, S. C., Fong, S. S., Sheth, N. U., Jean, S., Lee, V., Bokhari, Y. A., Lara, A. M., Mistry, S. D., Duckworth, R. A., Bradley, S. P., Koparde, V. N., Orenda, X. V., Milton, S. H., Rozycki, S. K., Matveyev, A. V., Wright, M. L., Huzurbazar, S. V., Jackson, E. M., Smirnova, E., Korlach, J., Tsai, Y.-C., Dickinson, M. R., Brooks, J. L., Drake, J. I., Chaffin, D. O., Sexton, A. L., Gravett, M. G., Rubens, C. E., Wijesooriya, N. R., Hendricks-Muñoz, K. D., Jefferson, K. K., Strauss, J. F., & Buck, G. A.
- Affiliations
- Virginia Commonwealth University (US)
- Emory University (US)
- West Virginia University (US)
- Pacific Biosciences (United States) (US)
- Global Alliance to Prevent Prematurity and Stillbirth (US)
- University of Washington (US)
- Corresponding author
- Buck, Gregory A.
- ORCID
- Fettweis, Jennifer M.
- Serrano, Myrna G.
- Brooks, J. Paul
- Edwards, David J.
- Parikh, Hardik I.
- Arodz, Tom J.
- Edupuganti, Laahirie
- Glascock, Abigail L.
- Xu, Jie
- Jimenez, Nicole R.
- Fong, Stephen S.
- Bokhari, Yahya A.
- Orenda, X. Valentine
- Rozycki, Sarah K.
- Wright, Michelle L.
- Huzurbazar, Snehalata V.
- Smirnova, Ekaterina
- Korlach, Jonas
- Tsai, Yu-Chih
- Brooks, Jamie L.
- Drake, Jennifer I.
- Gravett, Michael G.
- Jefferson, Kimberly K.
- Strauss, Jerome F.
- Buck, Gregory A.
- Venue
- Nature Medicine
- Published
- 2019-05-29
- Volume
- 25
- Issue
- 6
- Pages
- 1012-1021
- ISSN
- 1078-8956 (ISSN-L)
- 1546-170X
- PMC
- PMC6750801
- OpenAlex
- W2947640277
- Cited by
- 983
- References
- 83
- Citations by year
- 2026: 116 · 2025: 138 · 2024: 124 · 2023: 147 · 2022: 149 · 2021: 165 · 2020: 115 · 2019: 28
- FWCI
- 84.48
- Type
- journal article
- Language
- en
- Open access
- hybrid
- doi.org
- Locations
- Nature Medicine (publishedVersion, cc-by)
- PubMed Central (publishedVersion, cc-by)
- PubMed (publishedVersion)
- Funders
- National Science Foundation (1453658)
- Bill and Melinda Gates Foundation
- National Institutes of Health
- National Institute of General Medical Sciences (R25GM089614, R25GM090084)
- National Institute of Allergy and Infectious Diseases (UH2AI083263, UH3AI083263)
- National Institute of Dental and Craniofacial Research (U54DE023786)
- Office of Research on Women's Health
- National Center for Complementary and Integrative Health
- Eunice Kennedy Shriver National Institute of Child Health and Human Development (U54HD080784, R01HD092415, R21HD092965)
- Common Fund
- Topics
- Life Sciences › Immunology and Microbiology › Microbiology › Reproductive tract infections research
- Health Sciences › Medicine › Obstetrics and Gynecology › Preterm Birth and Chorioamnionitis
- Life Sciences › Biochemistry, Genetics and Molecular Biology › Molecular Biology › Gut microbiota and health
- Keywords
- vaginal microbiota, preterm birth, African ancestry, Lactobacillus crispatus, Sneathia amnii, Prevotella, inflammatory cytokines, vaginal secretions, preterm birth prediction, Human Microbiome Project, metagenomics, metatranscriptomics, 16S rRNA
- MeSH terms
- Host Microbial Interactions, Adult, Black or African American, Female, Humans, Infant, Newborn, Longitudinal Studies, Risk Factors, United States, Vagina, Cohort Studies, Cytokines, Inflammation Mediators, Biodiversity, Premature Birth, Young Adult, Metagenomics, Microbiota
About these checks
Registry, retraction, Cites and statistics results are computed, not judged, with one exception: a printed reference that no index lists is read once by a model before it counts as a citation error. Claims are extracted by a model and kept only when their quote appears verbatim in the text; each cited source is then checked, with a model’s help, for whether it says what the claim relies on. Those verdicts can be wrong — read the claim’s quote and the cited source before relying on one.
Statistics and arithmetic are recomputed, not judged.
Confidence bands are shown only for fields calibrated on our annotated test set. None is calibrated yet, so no band is shown.
What counts as a claim ›How we measure confidence ›How we check this ›
Are you an author, or do you see a problem with this page? Request a review
