Cited by 385Pancreatic and Hepatic Oncology ResearchCancer Immunotherapy and BiomarkersCholangiocarcinoma and Gallbladder Cancer Studies

The DOI matches its Crossref record; 45 of the 45 references it cites were found in a registry or an index.

Sotigalimab and/or nivolumab with chemotherapy in first-line metastatic pancreatic cancer: clinical and immunologic analyses from the randomized phase 2 PRINCE trial

Open access

Abstract

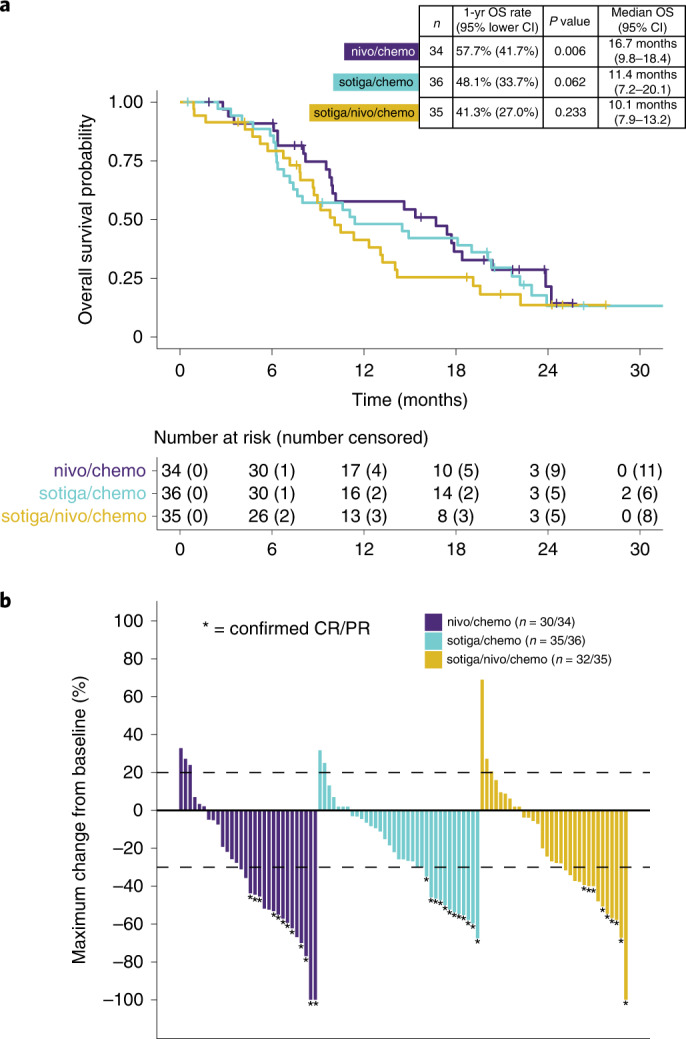
Chemotherapy combined with immunotherapy has improved the treatment of certain solid tumors, but effective regimens remain elusive for pancreatic ductal adenocarcinoma (PDAC). We conducted a randomized phase 2 trial evaluating the efficacy of nivolumab (nivo; anti-PD-1) and/or sotigalimab (sotiga; CD40 agonistic antibody) with gemcitabine/nab-paclitaxel (chemotherapy) in patients with first-line metastatic PDAC ( NCT03214250 ). In 105 patients analyzed for efficacy, the primary endpoint of 1-year overall survival (OS) was met for nivo/chemo (57.7%, P = 0.006 compared to historical 1-year OS of 35%, n = 34) but was not met for sotiga/chemo (48.1%, P = 0.062, n = 36) or sotiga/nivo/chemo (41.3%, P = 0.223, n = 35). Secondary endpoints were progression-free survival, objective response rate, disease control rate, duration of response and safety. Treatment-related adverse event rates were similar across arms. Multi-omic circulating and tumor biomarker analyses identified distinct immune signatures associated with survival for nivo/chemo and sotiga/chemo. Survival after nivo/chemo correlated with a less suppressive tumor microenvironment and higher numbers of activated, antigen-experienced circulating T cells at baseline. Survival after sotiga/chemo correlated with greater intratumoral CD4 T cell infiltration and circulating differentiated CD4 T cells and antigen-presenting cells. A patient subset benefitting from sotiga/nivo/chemo was not identified. Collectively, these analyses suggest potential treatment-specific correlates of efficacy and may enable biomarker-selected patient populations in subsequent PDAC chemoimmunotherapy trials.

Overview

The claims and statistics of this paper haven’t been checked yet.

Run the check — free, no account needed. It reads the open-access text and checks the sources it cites.

A few free checks a day · papers already verified open instantly · results are public

Integrity signals

Registry

Crossref · 10.1038/s41591-022-01829-9

Cites

45 of 45 references verified0 citation errors · 0 not checkable

Statistics

Figures

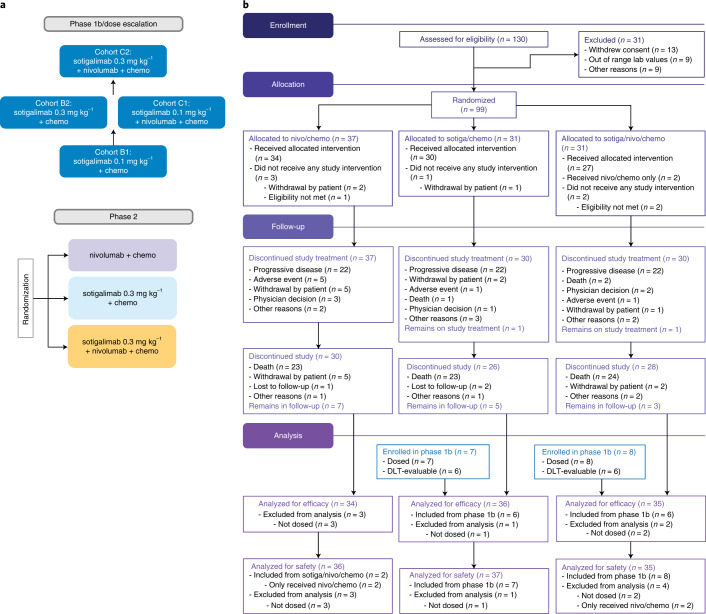
Fig. 1 PRINCE study design and CONSORT diagram. a, PRINCE was a seamless phase 1b/2 study, with the phase 2 portion randomizing patients to treatment with nivo/chemo, sotiga/chemo or sotiga/nivo/chemo. b, CONSORT diagram of the phase 2 portion of the study. Patients enrolled in cohorts B2 and C2 during phase 1b were included in safety and/or efficacy analyses of the phase 2 portion.
Fig. 1 PRINCE study design and CONSORT diagram. a, PRINCE was a seamless phase 1b/2 study, with the phase 2 portion randomizing patients to treatment with nivo/chemo, sotiga/chemo or sotiga/nivo/chemo. b, CONSORT diagram of the phase 2 portion of the study. Patients enrolled in cohorts B2 and C2 during phase 1b were included in safety and/or efficacy analyses of the phase 2 portion.CC BY · PubMed Central
Fig. 2 OS and tumor response. a, Kaplan–Meier curves of OS of patients in the efficacy population. The 1-year OS rate and corresponding one-sided, 95% lower confidence bound were estimated by the Kaplan–Meier method. P values were calculated using a one-sided, one-sample z-test of the Kaplan–Meier estimate of the 1-year OS rate (and its standard error) against the historical rate of 35%. P values were not adjusted for multiple comparisons. Median OS and corresponding two-sided, 95% CI were estimated by the Kaplan–Meier method. b, Maximum percentage change from baseline in the sum of the diameters of the target lesions for each patient with at least one post-baseline tumor assessment. Four patients in the nivo/chemo arm, one in the sotiga/chemo arm and three in the sotiga/nivo/chemo arm did not have any post-baseline tumor assessments. Confirmed CR or PR is defined as two consecutive tumor assessments at least 4 weeks apart with an overall response of CR/PR.
Fig. 2 OS and tumor response. a, Kaplan–Meier curves of OS of patients in the efficacy population. The 1-year OS rate and corresponding one-sided, 95% lower confidence bound were estimated by the Kaplan–Meier method. P values were calculated using a one-sided, one-sample z-test of the Kaplan–Meier estimate of the 1-year OS rate (and its standard error) against the historical rate of 35%. P values were not adjusted for multiple comparisons. Median OS and corresponding two-sided, 95% CI were estimated by the Kaplan–Meier method. b, Maximum percentage change from baseline in the sum of the diameters of the target lesions for each patient with at least one post-baseline tumor assessment. Four patients in the nivo/chemo arm, one in the sotiga/chemo arm and three in the sotiga/nivo/chemo arm did not have any post-baseline tumor assessments. Confirmed CR or PR is defined as two consecutive tumor assessments at least 4 weeks apart with an overall response of CR/PR.CC BY · PubMed Central
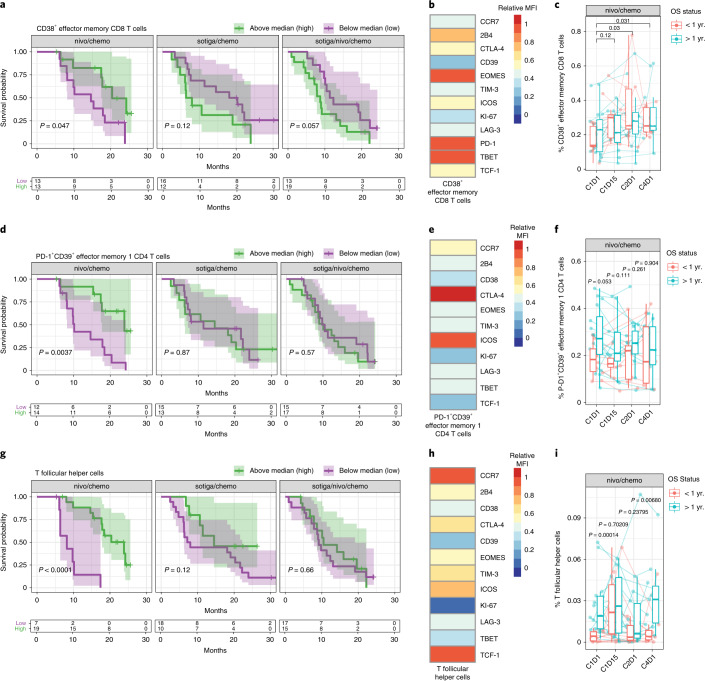
Fig. 3 Activated, antigen-experienced non-naive T cells and Tfh cells in the periphery are associated with survival in patients with mPDAC treated with nivo/chemo. a, Kaplan–Meier curves for OS stratified by frequencies of circulating CD38+ EM CD8 T cells by flow cytometry, pre-treatment (C1D1) above and below the median frequency. b, Heat map of relative median fluorescence intensity of markers on CD38+ EM CD8 T cells from pre-treatment PBMC samples across patients in the nivo/chemo arm. c, Frequencies of CD38+ EM CD8 T cells pre-treatment (C1D1) and on-treatment PBMC samples (C1D15, C2D1 and C4D1), grouped by patient survival status at 1 year. d, Kaplan–Meier curves for OS stratified by frequencies of circulating PD-1+CD39+ EM1 CD4 T cells. e, Heat map of relative median fluorescence intensity of markers present on PD-1+CD39+ EM1 CD4 T cell population from pre-treatment PBMC samples across patients in the nivo/chemo arm. f, Frequencies of PD-1+CD39+ EM1 CD4 T cells in pre-treatment (C1D1) and on-treatment PBMC samples (C1D15, C2D1 and C4D1), grouped by patient survival status at 1 year. g, Kaplan–Meier curves for OS stratified by frequencies of circulating Tfh (CXCR5+PD-1+CD4+) cells. h, Heat map of relative median fluorescence intensity of markers present on pre-treatment Tfh cells across all patients from pre-treatment PBMC samples in the nivo/chemo arm. i, Frequencies of Tfh cells pre-treatment and on-treatment (C1D15, C2D1 and C4D1). For all cell populations shown, frequencies are out of parent population. Box plots show median and quartiles, and whiskers depict 95% CI. Individual patient values are shown in thin lines. Color depicts survival status at 1 year. P values for time series represent two-sided Wilcoxon signed-rank tests between time points, illustrating changes on-treatment (c) or survival groups at each time point (f and i). On Kaplan–Meier curves, median values were determined using all data across the three arms; P values are from a log-rank test between groups; and shaded regions illustrate 95% CI. Sample sizes for cell populations are shown (c, f and i): n = 26, 21, 25 and 19 biologically independent samples at C1D1, C1D15, C2D1 and C4D1, respectively.
Fig. 3 Activated, antigen-experienced non-naive T cells and Tfh cells in the periphery are associated with survival in patients with mPDAC treated with nivo/chemo. a, Kaplan–Meier curves for OS stratified by frequencies of circulating CD38+ EM CD8 T cells by flow cytometry, pre-treatment (C1D1) above and below the median frequency. b, Heat map of relative median fluorescence intensity of markers on CD38+ EM CD8 T cells from pre-treatment PBMC samples across patients in the nivo/chemo arm. c, Frequencies of CD38+ EM CD8 T cells pre-treatment (C1D1) and on-treatment PBMC samples (C1D15, C2D1 and C4D1), grouped by patient survival status at 1 year. d, Kaplan–Meier curves for OS stratified by frequencies of circulating PD-1+CD39+ EM1 CD4 T cells. e, Heat map of relative median fluorescence intensity of markers present on PD-1+CD39+ EM1 CD4 T cell population from pre-treatment PBMC samples across patients in the nivo/chemo arm. f, Frequencies of PD-1+CD39+ EM1 CD4 T cells in pre-treatment (C1D1) and on-treatment PBMC samples (C1D15, C2D1 and C4D1), grouped by patient survival status at 1 year. g, Kaplan–Meier curves for OS stratified by frequencies of circulating Tfh (CXCR5+PD-1+CD4+) cells. h, Heat map of relative median fluorescence intensity of markers present on pre-treatment Tfh cells across all patients from pre-treatment PBMC samples in the nivo/chemo arm. i, Frequencies of Tfh cells pre-treatment and on-treatment (C1D15, C2D1 and C4D1). For all cell populations shown, frequencies are out of parent population. Box plots show median and quartiles, and whiskers depict 95% CI. Individual patient values are shown in thin lines. Color depicts survival status at 1 year. P values for time series represent two-sided Wilcoxon signed-rank tests between time points, illustrating changes on-treatment (c) or survival groups at each time point (f and i). On Kaplan–Meier curves, median values were determined using all data across the three arms; P values are from a log-rank test between groups; and shaded regions illustrate 95% CI. Sample sizes for cell populations are shown (c, f and i): n = 26, 21, 25 and 19 biologically independent samples at C1D1, C1D15, C2D1 and C4D1, respectively.CC BY · PubMed Central
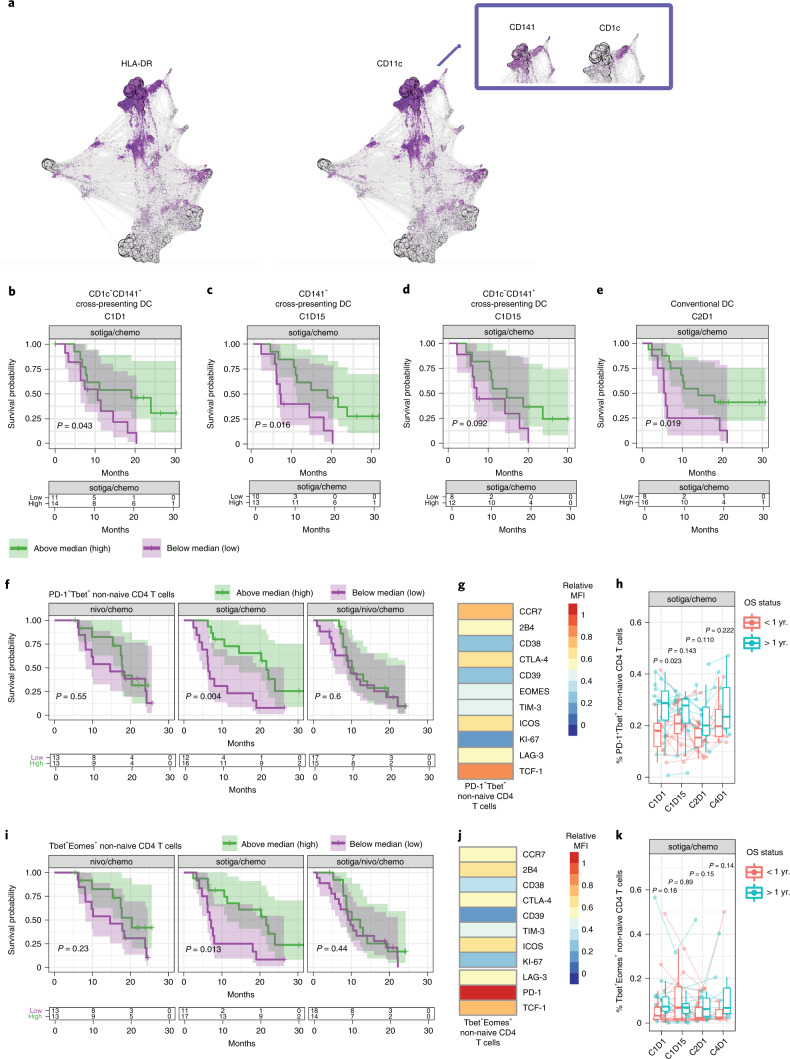
Fig. 4 Cross-presenting, activated APCs and type-1 helper T cells in circulation associate with survival in patients receiving sotiga/chemo treatment. a, Force-directed graph visualization of unsupervised clustering of cells from CyTOF across all patients and time points, with callout box of DC phenotypes associating with survival and followed up on with gating analysis in further panels. b–f, Kaplan–Meier curve for OS stratified by median values. b, Circulating CD1c+ cross-presenting DCs (CD141+) at C1D1 c, Cross-presenting DCs (CD141+) at C1D15. d, CD1c− cross-presenting DCs (CD141+) at C1D15. cDCs at C2D1 (e) and pre-treatment PD-1+Tbet+ non-naive CD4 T cells (f). g, Heat map of pre-treatment median fluorescence intensity of markers present on PD-1+Tbet+ non-naive CD4 T cells. h, Frequencies of PD-1+Tbet+ non-naive CD4 T cells pre-treatment (C1D1) and on-treatment (C1D15, C2D1 and C4D1), grouped by survival status at 1 year. i, Kaplan–Meier curves for OS stratified by frequency of pre-treatment Tbet+Eomes+ non-naive CD4 T cells. j, Heat map of pre-treatment median fluorescence intensity of markers present on Tbet+Eomes+ non-naive CD4 T cells. k, Frequencies of Tbet+Eomes+ non-naive CD4 T cells pre-treatment (C1D1) and on-treatment (C1D15, C2D1 and C4D1), grouped by survival status at 1 year. For DC populations, frequencies are out of total leukocytes. For T cell populations, frequencies are out of parent. Box plots show median and quartiles, and whiskers depict 95% CI. Individual patient values are shown in thin lines and colored by survival status at 1 year. P values for time series represent two-sided Wilcoxon signed-rank tests between survival groups at each time point. On Kaplan–Meier curves, median values were determined using all data across the three arms; P values are from a log-rank test between groups; and shaded regions illustrate 95% CI. Sample sizes for cell populations (a−e): n = 29, 23, 24 and 22 biologically independent samples at C1D1, C1D15, C2D1 and C4D1, respectively. Sample sizes for cell populations are shown (f–k): n = 28, 23, 27 and 18 biologically independent samples at C1D1, C1D15, C2D1 and C4D1, respectively.
Fig. 4 Cross-presenting, activated APCs and type-1 helper T cells in circulation associate with survival in patients receiving sotiga/chemo treatment. a, Force-directed graph visualization of unsupervised clustering of cells from CyTOF across all patients and time points, with callout box of DC phenotypes associating with survival and followed up on with gating analysis in further panels. b–f, Kaplan–Meier curve for OS stratified by median values. b, Circulating CD1c+ cross-presenting DCs (CD141+) at C1D1 c, Cross-presenting DCs (CD141+) at C1D15. d, CD1c− cross-presenting DCs (CD141+) at C1D15. cDCs at C2D1 (e) and pre-treatment PD-1+Tbet+ non-naive CD4 T cells (f). g, Heat map of pre-treatment median fluorescence intensity of markers present on PD-1+Tbet+ non-naive CD4 T cells. h, Frequencies of PD-1+Tbet+ non-naive CD4 T cells pre-treatment (C1D1) and on-treatment (C1D15, C2D1 and C4D1), grouped by survival status at 1 year. i, Kaplan–Meier curves for OS stratified by frequency of pre-treatment Tbet+Eomes+ non-naive CD4 T cells. j, Heat map of pre-treatment median fluorescence intensity of markers present on Tbet+Eomes+ non-naive CD4 T cells. k, Frequencies of Tbet+Eomes+ non-naive CD4 T cells pre-treatment (C1D1) and on-treatment (C1D15, C2D1 and C4D1), grouped by survival status at 1 year. For DC populations, frequencies are out of total leukocytes. For T cell populations, frequencies are out of parent. Box plots show median and quartiles, and whiskers depict 95% CI. Individual patient values are shown in thin lines and colored by survival status at 1 year. P values for time series represent two-sided Wilcoxon signed-rank tests between survival groups at each time point. On Kaplan–Meier curves, median values were determined using all data across the three arms; P values are from a log-rank test between groups; and shaded regions illustrate 95% CI. Sample sizes for cell populations (a−e): n = 29, 23, 24 and 22 biologically independent samples at C1D1, C1D15, C2D1 and C4D1, respectively. Sample sizes for cell populations are shown (f–k): n = 28, 23, 27 and 18 biologically independent samples at C1D1, C1D15, C2D1 and C4D1, respectively.CC BY · PubMed Central
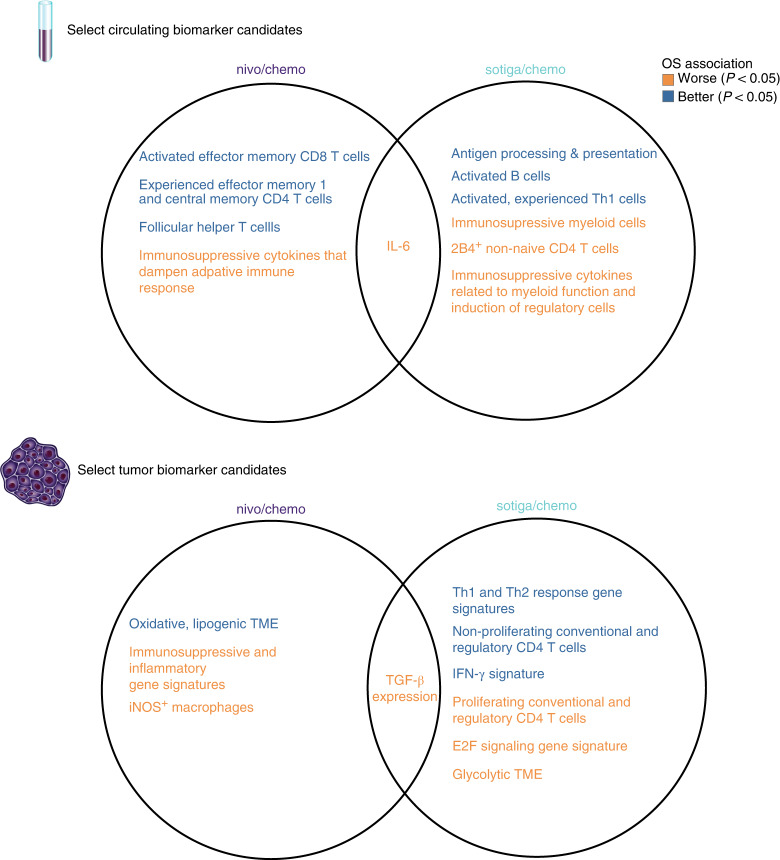
Fig. 5 Biomarkers of survival after nivo/chemo and sotiga/chemo and their overlap. Venn diagrams of broad categories of circulating biomarkers (top). Left circle shows biomarkers of survival after nivo/chemo; right circle shows biomarkers of survival after sotiga/chemo; and center shows overlapping biomarkers that are associated with survival in both treatment groups. Color indicates direction of association, with blue for higher values associating with longer survival and red for higher values associating with shorter survival by log-rank test. The same structure is shown for tumor biomarkers (bottom).
Fig. 5 Biomarkers of survival after nivo/chemo and sotiga/chemo and their overlap. Venn diagrams of broad categories of circulating biomarkers (top). Left circle shows biomarkers of survival after nivo/chemo; right circle shows biomarkers of survival after sotiga/chemo; and center shows overlapping biomarkers that are associated with survival in both treatment groups. Color indicates direction of association, with blue for higher values associating with longer survival and red for higher values associating with shorter survival by log-rank test. The same structure is shown for tumor biomarkers (bottom).CC BY · PubMed Central
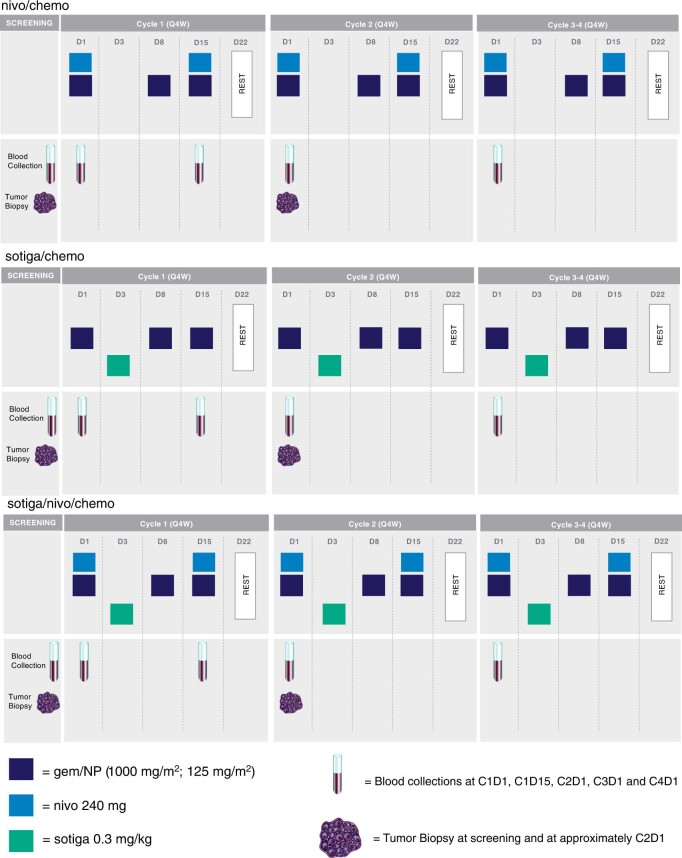
Extended Data Fig. 1 PRINCE schema for dosing and sample collection schedule. Schema shows standard dosing schedule and relevant sample collection timepoints for each treatment arm. All drugs were given intravenously. The study protocol provides additional details on allowable modifications to the dosing schedule.
Extended Data Fig. 1 PRINCE schema for dosing and sample collection schedule. Schema shows standard dosing schedule and relevant sample collection timepoints for each treatment arm. All drugs were given intravenously. The study protocol provides additional details on allowable modifications to the dosing schedule.CC BY · PubMed Central
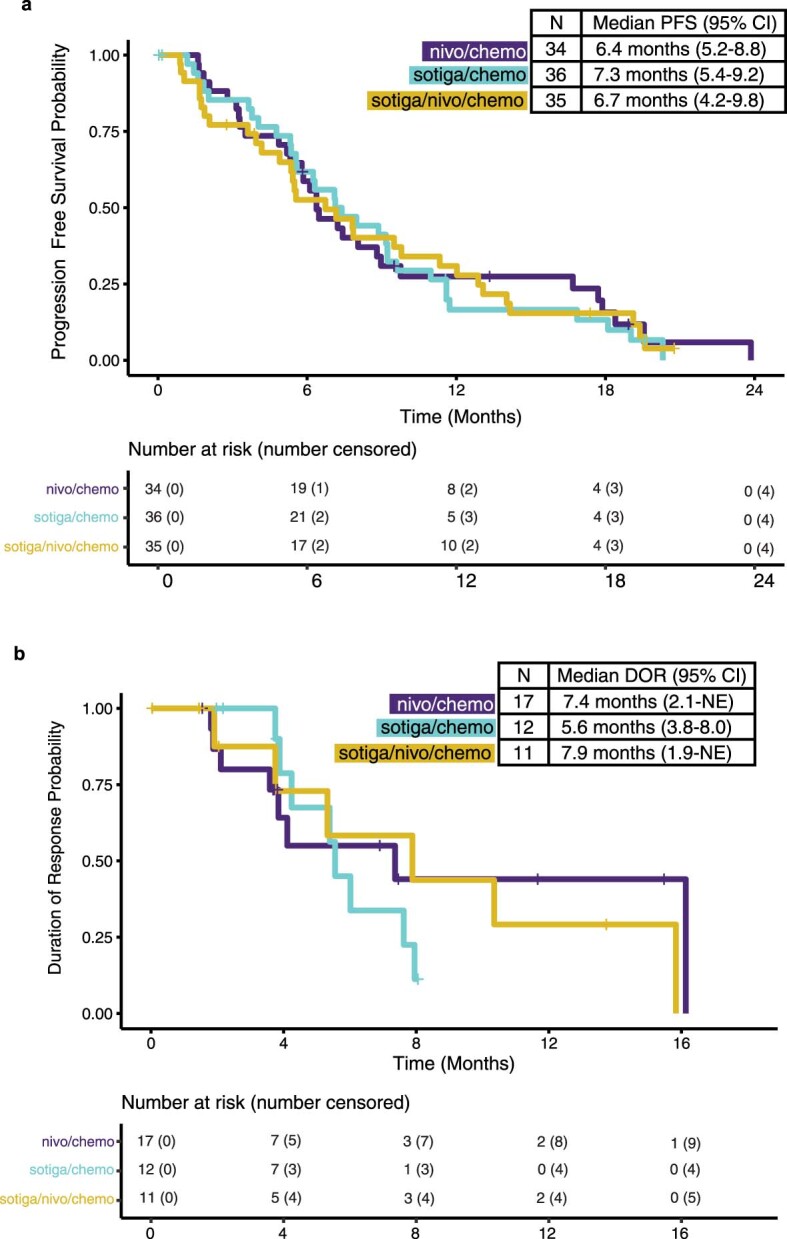
Extended Data Fig. 2 Kaplan-Meier curves of progression-free survival and duration of response. a, Progression-free survival (PFS) of patients in the efficacy population. b, Duration of response (DOR) of patients in the efficacy population who had a partial or complete response. PFS, DOR and the corresponding 2-sided 95% confidence interval (CI) were estimated by the Kaplan-Meier method. CI = confidence interval; NE = not estimable.
Extended Data Fig. 2 Kaplan-Meier curves of progression-free survival and duration of response. a, Progression-free survival (PFS) of patients in the efficacy population. b, Duration of response (DOR) of patients in the efficacy population who had a partial or complete response. PFS, DOR and the corresponding 2-sided 95% confidence interval (CI) were estimated by the Kaplan-Meier method. CI = confidence interval; NE = not estimable.CC BY · PubMed Central
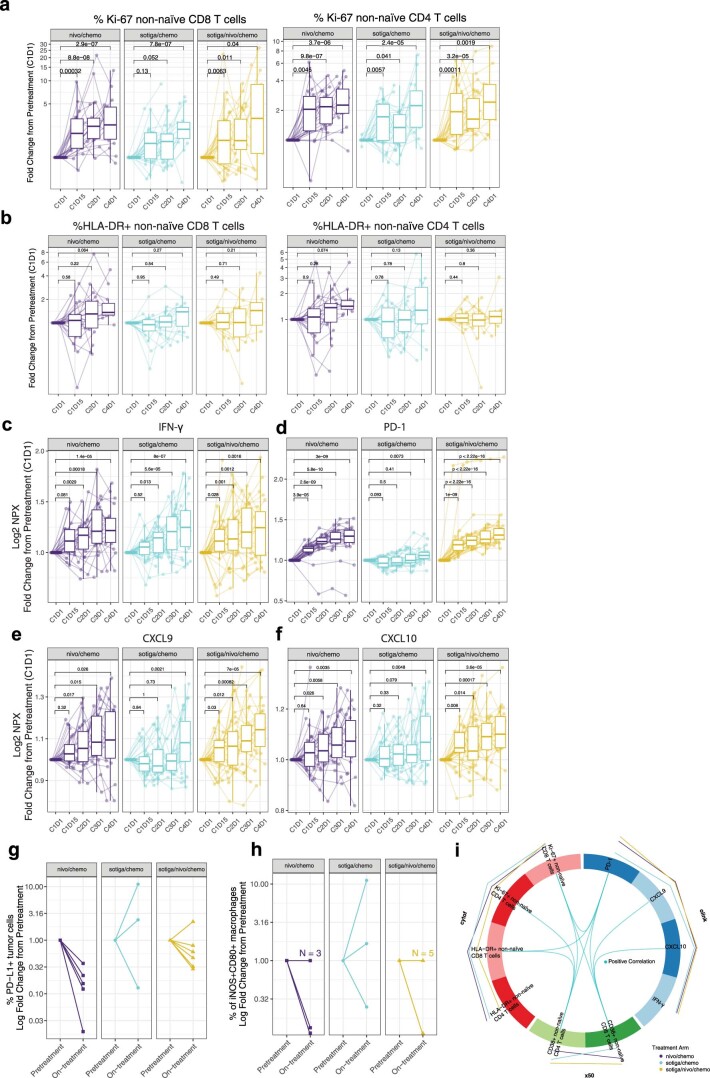
Extended Data Fig. 3 Biomarker signatures in blood and tumor reveal specific immune mechanisms of activation in response to nivo/chemo and sotiga/chemo treatment in patients with mPDAC. a, Change in frequencies of circulating Ki-67+ non-naïve CD8 (left panel) and CD4 (right panel) T cells, as a fraction of total non-naïve CD8 or CD4 T cells respectively, in patients from each arm over the course of treatment by flow cytometry. b, Change in frequencies of circulating HLA-DR+ non-naïve CD8 (b, left panel) and CD4 (b, right panel) T cells, as a fraction of total non-naïve CD8 or CD4 T cells respectively, in patients from each arm over the course of treatment by Cytof. c,d,e,f, Change in Log2 expression of circulating IFN-γ (c), PD-1 (d), CXCL9 (e) and CXCL10 (f) from pretreatment values from each arm by Olink analysis. Timeseries box plots in a-f are shown as fold change relative to C1D1 and plotted on a pseudo-log scale. Median values and quartiles are shown. The whiskers depict 95% CI. Individual patient values are shown in thin lines and colored by survival status at 1 year. P-values represent two-sided Wilcoxon signed-rank tests between timepoints, illustrating increases on-treatment. g, h, Frequencies of PD-L1+ tumor cells (g) and intratumoral iNOS+CD80+ macrophages (h) from mIF of on-treatment biopsies (C2D1 when feasible, see methods for details), shown as a fold change relative to pretreatment biopsy for each arm. i, DIABLO Circos plot showing results of integrative analysis where select factors from CyTOF, X50 flow cytometry and Olink, significantly associated with on-treatment (C2D1) effects and correlations among these factors and treatment arms. In the Circos plot, lines outside the circle indicate magnitude and direction of treatment association (the further distance from the circle, the greater the association). Lines inside the plot indicate positive (blue) correlations between biomarker factors. For all cell populations shown, frequencies are out of parent population. Sample sizes for all cell populations identified through CyTOF analysis (b): n = 25, 20, 23, 13; n = 29, 23, 24, 22; n = 26, 20, 26, 13 biologically independent samples at C1D1, C1D15, C2D1 and C4D1 in nivo/chemo, sotiga/chemo, sotiga/nivo/chemo treatment arms, respectively. Sample sizes for all cell populations identified through flow cytometry analysis (a): n = 26, 21, 25, 19; n = 28, 23, 27, 18; n = 32, 27, 29, 14 biologically independent samples at C1D1, C1D15, C2D1 and C4D1 in nivo/chemo, sotiga/chemo, sotiga/nivo/chemo treatment arms, respectively. Sample sizes for all soluble proteins identified through proteomic analysis (c,d,e,f): n = 32, 25, 27, 25, 23; n = 36, 29, 31, 25, 27; n = 35, 27, 32, 26, 25 biologically independent samples at C1D1, C1D15, C2D1, C3D1, and C4D1 in nivo/chemo, sotiga/chemo, sotiga/nivo/chemo treatment arms, respectively. Sample sizes for all cell populations identified through mIF (g,h): n = 5, 3, 6, biologically independent matched paired samples at C1D1 and approximately C2D1 in nivo/chemo, sotiga/chemo, sotiga/nivo/chemo treatment arms, respectively. (i): n = 22, 23, 21 biologically independent matched samples at C2D1 in nivo/chemo, sotiga/chemo, sotiga/nivo/chemo treatment arms respectively for CyTOF, X50 flow cytometry and Olink integrative analysis.
Extended Data Fig. 3 Biomarker signatures in blood and tumor reveal specific immune mechanisms of activation in response to nivo/chemo and sotiga/chemo treatment in patients with mPDAC. a, Change in frequencies of circulating Ki-67+ non-naïve CD8 (left panel) and CD4 (right panel) T cells, as a fraction of total non-naïve CD8 or CD4 T cells respectively, in patients from each arm over the course of treatment by flow cytometry. b, Change in frequencies of circulating HLA-DR+ non-naïve CD8 (b, left panel) and CD4 (b, right panel) T cells, as a fraction of total non-naïve CD8 or CD4 T cells respectively, in patients from each arm over the course of treatment by Cytof. c,d,e,f, Change in Log2 expression of circulating IFN-γ (c), PD-1 (d), CXCL9 (e) and CXCL10 (f) from pretreatment values from each arm by Olink analysis. Timeseries box plots in a-f are shown as fold change relative to C1D1 and plotted on a pseudo-log scale. Median values and quartiles are shown. The whiskers depict 95% CI. Individual patient values are shown in thin lines and colored by survival status at 1 year. P-values represent two-sided Wilcoxon signed-rank tests between timepoints, illustrating increases on-treatment. g, h, Frequencies of PD-L1+ tumor cells (g) and intratumoral iNOS+CD80+ macrophages (h) from mIF of on-treatment biopsies (C2D1 when feasible, see methods for details), shown as a fold change relative to pretreatment biopsy for each arm. i, DIABLO Circos plot showing results of integrative analysis where select factors from CyTOF, X50 flow cytometry and Olink, significantly associated with on-treatment (C2D1) effects and correlations among these factors and treatment arms. In the Circos plot, lines outside the circle indicate magnitude and direction of treatment association (the further distance from the circle, the greater the association). Lines inside the plot indicate positive (blue) correlations between biomarker factors. For all cell populations shown, frequencies are out of parent population. Sample sizes for all cell populations identified through CyTOF analysis (b): n = 25, 20, 23, 13; n = 29, 23, 24, 22; n = 26, 20, 26, 13 biologically independent samples at C1D1, C1D15, C2D1 and C4D1 in nivo/chemo, sotiga/chemo, sotiga/nivo/chemo treatment arms, respectively. Sample sizes for all cell populations identified through flow cytometry analysis (a): n = 26, 21, 25, 19; n = 28, 23, 27, 18; n = 32, 27, 29, 14 biologically independent samples at C1D1, C1D15, C2D1 and C4D1 in nivo/chemo, sotiga/chemo, sotiga/nivo/chemo treatment arms, respectively. Sample sizes for all soluble proteins identified through proteomic analysis (c,d,e,f): n = 32, 25, 27, 25, 23; n = 36, 29, 31, 25, 27; n = 35, 27, 32, 26, 25 biologically independent samples at C1D1, C1D15, C2D1, C3D1, and C4D1 in nivo/chemo, sotiga/chemo, sotiga/nivo/chemo treatment arms, respectively. Sample sizes for all cell populations identified through mIF (g,h): n = 5, 3, 6, biologically independent matched paired samples at C1D1 and approximately C2D1 in nivo/chemo, sotiga/chemo, sotiga/nivo/chemo treatment arms, respectively. (i): n = 22, 23, 21 biologically independent matched samples at C2D1 in nivo/chemo, sotiga/chemo, sotiga/nivo/chemo treatment arms respectively for CyTOF, X50 flow cytometry and Olink integrative analysis.CC BY · PubMed Central
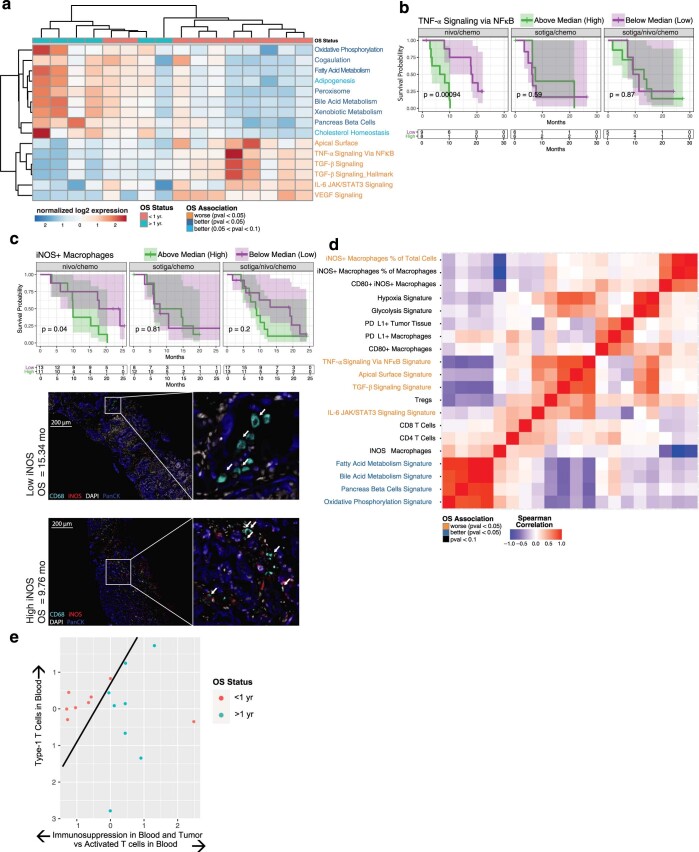
Extended Data Fig. 4 A non-immunosuppressive tumor microenvironment and activated circulating CD8 T cells before treatment are associated with survival in mPDAC patients treated with nivo/chemo. a, Heatmap showing results of unsupervised clustering of gene expression signatures and survival status in the nivo/chemo arm. Individual patients are shown in columns and annotated by survival status at 1 year to illustrate association. Gene expression signature labels are color coded based on survival association by log-rank test. KM curves for overall survival stratified by median values at baseline of b, TNF-α via NFκB hallmark pathway signature score and c, Percentage of iNOS+ intratumoral macrophages out of total cells from mIF (c, top panel). Representative pretreatment tumor mIF images showing iNOS+ cells from two patients with labels showing marker grouping (low = below median, high= above median) and individual patient survival (c, bottom panel). d, Spearman correlation matrix of tumor immune populations and gene expression signatures in pretreatment tumor biopsies, with labels color coded by association with survival association by log-rank test. Note the Y-axis labels are to be repeated along the X-axis (bottom to top on Y-axis corresponding to left to right on X-axis). e, Multi-omic dimensionality reduction of circulating factors and tumor data using Independent Component Analysis, with each dot representing a single patient colored by survival status at one year and with position determined by reduced dimensionality across all tumor and circulating biomarkers. Black separating line serves to illustrate a separation and is not computationally derived. On all KM curves, median values were determined using all data across the 3 arms, P-values are from a log-rank test between groups, and shaded regions illustrate 95% CI.
Extended Data Fig. 4 A non-immunosuppressive tumor microenvironment and activated circulating CD8 T cells before treatment are associated with survival in mPDAC patients treated with nivo/chemo. a, Heatmap showing results of unsupervised clustering of gene expression signatures and survival status in the nivo/chemo arm. Individual patients are shown in columns and annotated by survival status at 1 year to illustrate association. Gene expression signature labels are color coded based on survival association by log-rank test. KM curves for overall survival stratified by median values at baseline of b, TNF-α via NFκB hallmark pathway signature score and c, Percentage of iNOS+ intratumoral macrophages out of total cells from mIF (c, top panel). Representative pretreatment tumor mIF images showing iNOS+ cells from two patients with labels showing marker grouping (low = below median, high= above median) and individual patient survival (c, bottom panel). d, Spearman correlation matrix of tumor immune populations and gene expression signatures in pretreatment tumor biopsies, with labels color coded by association with survival association by log-rank test. Note the Y-axis labels are to be repeated along the X-axis (bottom to top on Y-axis corresponding to left to right on X-axis). e, Multi-omic dimensionality reduction of circulating factors and tumor data using Independent Component Analysis, with each dot representing a single patient colored by survival status at one year and with position determined by reduced dimensionality across all tumor and circulating biomarkers. Black separating line serves to illustrate a separation and is not computationally derived. On all KM curves, median values were determined using all data across the 3 arms, P-values are from a log-rank test between groups, and shaded regions illustrate 95% CI.CC BY · PubMed Central
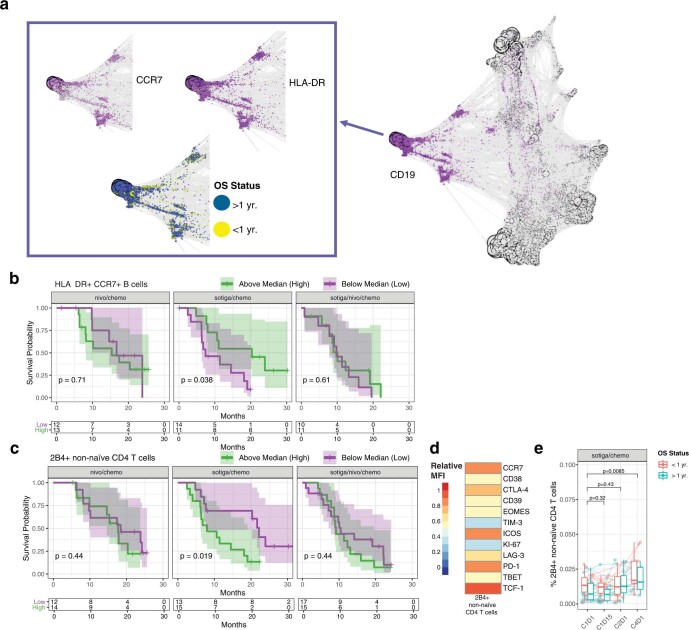
Extended Data Fig. 5 Higher frequencies of specific B cell populations and lower concentrations of 2B4+ T cells are associated with survival in patients treated with sotiga/chemo. a, Force-directed graph visualization of unsupervised clustering of cells from CyTOF across all patients and timepoints, illustrating a specific population of B cells (CD19+, CCR7+, HLA-DR+) associating with survival and followed up on with gating analysis in further panels. b, KM curves for overall survival stratified by frequencies of pretreatment circulating HLA-DR+ CCR7+ B cells out of total leukocytes, above and below the median frequency. c, KM curves for overall survival stratified by frequency of pretreatment circulating 2B4+ non-naïve CD4 T cells out of total non-naïve CD4 T cells. d, Heatmap of pretreatment relative median fluorescence intensity of markers present on 2B4+ non-naïve CD4 T cells across all patients. e, Frequencies of 2B4+ non-naïve CD4 T cells pretreatment (C1D1) and on-treatment (C1D15, C2D1, and C4D1), grouped by survival status at 1 year. Box plots show median and quartiles and whiskers depict 95% CI. Individual patient values are shown in thin lines and colored by survival status at 1 year. P-values represent two-sided Wilcoxon signed-rank tests between timepoints, illustrating changes on-treatment. On all KM curves, median values were determined using all data across the 3 arms, P-values are from a log-rank test between groups, and shaded regions illustrate 95% CI. Sample sizes for cell populations shown in e: n = 28, 23, 27 and 18 biologically independent samples at C1D1, C1D15, C2D1 and C4D1.
Extended Data Fig. 5 Higher frequencies of specific B cell populations and lower concentrations of 2B4+ T cells are associated with survival in patients treated with sotiga/chemo. a, Force-directed graph visualization of unsupervised clustering of cells from CyTOF across all patients and timepoints, illustrating a specific population of B cells (CD19+, CCR7+, HLA-DR+) associating with survival and followed up on with gating analysis in further panels. b, KM curves for overall survival stratified by frequencies of pretreatment circulating HLA-DR+ CCR7+ B cells out of total leukocytes, above and below the median frequency. c, KM curves for overall survival stratified by frequency of pretreatment circulating 2B4+ non-naïve CD4 T cells out of total non-naïve CD4 T cells. d, Heatmap of pretreatment relative median fluorescence intensity of markers present on 2B4+ non-naïve CD4 T cells across all patients. e, Frequencies of 2B4+ non-naïve CD4 T cells pretreatment (C1D1) and on-treatment (C1D15, C2D1, and C4D1), grouped by survival status at 1 year. Box plots show median and quartiles and whiskers depict 95% CI. Individual patient values are shown in thin lines and colored by survival status at 1 year. P-values represent two-sided Wilcoxon signed-rank tests between timepoints, illustrating changes on-treatment. On all KM curves, median values were determined using all data across the 3 arms, P-values are from a log-rank test between groups, and shaded regions illustrate 95% CI. Sample sizes for cell populations shown in e: n = 28, 23, 27 and 18 biologically independent samples at C1D1, C1D15, C2D1 and C4D1.CC BY · PubMed Central
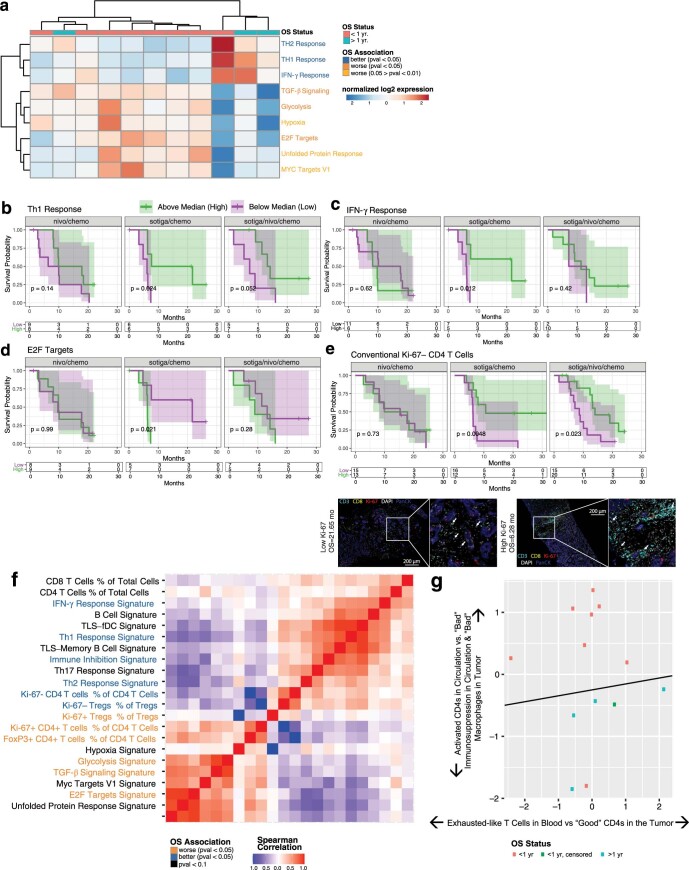
Extended Data Fig. 6 T helper signatures and proliferating CD4 T cells in the tumor associate with survival in patients receiving sotiga/chemo treatment. a, Heatmap showing results of unsupervised clustering of gene expression signatures and survival status in the sotiga/chemo arm. Individual patients are shown in columns and annotated by survival status at 1 year to illustrate association. Gene expression signature labels are color coded based on survival association by log-rank test, calculated independently from unsupervised clustering. b, c, d, KM curves for overall survival stratified by median values of Th1 (b), IFNγ (c), and E2F (d) gene expression signatures. e, KM curve for overall survival stratified by median values of Ki-67− Foxp3- CD4 T cells from mIF on pretreatment tumor samples (e, top panel) and representative images from tumor samples high and low in Ki-67- Foxp3- CD4 T cells (e, bottom panel). Labels indicate marker grouping and patient survival values. f, Spearman correlation matrix of tumor immune infiltrate and gene expression signatures in pretreatment tumor biopsies, with labels colored by association with overall survival by log-rank test. g, Multi-omic dimensionality reduction of circulating factors and tumor data using Independent Component Analysis, with each dot representing a single patient colored by survival status at one year and with position determined by reduced dimensionality across all tumor and circulating biomarkers. Black separating line serves to illustrate a separation and is not computationally derived. On all KM curves, median values were determined using all data across the 3 arms, P-values are from a log-rank test between groups, and shaded regions illustrate 95% CI.
Extended Data Fig. 6 T helper signatures and proliferating CD4 T cells in the tumor associate with survival in patients receiving sotiga/chemo treatment. a, Heatmap showing results of unsupervised clustering of gene expression signatures and survival status in the sotiga/chemo arm. Individual patients are shown in columns and annotated by survival status at 1 year to illustrate association. Gene expression signature labels are color coded based on survival association by log-rank test, calculated independently from unsupervised clustering. b, c, d, KM curves for overall survival stratified by median values of Th1 (b), IFNγ (c), and E2F (d) gene expression signatures. e, KM curve for overall survival stratified by median values of Ki-67− Foxp3- CD4 T cells from mIF on pretreatment tumor samples (e, top panel) and representative images from tumor samples high and low in Ki-67- Foxp3- CD4 T cells (e, bottom panel). Labels indicate marker grouping and patient survival values. f, Spearman correlation matrix of tumor immune infiltrate and gene expression signatures in pretreatment tumor biopsies, with labels colored by association with overall survival by log-rank test. g, Multi-omic dimensionality reduction of circulating factors and tumor data using Independent Component Analysis, with each dot representing a single patient colored by survival status at one year and with position determined by reduced dimensionality across all tumor and circulating biomarkers. Black separating line serves to illustrate a separation and is not computationally derived. On all KM curves, median values were determined using all data across the 3 arms, P-values are from a log-rank test between groups, and shaded regions illustrate 95% CI.CC BY · PubMed Central
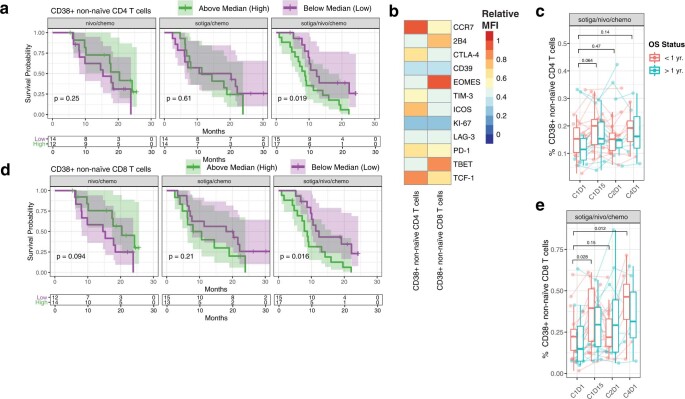
Extended Data Fig. 7 Lower frequencies of circulating CD38+ non-naïve T cells are associated with longer survival in patients treated with sotiga/nivo/chemo. a,d, KM curves for overall survival stratified by frequencies of circulating CD38+ non-naïve CD4 (a) and CD8 (d) T cells at baseline, above and below the median frequency value. b, Heatmaps of relative median fluorescent intensity of pretreatment markers present on CD38+ non-naïve CD4 and CD8 T cells across all patients. c, e, Frequencies of CD38+ non-naïve CD4 (c) and CD8 (e) T cells pretreatment (C1D1) and on-treatment (C1D15, C2D1, and C4D1), grouped by survival status at 1 year. For all cell populations shown, frequencies are out of parent. Box plots show median and quartiles and whiskers depict 95% CI. Individual patient values are shown in thin lines and colored by survival status at 1 year. P-values for timeseries represent two-sided Wilcoxon signed-rank tests between timepoints, illustrating changes on-treatment. On KM curves, median values were determined using all data across the 3 arms, P-values are from a log-rank test between groups, and shaded regions illustrate 95% CI. Sample sizes for cell populations shown (c, e): n = 32, 27, 29 and 14 biologically independent samples at C1D1, C1D15, C2D1 and C4D1.
Extended Data Fig. 7 Lower frequencies of circulating CD38+ non-naïve T cells are associated with longer survival in patients treated with sotiga/nivo/chemo. a,d, KM curves for overall survival stratified by frequencies of circulating CD38+ non-naïve CD4 (a) and CD8 (d) T cells at baseline, above and below the median frequency value. b, Heatmaps of relative median fluorescent intensity of pretreatment markers present on CD38+ non-naïve CD4 and CD8 T cells across all patients. c, e, Frequencies of CD38+ non-naïve CD4 (c) and CD8 (e) T cells pretreatment (C1D1) and on-treatment (C1D15, C2D1, and C4D1), grouped by survival status at 1 year. For all cell populations shown, frequencies are out of parent. Box plots show median and quartiles and whiskers depict 95% CI. Individual patient values are shown in thin lines and colored by survival status at 1 year. P-values for timeseries represent two-sided Wilcoxon signed-rank tests between timepoints, illustrating changes on-treatment. On KM curves, median values were determined using all data across the 3 arms, P-values are from a log-rank test between groups, and shaded regions illustrate 95% CI. Sample sizes for cell populations shown (c, e): n = 32, 27, 29 and 14 biologically independent samples at C1D1, C1D15, C2D1 and C4D1.CC BY · PubMed Central
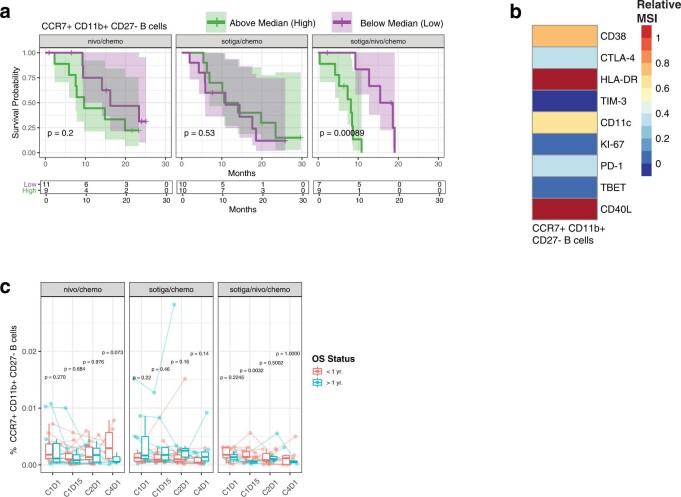
Extended Data Fig. 8 Survival in response to combinational therapy of sotiga/nivo/chemo may be affected by regulatory B cells in circulation. a, KM curves for overall survival stratified by CCR7+ CD11b+ CD27- B cells above and below the median frequency value. b, Heatmap of relative median signal intensity of different proteins present on CCR7+ CD11b+ CD27- B cells on-treatment (C1D15) across all patients. c, Frequencies of CCR7+ CD11b+ CD27- B cells pretreatment (C1D1) and on-treatment (C1D15, C2D1, C4D1), grouped by survival status at 1 year, for each treatment arm. For all cell populations shown, frequencies are out of total leukocytes. On KM curves, median values were determined using all data across the 3 arms, P-values are from a log-rank test between groups, and shaded regions illustrate 95% CI. Box plots show median and quartiles and whiskers depict 95% CI. Individual patient values are shown in thin lines and colored by survival status at 1 year. P-values for timeseries represent two-sided Wilcoxon signed-rank tests between survival groups at each timepoint. Sample sizes for cell populations shown (c): n = 25, 20, 23, 13; n = 29, 23, 24, 22; n = 26, 20, 26, 13 biologically independent samples at C1D1, C1D15, C2D1 and C4D1 in nivo/chemo, sotiga/chemo, sotiga/nivo/chemo treatment arms, respectively.
Extended Data Fig. 8 Survival in response to combinational therapy of sotiga/nivo/chemo may be affected by regulatory B cells in circulation. a, KM curves for overall survival stratified by CCR7+ CD11b+ CD27- B cells above and below the median frequency value. b, Heatmap of relative median signal intensity of different proteins present on CCR7+ CD11b+ CD27- B cells on-treatment (C1D15) across all patients. c, Frequencies of CCR7+ CD11b+ CD27- B cells pretreatment (C1D1) and on-treatment (C1D15, C2D1, C4D1), grouped by survival status at 1 year, for each treatment arm. For all cell populations shown, frequencies are out of total leukocytes. On KM curves, median values were determined using all data across the 3 arms, P-values are from a log-rank test between groups, and shaded regions illustrate 95% CI. Box plots show median and quartiles and whiskers depict 95% CI. Individual patient values are shown in thin lines and colored by survival status at 1 year. P-values for timeseries represent two-sided Wilcoxon signed-rank tests between survival groups at each timepoint. Sample sizes for cell populations shown (c): n = 25, 20, 23, 13; n = 29, 23, 24, 22; n = 26, 20, 26, 13 biologically independent samples at C1D1, C1D15, C2D1 and C4D1 in nivo/chemo, sotiga/chemo, sotiga/nivo/chemo treatment arms, respectively.CC BY · PubMed Central

Verification

Claims the paper makes

The claims and statistics of this paper haven’t been checked yet.

Run the check — free, no account needed. It reads the open-access text and checks the sources it cites.

A few free checks a day · papers already verified open instantly · results are public

Claims other papers make about this one

Each is checked against this paper’s own text: does it say what the citing paper says it does?

Self-check

Percentages, sums and reported differences re-computed from the paper’s own numbers.

The self-check needs the paper’s full text.

Citations

Cites

Show all 45 references

Cited by

Sorted by citations

See all 385

Metadata

Authors
Padrón, L. J., Maurer, D. M., O’Hara, M. H., O’Reilly, E. M., Wolff, R. A., Wainberg, Z. A., Ko, A. H., Fisher, G., Rahma, O., Lyman, J. P., Cabanski, C. R., Yu, J. X., Pfeiffer, S. M., Spasic, M., Xu, J., Gherardini, P. F., Karakunnel, J., Mick, R., Alanio, C., Byrne, K. T., Hollmann, T. J., Moore, J. S., Jones, D. D., Tognetti, M., Chen, R. O., Yang, X., Salvador, L., Wherry, E. J., Dugan, U., O’Donnell-Tormey, J., Butterfield, L. H., Hubbard-Lucey, V. M., Ibrahim, R., Fairchild, J., Bucktrout, S., LaVallee, T. M., & Vonderheide, R. H.
Affiliations
  • Parker Institute for Cancer Immunotherapy (US)
  • Abramson Cancer Center (US)
  • The University of Texas MD Anderson Cancer Center (US)
  • University of California, Los Angeles (US)
  • University of California, San Francisco (US)
  • Stanford University (US)
  • Dana-Farber Cancer Institute (US)
  • Memorial Sloan Kettering Cancer Center (US)
  • Biognosys (Switzerland) (CH)
  • Personalis (United States) (US)
  • Apexigen (United States) (US)
  • Bristol-Myers Squibb (United States) (US)
  • Cancer Research Institute (US)
Corresponding author
  • Padrón, Lacey J.
  • Vonderheide, Robert H.
Venue
Nature Medicine
Published
2022-06
Volume
28
Issue
6
Pages
1167-1177
ISSN
  • 1078-8956 (ISSN-L)
  • 1546-170X
OpenAlex
W4282037063
Cited by
384
References
45
Citations by year
2026: 98 · 2025: 88 · 2024: 109 · 2023: 66 · 2022: 23
FWCI
30.11
Type
journal article
Language
en
Open access
Locations
  • Nature Medicine (publishedVersion, cc-by)
  • PubMed Central (publishedVersion, cc-by)
  • PubMed (publishedVersion)
  • Cineca Institutional Research Information System (Tor Vergata University) (submittedVersion, cc-by)
  • eScholarship (California Digital Library) (submittedVersion, cc-by)
Funders
  • Cancer Research Institute
  • Bristol-Myers Squibb
  • University of Pennsylvania
  • Memorial Sloan-Kettering Cancer Center
  • Parker Institute for Cancer Immunotherapy
  • National Cancer Institute (P30CA008748)
Topics
  • Health Sciences › Medicine › Oncology › Pancreatic and Hepatic Oncology Research
  • Health Sciences › Medicine › Oncology › Cancer Immunotherapy and Biomarkers
  • Health Sciences › Medicine › Surgery › Cholangiocarcinoma and Gallbladder Cancer Studies
Keywords
nivolumab, metastatic pancreatic ductal adenocarcinoma, first-line therapy, chemoimmunotherapy, anti-PD-1, gemcitabine, nab-paclitaxel, overall survival, tumor immune microenvironment, peripheral blood T cells, CD4+ T cell infiltration, treatment response biomarkers
MeSH terms
Nivolumab, Albumins, Antibodies, Monoclonal, Antineoplastic Agents, Antineoplastic Combined Chemotherapy Protocols, Humans, Pancreatic Neoplasms, Carcinoma, Pancreatic Ductal, Tumor Microenvironment

About these checks

Registry, retraction, Cites and statistics results are computed, not judged, with one exception: a printed reference that no index lists is read once by a model before it counts as a citation error. Claims are extracted by a model and kept only when their quote appears verbatim in the text; each cited source is then checked, with a model’s help, for whether it says what the claim relies on. Those verdicts can be wrong — read the claim’s quote and the cited source before relying on one.

Statistics and arithmetic are recomputed, not judged.

Confidence bands are shown only for fields calibrated on our annotated test set. None is calibrated yet, so no band is shown.

What counts as a claim ›How we measure confidence ›How we check this ›

Are you an author, or do you see a problem with this page? Request a review