

The DOI matches its Crossref record; 59 of the 59 references it cites were found in a registry or an index.
Collaboration between clinicians and vision–language models in radiology report generation
Open accessPublished version of a preprint
Abstract
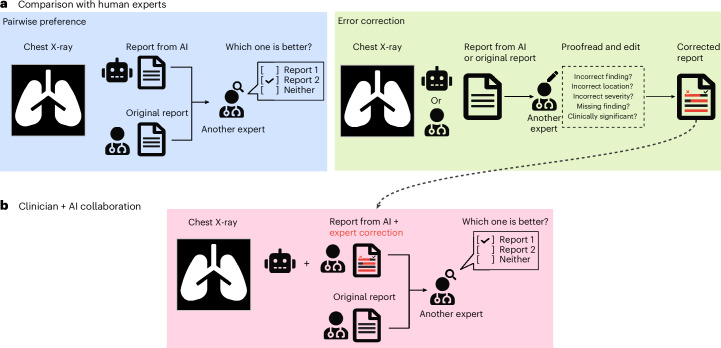
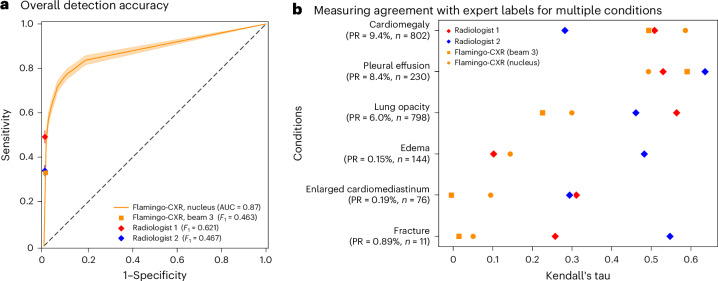
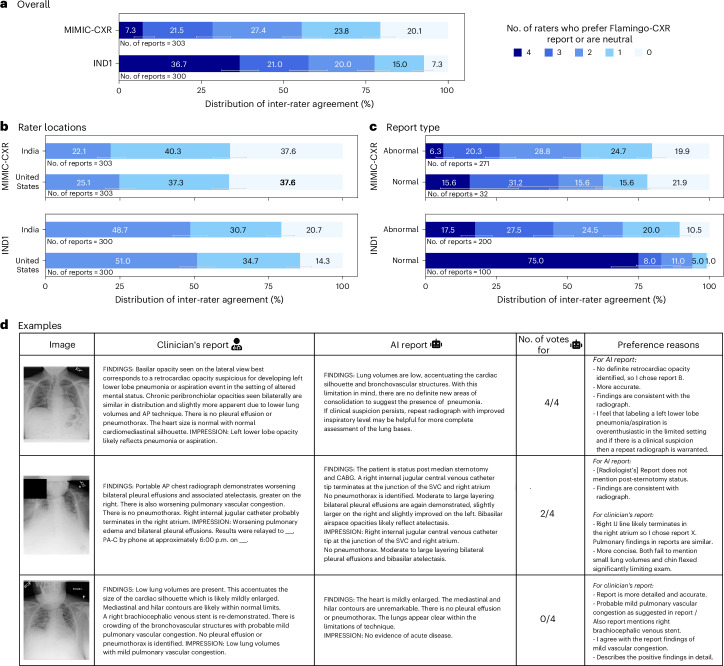
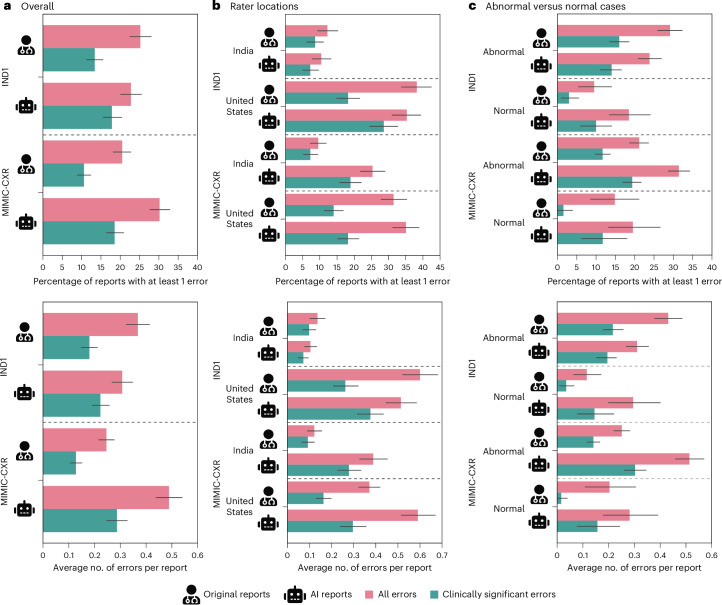
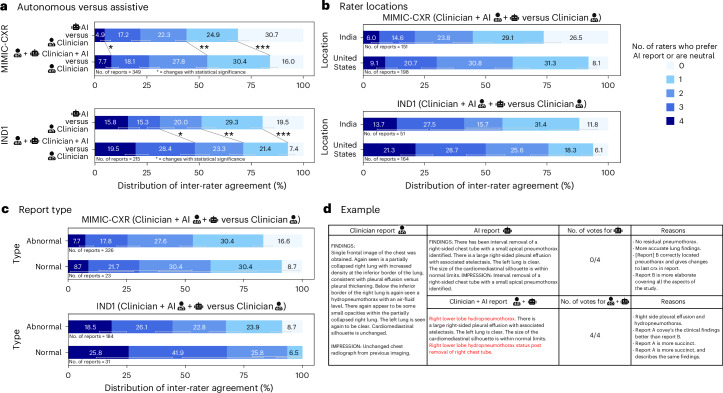
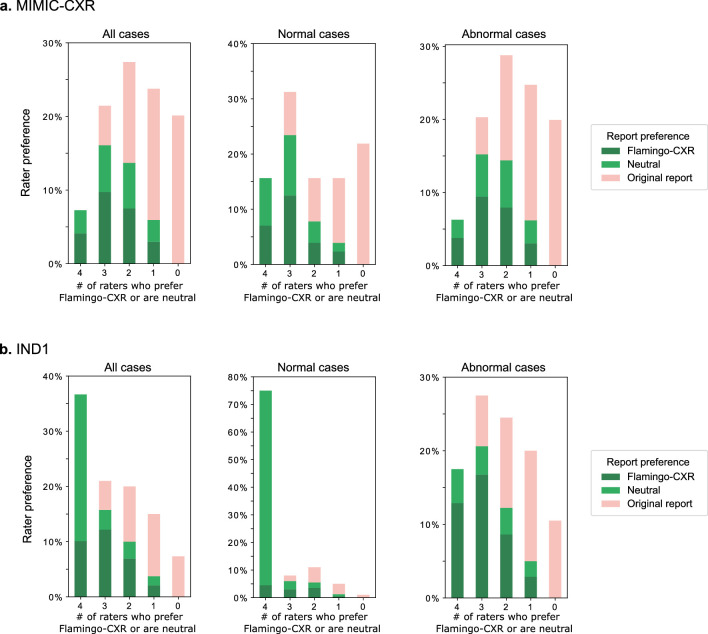
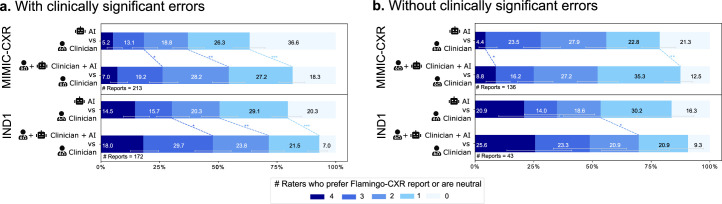
Abstract Radiology reports are an instrumental part of modern medicine, informing key clinical decisions such as diagnosis and treatment. The worldwide shortage of radiologists, however, restricts access to expert care and imposes heavy workloads, contributing to avoidable errors in report delivery. While recent progress in automated report generation with vision-language models offers clear potential to ameliorate this situation, the path toward real-world adoption has been stymied by the challenge of evaluating the clinical quality of AI-generated reports. In this study, we build a state-of-the-art report generation system for chest radiographs, Flamingo-CXR, by fine-tuning a well-known vision-language foundation model on radiology data. To measure the quality of the AI-generated reports, we perform an expert evaluation, that is largest in scale and diversity to date, by engaging a group of 27 certified radiologists in the United States and India to provide detailed assessment of AI-generated and human written reports from an intensive care setting as well as an inpatient setting. We observe a wide distribution of preferences across the panel, ranging from full consensus to dissensus, across clinical settings and regions, with 55.4% of Flamingo-CXR intensive care reports evaluated to be preferable or equivalent to clinician reports, by half or more of the panel, rising to 77.7% for outpatient x-rays overall and to 94% for the subset of cases with no pertinent abnormal findings. For reports that contain errors we develop an assistive setting, the first demonstration of clinician-AI collaboration for radiology report composition, and we observe a synergistic improvement across all clinical settings. Altogether, these nuanced evaluations reveal disparities between the AI system and radiologists, identify areas for potential clinical utility and pave the way toward a collaborative system that enhances clinical accuracy of radiology reporting.
Overview
Integrity signals
Registry
Cites
Statistics
Figures
Verification
Claims the paper makes
Claims other papers make about this one
Each is checked against this paper’s own text: does it say what the citing paper says it does?
In the citing paper
“However, while small language models have shown success in text domains14–16, small multimodal models (SMMs) still have significant performance gaps compared to larger models6,10.”
From A clinically accessible small multimodal radiology model and evaluation metric for chest X-ray findings (2025) · cites this paper as [10]
Citations
Cites
BLEU: a method for automatic evaluation of machine translation
Papineni, K., Roukos, S., Ward, T., & Zhu, W.-J. (2001) · Proceedings of the 40th Annual Meeting on Association for Computational Linguistics - ACL '02 · doi:10.3115/1073083.1073135 · Cited by 21,344
(2004) · Cited by 9,718
2017 IEEE Conference on Computer Vision and Pattern Recognition (CVPR)
(2017) · doi:10.1109/cvpr35066.2017 · Cited by 7,284
Multimodal Machine Learning: A Survey and Taxonomy
Baltrusaitis, T., Ahuja, C., & Morency, L.-P. (2019) · IEEE Transactions on Pattern Analysis and Machine Intelligence · doi:10.1109/tpami.2018.2798607 · Cited by 5,018
CIDEr: Consensus-based image description evaluation
Vedantam, R., Zitnick, C. L., & Parikh, D. (2015) · 2015 IEEE Conference on Computer Vision and Pattern Recognition (CVPR) · doi:10.1109/cvpr.2015.7299087 · Cited by 4,845
A generalization of sampling without replacement from a finite universe
Horvitz, D. G., & Thompson, D. J. (1952) · Journal of the American Statistical Association · doi:10.1080/01621459.1952.10483446 · Cited by 4,293
Large language models encode clinical knowledge
Singhal, K., Azizi, S., Tu, T., Mahdavi, S. S., Wei, J., Chung, H. W., Scales, N., Tanwani, A., Cole-Lewis, H., Pfohl, S., et al. (2023) · Nature · doi:10.1038/s41586-023-06291-2 · Cited by 4,083
Self-citationLarge Language Models Encode Clinical Knowledge
Singhal, K., Azizi, S., Tu, T., Mahdavi, S. S., Wei, J., Chung, H. W., Scales, N., Tanwani, A., Cole-Lewis, H., Pfohl, S., et al. (2022) · arXiv · doi:10.48550/arxiv.2212.13138 · Cited by 4,083
Self-citationMIMIC-CXR, a de-identified publicly available database of chest radiographs with free-text reports
Johnson, A. E. W., Pollard, T. J., Berkowitz, S. J., Greenbaum, N. R., Lungren, M. P., Deng, C.-Y., Mark, R. G., & Horng, S. (2019) · Scientific Data · doi:10.1038/s41597-019-0322-0 · Cited by 1,816
Toward expert-level medical question answering with large language models
Singhal, K., Tu, T., Gottweis, J., Sayres, R., Wulczyn, E., Amin, M., Hou, L., Clark, K., Pfohl, S. R., Cole-Lewis, H., et al. (2025) · Nature Medicine · doi:10.1038/s41591-024-03423-7 · Cited by 1,734
Self-citation
Research works printed but not linked: 5
- Endo, M. et al. Retrieval-based chest X-ray report generation using a pre-trained contrastive language-image model. Proc. Mach. Learn. Res. 158, 209–219 (2021).
- Chen, Z. et al. CheXagent: towards a foundation model for chest X-ray interpretation. In AAAI 2024 Spring Symposium on Clinical Foundation Models (AAAI, 2024).
- Loshchilov, I. & Hutter, F. Fixing weight decay regularization in Adam. Preprint at https://arxiv.org/abs/1711.05101v2 (2018). · arXiv
- Holtzman, A., Buys, J., Du, L., Forbes, M. & Choi, Y. The curious case of neural text degeneration. Preprint at https://arxiv.org/abs/1904.09751 (2019). · arXiv
- Lin, C.-Y. in Text Summarization Branches Out 74–81 (Association for Computational Linguistics, 2004).
Cited by
Sorted by citations
Next-generation agentic AI for transforming healthcare
Karunanayake, N. (2025) · Informatics and Health · doi:10.1016/j.infoh.2025.03.001 · Cited by 165
Multimodal generative AI for medical image interpretation
Rao, V. M., Hla, M., Moor, M., Adithan, S., Kwak, S., Topol, E. J., & Rajpurkar, P. (2025) · Nature · doi:10.1038/s41586-025-08675-y · Cited by 134
A comprehensive survey of large language models and multimodal large language models in medicine
Xiao, H., Zhou, F., Liu, X., Liu, T., Ли, Ж., Liu, X., & Huang, X. (2024) · Information Fusion · doi:10.1016/j.inffus.2024.102888 · Cited by 154
Multimodal Large Language Models in Medical Imaging: Current State and Future Directions
Nam, Y., Kim, D., Kyung, S., Seo, J., Song, J. M., Kwon, J., Kim, J., Jo, W., Park, H. J., Sung, J., et al. (2025) · Korean Journal of Radiology · doi:10.3348/kjr.2025.0599 · Cited by 106
An eyecare foundation model for clinical assistance: a randomized controlled trial
Wu, Y.-L., Qian, B., Li, T., Qin, Y., Guan, Z., Chen, T., Jia, Y., Zhang, P., Zeng, D., Moroi, S. E., et al. (2025) · Nature Medicine · doi:10.1038/s41591-025-03900-7 · Cited by 67
Efficiency and Quality of Generative AI–Assisted Radiograph Reporting
Huang, J., Wittbrodt, M. T., Teague, C. N., Karl, E., Galal, G., Thompson, M., Chapa, A. R., Chiu, M.-L., Herynk, B. A., Linchangco, R., et al. (2025) · JAMA Network Open · doi:10.1001/jamanetworkopen.2025.13921 · Cited by 60
Zambrano Chaves, J. M., Huang, S.-C., Xu, Y., Xu, H., Usuyama, N., Zhang, S., Wang, F., Xie, Y., Khademi, M., Yang, Z., et al. (2025) · Nature Communications · doi:10.1038/s41467-025-58344-x · Cited by 45
“Concurrently, Flamingo-CXR fi ne-tuned the Flamingovisionlanguagemodel 47 andincorporatedregularizationand adaptation techniques to tailor their applications to the nuances of radiology report generation 10 .”
Benchmarking the diagnostic performance of open source LLMs in 1933 Eurorad case reports
Kim, S. H., Schramm, S., Adams, L. C., Braren, R., Bressem, K. K., Keicher, M., Platzek, P., Paprottka, K. J., Zimmer, C., Hedderich, D. M., et al. (2025) · npj Digital Medicine · doi:10.1038/s41746-025-01488-3 · Cited by 44
Mitigating the risk of health inequity exacerbated by large language models
Ji, Y., Ma, W., Sivarajkumar, S., Zhang, H., Sadhu, E. M., Li, Z., Wu, X., Visweswaran, S., & Wang, Y. (2025) · npj Digital Medicine · doi:10.1038/s41746-025-01576-4 · Cited by 62
Empowering Generalist Material Intelligence with Large Language Models
Yuan, W., Chen, G., Wang, Z., & You, F. (2025) · Advanced Materials · doi:10.1002/adma.202502771 · Cited by 42
Evolving and Novel Applications of Artificial Intelligence in Cancer Imaging
Pallumeera, M., Giang, J. C., Singh, R., Pracha, N. S., & Makary, M. S. (2025) · Cancers · doi:10.3390/cancers17091510 · Cited by 43
HealthBench: Evaluating Large Language Models Towards Improved Human Health
Arora, R. K., Wei, J., Hicks, R. S., Bowman, P., Quiñonero-Candela, J., Tsimpourlas, F., Sharman, M., Shah, M., Vallone, A., Beutel, A., et al. (2025) · arXiv · doi:10.48550/arxiv.2505.08775 · Cited by 654
“…generating differential diagnoses (Kanjee et al., 2023; McDuff et al., 2025), assisting with clinical documentation (Williams et al., 2024; Hartman et al., 2024; Baker et al., 2024), mental health treatment (Heinz et al., 2025), and radiology report generation (Tu et al., 2024; Tanno et al., 2025).”
Self-citationChest X-Ray Report Generation Using Abnormality Guided Vision Language Model
Edirisinghe, D., Nimalsiri, W., Hennayake, M., Meedeniya, D., & Lim, G. (2025) · IEEE Access · doi:10.1109/access.2025.3606961 · Cited by 28
Singh, P., & Singh, S. (2025) · Frontiers in Digital Health · doi:10.3389/fdgth.2025.1535168 · Cited by 26
Tavakoli, N., Abad, Z. S. H., Gowda, V., Samsel, K., Bedayat, A., Ghasemiesfe, A., Bağcı, U., Hsiao, A., Leiner, T., Carr, J., et al. (2025) · Radiology · doi:10.1148/radiol.242961 · Cited by 29
Advancements in Radiology Report Generation: A Comprehensive Analysis
Mamdouh, D., Attia, M., Mohamed, O., Mohamed, N., Lotfy, A., Arafa, T., Rashed, E. A., & Khoriba, G. A. (2025) · Bioengineering · doi:10.3390/bioengineering12070693 · Cited by 20
Wihl, J., Rosenkranz, E., Schramm, S., Berberich, C., Griessmair, M., Woźnicki, P., Pinto, F., Ziegelmayer, S., Adams, L. C., Bressem, K. K., et al. (2025) · European Radiology Experimental · doi:10.1186/s41747-025-00600-2 · Cited by 18
Schneider‐Kamp, A., & Godono, A. (2025) · AI & Society · doi:10.1007/s00146-025-02319-5 · Cited by 19
Rethinking radiology reports: A survey of referring physicians’ perspectives
Reschke, P., Booz, C., Gruenewald, L. D., Koch, V., Höhne, E., Gökduman, A., Eichler, K., Schlüchtermann, J., Vogl, T. J., & Gotta, J. (2025) · European Journal of Radiology · doi:10.1016/j.ejrad.2025.112068 · Cited by 14
Benchmarking vision-language models for diagnostics in emergency and critical care settings
Kurz, C., Merzhevich, T., Eskofier, B. M., Kather, J. N., & Gmeiner, B. (2025) · npj Digital Medicine · doi:10.1038/s41746-025-01837-2 · Cited by 16
Application of Artificial Intelligence in Medical Imaging: Current Status and Future Directions
Yang, Y., Ye, L., & Feng, Z. (2025) · iRadiology · doi:10.1002/ird3.70008 · Cited by 15
Understanding the robustness of vision-language models to medical image artefacts
Cheng, Z., Ong, A. Y., Wagner, S. K., Merle, D. A., Ju, L., Zhang, H., Chen, R., Pang, L., Li, B., He, T., et al. (2025) · npj Digital Medicine · doi:10.1038/s41746-025-02108-w · Cited by 18
Dutta, N., Bose, K., Syailendra, E. A., Chu, L. C. H., & Gupta, P. K. (2025) · International Journal of Medical Informatics · doi:10.1016/j.ijmedinf.2025.106227 · Cited by 19
Li, J., Zhou, Z.-C., Wang, Z.-C., & Lv, H. (2026) · Military Medical Research · doi:10.1186/s40779-026-00684-w · Cited by 13
Hallucinations in medical devices
Granstedt, J., Prabhat, K. C., Deshpande, R., Garcia, V. L., & Badano, A. G. (2025) · Artificial Intelligence in the Life Sciences · doi:10.1016/j.ailsci.2025.100145 · Cited by 18
Kuo, S.-M., Tai, S.-K., Lin, H., & Chen, R.-C. (2025) · AI · doi:10.3390/ai6080188 · Cited by 16
Understanding pre-training data effects in retinal foundation models using two large fundus cohorts
Zhou, Y., Wang, Z., Wu, Y., Ong, A. Y., Wagner, S. K., Ruffell, E., Chia, M. A., Guan, Z., Ju, L., Engelmann, J., et al. (2026) · Nature Communications · doi:10.1038/s41467-026-70077-z · Cited by 17
Pawelczyk, J., Kraus, M., Voigtlaender, S., Siebenlist, S., & Rupp, M. (2025) · HSS Journal® The Musculoskeletal Journal of Hospital for Special Surgery · doi:10.1177/15563316251341321 · Cited by 13
Liu, Y., Liu, F., Tu, S., Liu, S., & Han, B. (2025) · Digital Signal Processing · doi:10.1016/j.dsp.2024.104975 · Cited by 9
Self-citationPreliminary evaluation of ChatGPT model iterations in emergency department diagnostics
Wang, J., Shue, K., Liu, L., & Hu, G. (2025) · Scientific Reports · doi:10.1038/s41598-025-95233-1 · Cited by 11
Comparing the accuracy of large language models and prompt engineering in diagnosing realworld cases
Yao, G., Zhang, W. D., Zhu, Y., Wong, U.-K., Zhang, Y., Cui, Y., Shen, G., Li, Z., & Gao, H. Y. (2025) · International Journal of Medical Informatics · doi:10.1016/j.ijmedinf.2025.106026 · Cited by 13
Xiong, Y., Lian, W., Sun, Y., Liu, W., Guo, J., Tang, W., & Liu, C. (2025) · Clinical Oral Investigations · doi:10.1007/s00784-025-06498-9 · Cited by 9
Foundation Models Meet Medical Image Interpretation
Jiao, L., Hao, J., Li, R., Li, L., Liu, X., Liu, F., Ma, W., Chen, P., Huang, Z., Yang, J., et al. (2026) · Research · doi:10.34133/research.1024 · Cited by 12
Al-Jebrni, A. H., Jiang, Z., Qin, Y., Qiu, Y., Jiang, N., Li, G., Zheng, Y., Wong, T. Y., Kim, S., Jung, Y., et al. (2026) · Computational Visual Media · doi:10.26599/cvm.2026.9450530 · Cited by 9
Employing large language models safely and effectively as a practicing neurosurgeon
Patil, A., Serrato, P., Cleaver, G., Limbania, D., See, A. P., & Huang, K. T. (2025) · Acta Neurochirurgica · doi:10.1007/s00701-025-06515-6 · Cited by 8
Self-citationHamamoto, R., Koyama, T., Takahashi, S., Yasuda, T., Kobayashi, K., Akagi, Y., Kouno, N., Sudo, K., Hirata, M., Sunami, K., et al. (2026) · Journal of Hematology & Oncology · doi:10.1186/s13045-026-01781-y · Cited by 8
Zhong, W., Sun, M.-Y., Yao, S., Liu, Y., Peng, D., Liu, Y., Yang, K., Gao, H., Yan, H., Hao, W., et al. (2025) · Journal of Medical Internet Research · doi:10.2196/73233 · Cited by 7
Self-citationC2M-DoT: Cross-modal consistent multi-view medical report generation with domain transfer network
Wang, R., Xu, Z., Wang, X., Liu, W., & Lukasiewicz, T. (2025) · Information Fusion · doi:10.1016/j.inffus.2025.103442 · Cited by 7
Zhong, Z., Wang, Y., Bi, L., Ma, Z., Ahn, S. H., Mullin, C. J., Greineder, C. F., Atalay, M. K., Collins, S., Baird, G. L., et al. (2025) · Medical Image Analysis · doi:10.1016/j.media.2025.103786 · Cited by 8
Jeong, W. G., Hwang, E. J., Jin, G. Y., Lee, J. H., Kang, S. R., Ko, H., Gil, B. M., Kim, J. H., Kim, T. J., Park, C. H., et al. (2025) · Korean Journal of Radiology · doi:10.3348/kjr.2025.0457 · Cited by 8
Chang, L., Li, H., Wu, W., Liu, X., Yan, J., Chen, Z., Wu, H., & Song, S. (2025) · Journal of Translational Medicine · doi:10.1186/s12967-025-07591-z · Cited by 10
Perspective: AI productivity will not benefit employed radiologists
Ruthven, H., & Agten, C. A. (2025) · European Journal of Radiology Artificial Intelligence · doi:10.1016/j.ejrai.2025.100033 · Cited by 7
Causal insights from clinical information in radiology: Enhancing future multimodal AI development
Jantscher, M., Gunzer, F., Reishofer, G., & Kern, R. (2025) · Computer Methods and Programs in Biomedicine · doi:10.1016/j.cmpb.2025.108810 · Cited by 8
He, Z., Wong, A. N. N., & Yoo, J. S. (2025) · Computers in Biology and Medicine · doi:10.1016/j.compbiomed.2025.110625 · Cited by 9
A survey on electronic health record driven multimodal representation learning
Dou, Y., Liu, Y., Zou, H., Zeng, W., Xu, K., & Peng, S. (2025) · Information Fusion · doi:10.1016/j.inffus.2025.103810 · Cited by 7
Self-citationJin, K., Sun, Q., Kang, D., Luo, Z., Yu, T., Han, W., Zhang, Y., Wang, M., Shi, D., & Grzybowski, A. E. (2026) · npj Digital Medicine · doi:10.1038/s41746-025-02300-y · Cited by 6
Jiang, R., Chen, B., Dong, Z., Zeng, X., You, H., Li, Y., Deng, Y., Mu, G., Wang, J., Huang, L., et al. (2026) · npj Digital Medicine · doi:10.1038/s41746-026-02569-7 · Cited by 6
Wang, R., Wang, Z., Xiao, Y., Liu, X., Tan, G., & Liu, J. (2025) · Meta-Radiology · doi:10.1016/j.metrad.2025.100138 · Cited by 6
Guan, H., Hou, P. C., Hong, P., Wang, L., Zhang, W., Du, X., Zhou, Z., & Zhou, L. (2025) · medRxiv · doi:10.1101/2025.07.13.25331222 · Cited by 6
Neuwieser, H., Jami, N. V. S. J., Meier, R. J., Liebsch, G., Felthaus, O., Klein, S., Schreml, S., Berneburg, M., Prantl, L., Leutheuser, H., et al. (2025) · Diagnostics · doi:10.3390/diagnostics15172184 · Cited by 6
Zanardo, M., Albano, D., Molinari, V., Fabrizio, R., Conca, M., Asmundo, L., Pardo, F., Traina, F., Montechiari, M., Gitto, S., et al. (2026) · European Radiology Experimental · doi:10.1186/s41747-026-00682-6 · Cited by 6
A deep learning vision–language model for diagnosing pediatric dental diseases
Pham, T. D. (2026) · Intelligence-Based Medicine · doi:10.1016/j.ibmed.2026.100364 · Cited by 5
Gertz, R. J., Beste, N. C., Dratsch, T., Lennartz, S., Bremm, J., Iuga, A.-I., Bunck, A. C., Laukamp, K. R., Schönfeld, M. H., & Kottlors, J. (2025) · European Radiology · doi:10.1007/s00330-025-11929-y · Cited by 5
Performance of o1 pro and GPT-4 in Self-Assessment Questions for Nephrology Board Renewal
Noda, R., Yuasa, C., Kitano, F., Ichikawa, D., & Shibagaki, Y. (2025) · Frontiers in Medicine · doi:10.3389/fmed.2025.1702668 · Cited by 5
Prompt injection attacks on vision-language models for surgical decision support
Zhang, Z., Qadir, M. I., Carstens, M., Zhang, E. H., Loiselle, M. S., Martinus, F. M., Mroczkowski, M. K., Clusmann, J., Kather, J. N., & Kolbinger, F. R. (2026) · npj Digital Surgery · doi:10.1038/s44484-026-00014-6 · Cited by 4
Ren, G., Hou, M., Yang, X., Huang, Y., Li, D., Zhang, N., Liu, P., Ye, H., Chen, Z., & Chen, H. (2025) · npj Digital Medicine · doi:10.1038/s41746-025-02044-9 · Cited by 4
Chen, C.-H., Chen, C.-W., Hsieh, K.-Y., Huang, K.-E., & Lai, H.-Y. (2026) · Diagnostics · doi:10.3390/diagnostics16030376 · Cited by 5
Clinical AI in Radiology: Foundations, Trends, Applications, and Emerging Directions
Hartsock, I., Koutsoubis, N., Ahmed, S., Parker, N. H., Schabath, M. B., Araujo, C. R., Qayyum, A., Lam, C. A., Gatenby, R. A., & Rasool, G. (2026) · Cancers · doi:10.3390/cancers18060942 · Cited by 5
Progress in the application of machine learning in CT diagnosis of acute appendicitis
Li, J., Ye, J., Luo, Y., Xu, T., & Jia, Z. (2025) · Abdominal Radiology · doi:10.1007/s00261-025-04864-5 · Cited by 5
Lingshu: A Generalist Foundation Model for Unified Multimodal Medical Understanding and Reasoning
Xu, W., Chan, H. P., Li, L., Aljunied, M., Yuan, R., Wang, J., Xiao, C., Chen, G., Liu, C., Li, Z., et al. (2025) · arXiv · doi:10.48550/arxiv.2506.07044 · Cited by 4
From task-specific to foundation models: A paradigm shift in medical vision-language analysis
Ali, M. U., Zafar, A., Kim, S., Kim, K. S., & Lee, S. W. (2025) · Computer Science Review · doi:10.1016/j.cosrev.2025.100831 · Cited by 6
Li, Z., Gao, Y., Ji, K., Zhang, K.-Y., Zhang, Q., Wang, J., Han, L., Zhai, X.-Y., Wang, W., Liu, W.-L., et al. (2025) · European Radiology · doi:10.1007/s00330-025-12065-3 · Cited by 3
Vaishya, R., Gupta, B. M., Chaman Sab, M., Guechairi, S., Vaish, A., & Botchu, R. (2025) · Journal of Clinical Imaging Science · doi:10.25259/jcis_245_2025 · Cited by 3
Automatic medical report generation: a comprehensive review of methodologies and applications
Yan, T., He, H. W., Chan, I. N., Qin, Y. Y., Li, Z., & Wong, P. K. (2026) · PeerJ Computer Science · doi:10.7717/peerj-cs.3474 · Cited by 3
Song, X., Li, Y., Ouyang, H. J., Yao, M., Zhao, F., Yu, K., Tian, S., Xing, X., Zhou, Y., Zhang, E., et al. (2026) · Nature Communications · doi:10.1038/s41467-026-69023-w · Cited by 3
Sarwal, R. D., Tarca, V., Dubin, C. A., Kalavros, N., Bhatti, G., Bhattacharya, S., Butte, A. J., Romero, R., Stolovitzky, G. A., Oskotsky, T., et al. (2026) · Cell Reports Medicine · doi:10.1016/j.xcrm.2026.102594 · Cited by 3
Learning with less supervision: A survey of label-efficient learning for medical image analysis
Jin, C., Guo, Z., Lin, Y., Luo, L., & Chen, H. (2026) · Medical Image Analysis · doi:10.1016/j.media.2026.104062 · Cited by 49
Park, Y. W., Kang, M., Ryu, H., Han, K., Sim, Y., Park, J. E., Chang, J. H., Kim, S. H., Lee, S.-K., Park, S. H., et al. (2026) · npj Digital Medicine · doi:10.1038/s41746-026-02581-x · Cited by 3
Farahani, S., Ieva, A. D., Coiera, E. W., & Liu, S. (2026) · European Journal of Radiology Artificial Intelligence · doi:10.1016/j.ejrai.2026.100092 · Cited by 3
Tracing the Pen: Electronic Health Records Amid the Rise of Generative AI
Nargesi, A. A., You, J. G.-T., Bitterman, D. S., Succi, M. D., Mishuris, R. G., Poon, E. G., & Landman, A. (2026) · npj Digital Medicine · doi:10.1038/s41746-026-02508-6 · Cited by 3
DxDirector: an agentic large language model driving the full-process clinical diagnosis
Xu, S., Huang, X., Wei, Z., Pang, L., Shen, H., & Cheng, X. (2026) · Nature Communications · doi:10.1038/s41467-026-71928-5 · Cited by 7
Multi-Modality and Multi-Grained Transformer for Accurate Radiology Report Generation
Li, H., Zhang, L., Zhong, X., Zhang, J., Feng, S., & Li, S. (2025) · Lecture notes in computer science · doi:10.1007/978-981-95-0033-8_8 · Cited by 3
Mensah, P. B., Quao, N. S. A., & Dagadu, S. (2024) · medRxiv · doi:10.1101/2024.04.17.24305971 · Cited by 4
Artificial Intelligence in Healthcare: 2025 Year in ReviewPreprint
Edara, S. R., Khare, A., Atreja, A., Awasthi, R., Highum, B., Hakimzadeh, N., Ramachandran, S. P., Mishra, S., Mahapatra, D., Shree, S., et al. (2026) · medRxiv · doi:10.64898/2026.02.23.26346888 · Cited by 3
Zając, H. D., & Ternov, N. K. (2025) · CHI Conference Extended Abstracts on Human Factors in Computing Systems (CHI EA) · doi:10.1145/3706599.3719979 · Cited by 2
Kim, C., Cho, S., & Yoon, J. H. (2025) · Healthcare Informatics Research · doi:10.4258/hir.2025.31.4.416 · Cited by 2
Uppuluri, P. C., & Yang, C. W. (2025) · Academic Radiology · doi:10.1016/j.acra.2025.10.063 · Cited by 4
Generative AI and Scientific Authorship
Hsieh, S.-C., Lee, K.-H., Karmakar, R., Kandalkar, A., Mukundan, A., & Wang, H. (2025) · International Journal of Software Science and Computational Intelligence · doi:10.4018/ijssci.394323 · Cited by 2
Recent Progress in Deep Learning for Chest X-Ray Report Generation
Salhi, M., & Akhloufi, M. A. (2026) · BioMedInformatics · doi:10.3390/biomedinformatics6010003 · Cited by 3
Text-image alignment for ILD imaging: linking CXR evidence to CT quantification
Gao, J., Ren, Y., Yang, F., Hu, X., Changbo, S. U. N., Wang, S., & Chen, C. (2026) · npj Digital Medicine · doi:10.1038/s41746-025-02292-9 · Cited by 2
Medical multimodal large language models: A survey
Xiao, H., Hui, N., Xu, Y., Li, Z., & Peng, J. (2026) · Information Fusion · doi:10.1016/j.inffus.2026.104386 · Cited by 2
Overview of State-of-the-Art Learning-Based Classification Methods in Medical Imaging
Nia, N. G., Manwar, R., & Avanaki, K. (2026) · Annals of Biomedical Engineering · doi:10.1007/s10439-026-04241-3 · Cited by 2
Generative Artificial Intelligence and Large Language Models in Clinical Oncology
Yu, Y., Zhao, Z., Wang, Z., Lin, R., Tan, Y., Chen, Y., Li, T., Baptista‐Hon, D. T., Zhang, X., Wu, C., et al. (2026) · MedComm · doi:10.1002/mco2.70833 · Cited by 2
A Unified Platform for Radiology Report Generation and Clinician-Centered AI EvaluationPreprint
Ma, Z., Yang, X., Atalay, Z., Yang, A. E., Collins, S., Bai, H. X., Bernstein, M. H., Baird, G. L., & Jiao, Z. (2025) · medRxiv · doi:10.1101/2025.07.07.25331018 · Cited by 2
Sun, X., Hong, Q., Zhang, M., Li, Y., Chen, T., Huang, Z., Liang, G., Tang, W., Xu, S., Ni, X., et al. (2026) · Cell Reports Medicine · doi:10.1016/j.xcrm.2025.102547 · Cited by 3
“Future research should establish robust human-AI collaboration frameworks 35,36 to validate MCC’s performance in real clinical settings.”
Allaberdiev, S., Chen, X., Mamatov, D., Abdusalomov, A., Ubaydullaev, U., & Khan, A. (2026) · IET Software · doi:10.1049/sfw2/5529107 · Cited by 2
Hood, D. C., Lau, W. T., Stowman, A. L., Gebhardt, T., Mao, G., Bruna, S. L., Leshno, A., Tsamis, E., & Thakoor, K. A. (2025) · Translational Vision Science & Technology · doi:10.1167/tvst.14.10.23 · Cited by 2
Arteaga-Arteaga, H. B., Giraldo-Arias, J. A., Bravo-Ortíz, M. A., Landín, C. J., Guillen-Rondon, P., & Tabares-Soto, R. (2025) · Expert Systems with Applications · doi:10.1016/j.eswa.2025.130196 · Cited by 1
CHEF-VL: Detecting Cognitive Sequencing Errors in Cooking with Vision-language Models
Wang, R., Gao, P., Lynch, P., Liu, T., Lee, Y., Baum, C. M., Connor, L. T., & Lu, C. (2025) · Proceedings of the ACM on Interactive Mobile Wearable and Ubiquitous Technologies · doi:10.1145/3770714 · Cited by 3
Haghighi, T., Gholami, S., Sokol, J. T., Biswas, A., Lim, J. I., Leng, T., Thompson, A. C., Tabkhi, H., & Alam, M. N. (2025) · Communications Medicine · doi:10.1038/s43856-025-01293-9 · Cited by 1
Jeong, W. G., Hwang, E. J., & Jin, G. Y. (2026) · Korean Journal of Radiology · doi:10.3348/kjr.2025.1918 · Cited by 1
FiR-Rad: Fine-Grained Reinforcement With Structured Reasoning for Chest X-Ray Report Generation
Mei, X., Yang, L., Gao, D., Cai, X., Han, J., & Liu, T. (2026) · IEEE Transactions on Medical Imaging · doi:10.1109/tmi.2026.3665561 · Cited by 2
Artificial Intelligence in Point-of-Care Ultrasound
Wu, D., Arntfield, R. T., & Millington, S. J. (2026) · Journal of Intensive Care Medicine · doi:10.1177/08850666261427329 · Cited by 1
Clinical usability of generative artificial intelligence for MR safety advice
Rose, H., Thorpe, J. C., Panek, R., Goncalves, E., & Morgan, P. S. (2026) · European Journal of Radiology Artificial Intelligence · doi:10.1016/j.ejrai.2026.100083 · Cited by 1
Med-ViX-Ray: Enhancing explainable chest X-ray analysis with clinical knowledge graphs
Cieri, M., & Palomba, F. (2026) · Computer Methods and Programs in Biomedicine · doi:10.1016/j.cmpb.2026.109313 · Cited by 1
Hao, P., Zhang, J., Zhang, S., Wu, F., & Tian, S. (2026) · Scientific Reports · doi:10.1038/s41598-026-41439-w · Cited by 1
Meta-Entity Driven Triplet Mining for Aligning Medical Vision-Language Models
Yilmaz, M., Öztürk, Ş., Kara, M., Yavuz, M. T., Gümeler, E., Koç, A., & Çukur, T. (2026) · IEEE Journal of Biomedical and Health Informatics · doi:10.1109/jbhi.2026.3678306 · Cited by 2
Barzegar, M., Rostami, H., Sanati, A., Afshoon, R., Kosari, A., & Keshavarz, A. (2026) · Biomedical Signal Processing and Control · doi:10.1016/j.bspc.2026.110173 · Cited by 2
Prajapati, V., Kolhar, S., & Barbole, D. K. (2026) · Informatics in Medicine Unlocked · doi:10.1016/j.imu.2026.101777 · Cited by 1
Zhu, Q., Lin, Y., Fu, W., Tang, W. H., Li, J., Zhang, Y., Li, B., Guo, X., Wang, F. S., Qi, H., et al. (2026) · Nature Biomedical Engineering · doi:10.1038/s41551-026-01713-8 · Cited by 2
Metadata
- Authors
- Tanno, R., Barrett, D. G. T., Sellergren, A., Ghaisas, S., Dathathri, S., See, A., Welbl, J., Lau, C., Tu, T., Azizi, S., Singhal, K., Schaekermann, M., May, R., Lee, R., Man, S., Mahdavi, S., Ahmed, Z., Matias, Y., Barral, J., Eslami, S. M. A., Belgrave, D., Liu, Y., Kalidindi, S. R., Shetty, S., Natarajan, V., Kohli, P., Huang, P.-S., Karthikesalingam, A., & Ktena, I.
- Affiliations
- Google DeepMind (United Kingdom) (GB)
- Google (United Kingdom) (GB)
- GlaxoSmithKline (United Kingdom) (GB)
- Apollo Hospitals (IN)
- Corresponding author
- Tanno, Ryutaro
- Barrett, David G. T.
- Karthikesalingam, Alan
- ORCID
- Tanno, Ryutaro
- Barrett, David G. T.
- Sellergren, Andrew
- Ghaisas, Sumedh
- Dathathri, Sumanth
- See, Abigail
- Lau, Charles
- Tu, Tao
- Azizi, Shekoofeh
- Singhal, Karan
- Schaekermann, Mike
- Lee, Roy
- Man, SiWai
- Mahdavi, Sara
- Matias, Yossi
- Barral, Joelle
- Eslami, S. M. Ali
- Liu, Yun
- Kalidindi, Sreenivasa Raju
- Shetty, Shravya
- Natarajan, Vivek
- Kohli, Pushmeet
- Huang, Po-Sen
- Karthikesalingam, Alan
- Ktena, Ira
- Venue
- Nature Medicine
- Published
- 2024-11-07
- Volume
- 31
- Issue
- 2
- Pages
- 599-608
- ISSN
- 1078-8956 (ISSN-L)
- 1546-170X
- PMC
- PMC11835717
- OpenAlex
- W4404143589
- Cited by
- 186
- References
- 54
- Citations by year
- 2026: 106 · 2025: 77 · 2024: 2
- FWCI
- 17.30
- Type
- journal article
- Language
- en
- Open access
- hybrid
- doi.org
- Licence
- Locations
- Nature Medicine (publishedVersion, cc-by)
- Research Square (acceptedVersion, cc-by)
- PubMed Central (publishedVersion, cc-by-nc-nd)
- PubMed (publishedVersion)
- Funders
- DeepMind
- Topics
- Health Sciences › Medicine › Health Informatics › Artificial Intelligence in Healthcare and Education
- Physical Sciences › Computer Science › Computer Vision and Pattern Recognition › Multimodal Machine Learning Applications
- Health Sciences › Medicine › Radiology, Nuclear Medicine and Imaging › Radiology practices and education
- Keywords
- automated radiology report generation, vision-language models, chest radiograph, clinician-AI collaboration, radiologist workload
- MeSH terms
- Radiologists, Artificial Intelligence, Humans, Radiology, Radiography, Thoracic
About these checks
Registry, retraction, Cites and statistics results are computed, not judged, with one exception: a printed reference that no index lists is read once by a model before it counts as a citation error. Claims are extracted by a model and kept only when their quote appears verbatim in the text; each cited source is then checked, with a model’s help, for whether it says what the claim relies on. Those verdicts can be wrong — read the claim’s quote and the cited source before relying on one.
Statistics and arithmetic are recomputed, not judged.
Confidence bands are shown only for fields calibrated on our annotated test set. None is calibrated yet, so no band is shown.
What counts as a claim ›How we measure confidence ›How we check this ›
Are you an author, or do you see a problem with this page? Request a review
