Cited by 110Memory and Neural MechanismsSingle-cell and spatial transcriptomicsNeuroscience and Neuropharmacology Research

The DOI matches its Crossref record; 78 of the 78 references it cites were found in a registry or an index.

Neuronal types in the mouse amygdala and their transcriptional response to fear conditioning

Open access

Abstract

The amygdala is a brain region primarily associated with emotional response. The use of genetic markers and single-cell transcriptomics can provide insights into behavior-associated cell state changes. Here we present a detailed cell-type taxonomy of the adult mouse amygdala during fear learning and memory consolidation. We perform single-cell RNA sequencing on naïve and fear-conditioned mice, identify 130 neuronal cell types and validate their spatial distributions. A subset of all neuronal types is transcriptionally responsive to fear learning and memory retrieval. The activated engram cells upregulate activity-response genes and coordinate the expression of genes associated with neurite outgrowth, synaptic signaling, plasticity and development. We identify known and previously undescribed candidate genes responsive to fear learning. Our molecular atlas may be used to generate hypotheses to unveil the neuron types and neural circuits regulating the emotional component of learning and memory.

Overview

The claims and statistics of this paper haven’t been checked yet.

Run the check — free, no account needed. It reads the open-access text and checks the sources it cites.

A few free checks a day · papers already verified open instantly · results are public

Integrity signals

Registry

Crossref · 10.1038/s41593-023-01469-3

Cites

78 of 78 references verified0 citation errors · 0 not checkable

Statistics

Figures

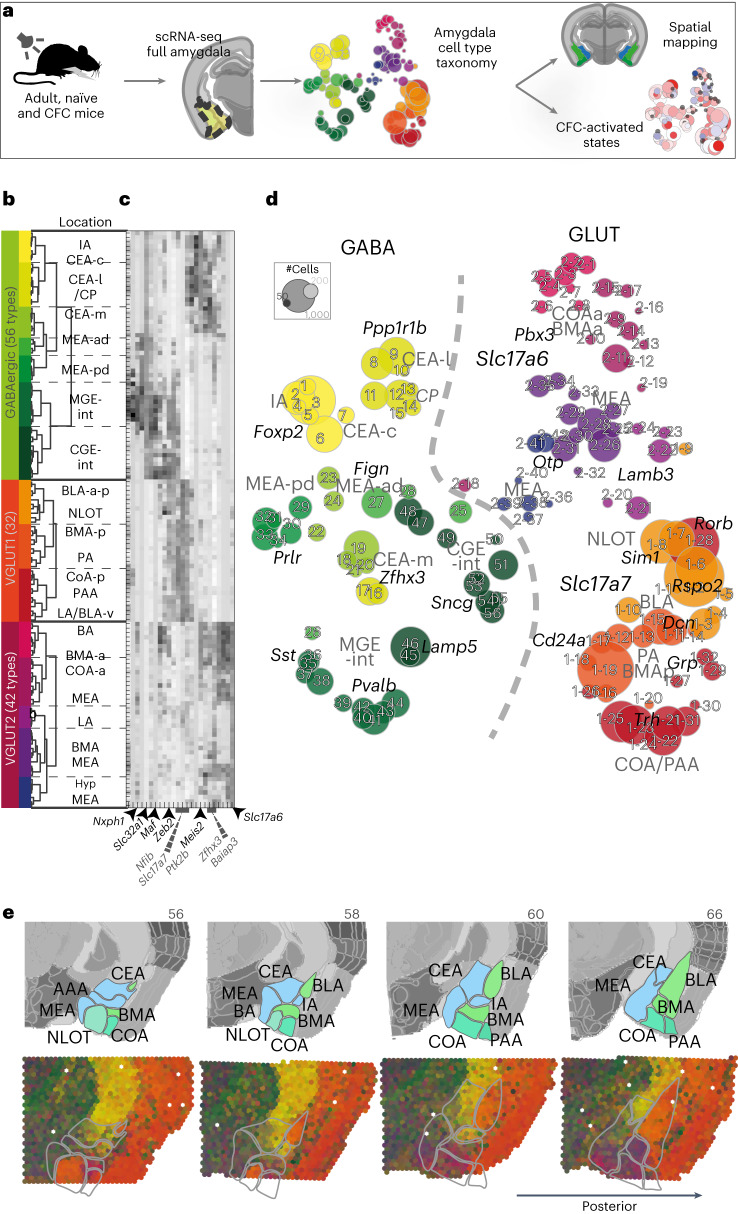
Fig. 1 Amygdala neuron taxonomy. a, Experiment overview—scRNA-seq of the whole amygdala of 23 mice constructed the cell-type taxonomy that was then spatially mapped to distinct amygdala nuclei and analyzed for CFC response. b, Data structure—of 55,514 whole-cell transcriptomes, 30,184 were neurons. Neuronal cell types by dendrogram order per neurotransmitter type (GABAergic (13,006 cells and 56 clusters) or glutamatergic (17,178 cells)), with amygdala location on the right. Glutamatergic cells expressed either vesicle transporter Slc17a6 (VGLUT2, 5,231 cells and 42 clusters) or Slc17a7 (VGLUT1, 11,947 cells and 32 clusters), colored by a branch of highly correlated cell types. c, Heatmap of genes that were differentially expressed between branches of the dendrogram. d, t-SNE visualization of all 130 neuronal types by cluster average, colored by branch; circle area corresponds to cluster size. e, Spatial distribution of neuronal types in the amygdala, shown as weighted cell-type correlation with four anterior–posterior coronal sections ST (Visium), colored by branch. Top: corresponding reference sections, adjusted from Allen Reference Atlas—Mouse Brain (atlas.brain-map.org), with amygdala regions and section numbers (top) annotated. Source data
Fig. 1 Amygdala neuron taxonomy. a, Experiment overview—scRNA-seq of the whole amygdala of 23 mice constructed the cell-type taxonomy that was then spatially mapped to distinct amygdala nuclei and analyzed for CFC response. b, Data structure—of 55,514 whole-cell transcriptomes, 30,184 were neurons. Neuronal cell types by dendrogram order per neurotransmitter type (GABAergic (13,006 cells and 56 clusters) or glutamatergic (17,178 cells)), with amygdala location on the right. Glutamatergic cells expressed either vesicle transporter Slc17a6 (VGLUT2, 5,231 cells and 42 clusters) or Slc17a7 (VGLUT1, 11,947 cells and 32 clusters), colored by a branch of highly correlated cell types. c, Heatmap of genes that were differentially expressed between branches of the dendrogram. d, t-SNE visualization of all 130 neuronal types by cluster average, colored by branch; circle area corresponds to cluster size. e, Spatial distribution of neuronal types in the amygdala, shown as weighted cell-type correlation with four anterior–posterior coronal sections ST (Visium), colored by branch. Top: corresponding reference sections, adjusted from Allen Reference Atlas—Mouse Brain (atlas.brain-map.org), with amygdala regions and section numbers (top) annotated. Source dataCC BY · PubMed Central
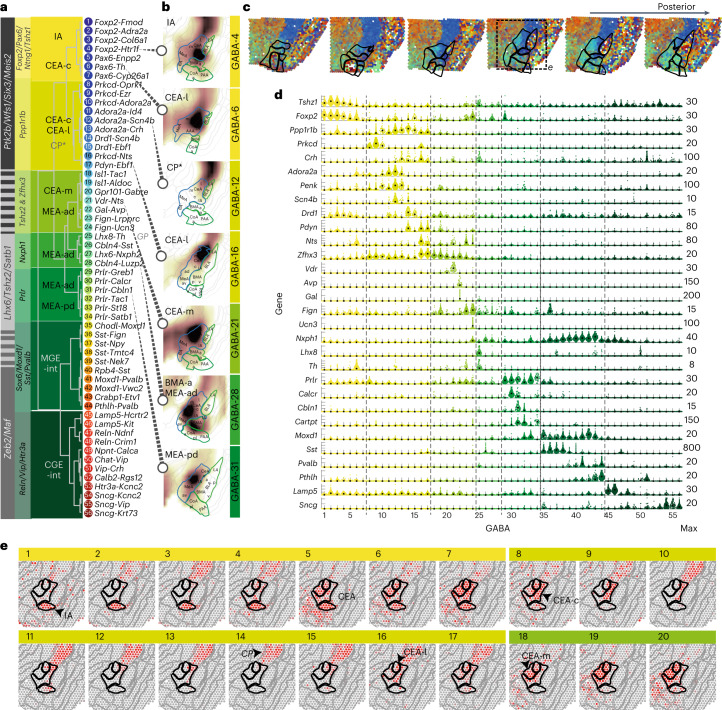
Fig. 2 GABAergic cell types of the mouse amygdala. a, Dendrogram of GABAergic cell types, with cell-type number and two-gene identifier. Differentially expressed genes defining branching points across the dendrogram (gray), and the specific branches (yellow–green) are highlighted on the left. Likely location, indicated on top of dendrogram (based on AMBA spatial correlation). b, Examples of inferred spatial distributions of seven distinct cell types, visualized in a single relevant section with high correlation to AMBA. c, Weighted spatial correlation of GABA types to six coronal sections Visium ST. Each dot represents one capture spot, colored by the dominant cell type (see a, right). d, Genes enriched to single or groups of clusters, visualized as single-cell violin plots. Each dot represents one cell; black square represents the median cluster expression and the number of molecules (y scale maximum) is on the right. e, GABA cell types 1–20 distributions visualized as correlation heatmap to Visium ST (indicated in c). Gray, low and red, high. c, capsular; l, lateral; m, medial; ad, anterodorsal; pd, posterodorsal; int, interneurons.
Fig. 2 GABAergic cell types of the mouse amygdala. a, Dendrogram of GABAergic cell types, with cell-type number and two-gene identifier. Differentially expressed genes defining branching points across the dendrogram (gray), and the specific branches (yellow–green) are highlighted on the left. Likely location, indicated on top of dendrogram (based on AMBA spatial correlation). b, Examples of inferred spatial distributions of seven distinct cell types, visualized in a single relevant section with high correlation to AMBA. c, Weighted spatial correlation of GABA types to six coronal sections Visium ST. Each dot represents one capture spot, colored by the dominant cell type (see a, right). d, Genes enriched to single or groups of clusters, visualized as single-cell violin plots. Each dot represents one cell; black square represents the median cluster expression and the number of molecules (y scale maximum) is on the right. e, GABA cell types 1–20 distributions visualized as correlation heatmap to Visium ST (indicated in c). Gray, low and red, high. c, capsular; l, lateral; m, medial; ad, anterodorsal; pd, posterodorsal; int, interneurons.CC BY · PubMed Central
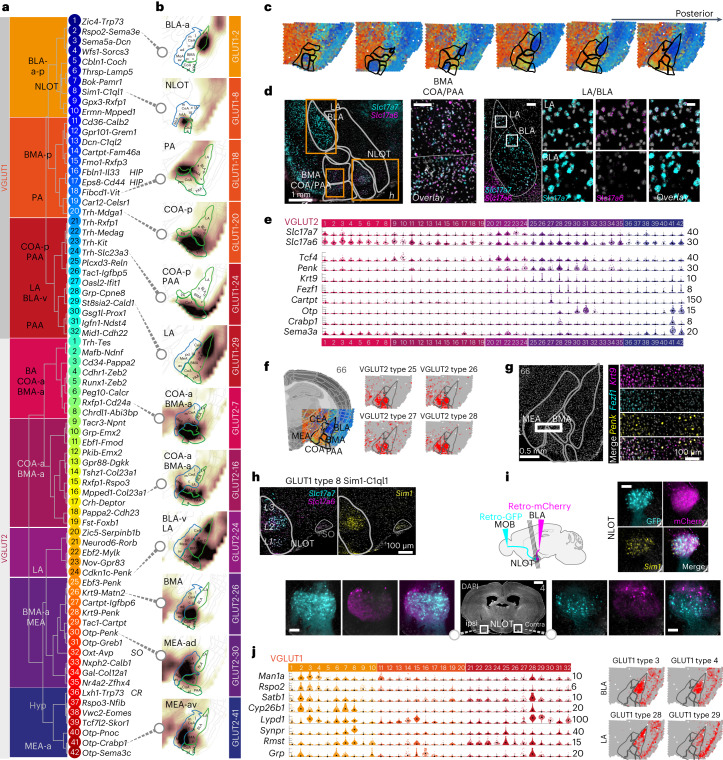
Fig. 3 Glutamatergic diversity. a, Dendrogram of glutamatergic cell types of the VGLUT1 and VGLUT2 classes, with cluster number and two-gene identifier; likely location indicated on the left. b, Examples of inferred spatial distributions of 12 distinct cell types in a relevant coronal section with high correlation to AMBA. Correlation coefficients visualized as a heatmap (white, low and brown, high correlation). c, Weighted spatial correlation of GABA types to six coronal sections Visium ST. Each dot represents one capture spot, colored by the dominant cell type (see a, right). d, Multiplexed fluorescent in situ hybridization of Slc17a7 (VGLUT1) and Slc17a6 (VGLUT2) highlighted in LA, BLA (scale bar, 20 μm) and anterior COA/BMA (scale bar, 100 μm) in a single representative anterior section. Top panel section overview: scalebars, 500 μm; LA/BLA overview: scale bar, 100 μm. e, VGLUT2 MEA/BMA gene expression visualized as single-cell violin plots. Each dot represents one cell; black square represents median cluster expression and the number of molecules (y scale maximum) is on the right. f, Examples of related BMA/MEA populations visualized as correlation heatmap to Visium ST (gray, low and red, high). g, Multiplex fluorescence in situ hybridization for Krt9+ MEA/BMA populations, some Penk+ and coexpressing Fezf1 in the MEA only. h, Multiplex FISH validation of Slc17a7+Slc17a6+Sim1+ cells in the NLOT (overview section in c); Scale bar, 100 μm. i, NLOT-projection tracing using retro-AAVs to the MOB (hSyn1-EGFP) and BLA (hSyn1-mCherry) reveals NLOT cell labeling ipsi- and contralateral to the injection sites, of Sim1+ cells (multiplex FISH). Scale bars, overview, 1 mm; zoom-ins, 100 mm. j, Left, BLA/LA cell types gene expression; right, examples of spatial distributions. Gene expression visualized as single-cell violin plots, each dot represents one cell; black square represents median expression and number of molecules (y-scale maximum) are on the right. BLA/LA populations distribution visualized as correlation heatmap to Visium ST (gray, low and red, high). SO, supraoptic nucleus.
Fig. 3 Glutamatergic diversity. a, Dendrogram of glutamatergic cell types of the VGLUT1 and VGLUT2 classes, with cluster number and two-gene identifier; likely location indicated on the left. b, Examples of inferred spatial distributions of 12 distinct cell types in a relevant coronal section with high correlation to AMBA. Correlation coefficients visualized as a heatmap (white, low and brown, high correlation). c, Weighted spatial correlation of GABA types to six coronal sections Visium ST. Each dot represents one capture spot, colored by the dominant cell type (see a, right). d, Multiplexed fluorescent in situ hybridization of Slc17a7 (VGLUT1) and Slc17a6 (VGLUT2) highlighted in LA, BLA (scale bar, 20 μm) and anterior COA/BMA (scale bar, 100 μm) in a single representative anterior section. Top panel section overview: scalebars, 500 μm; LA/BLA overview: scale bar, 100 μm. e, VGLUT2 MEA/BMA gene expression visualized as single-cell violin plots. Each dot represents one cell; black square represents median cluster expression and the number of molecules (y scale maximum) is on the right. f, Examples of related BMA/MEA populations visualized as correlation heatmap to Visium ST (gray, low and red, high). g, Multiplex fluorescence in situ hybridization for Krt9+ MEA/BMA populations, some Penk+ and coexpressing Fezf1 in the MEA only. h, Multiplex FISH validation of Slc17a7+Slc17a6+Sim1+ cells in the NLOT (overview section in c); Scale bar, 100 μm. i, NLOT-projection tracing using retro-AAVs to the MOB (hSyn1-EGFP) and BLA (hSyn1-mCherry) reveals NLOT cell labeling ipsi- and contralateral to the injection sites, of Sim1+ cells (multiplex FISH). Scale bars, overview, 1 mm; zoom-ins, 100 mm. j, Left, BLA/LA cell types gene expression; right, examples of spatial distributions. Gene expression visualized as single-cell violin plots, each dot represents one cell; black square represents median expression and number of molecules (y-scale maximum) are on the right. BLA/LA populations distribution visualized as correlation heatmap to Visium ST (gray, low and red, high). SO, supraoptic nucleus.CC BY · PubMed Central
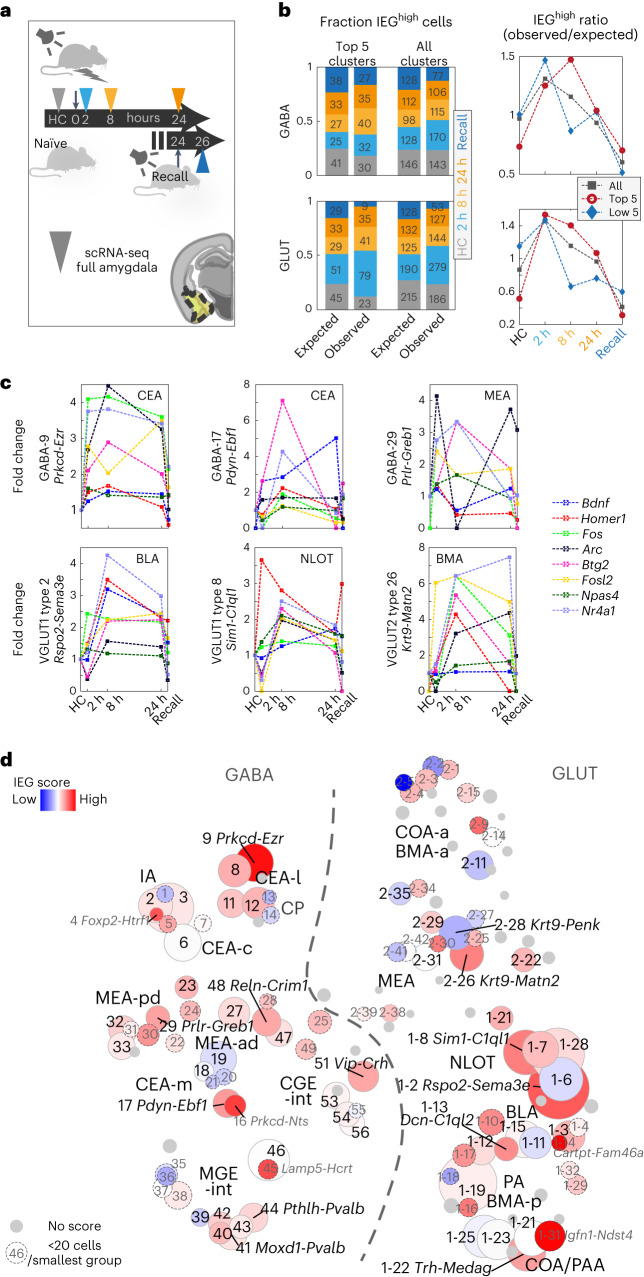
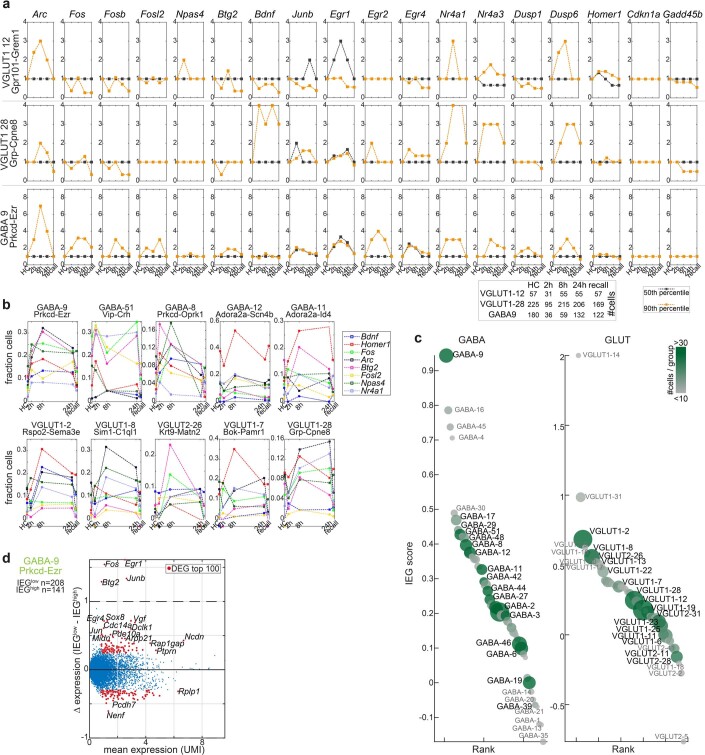
Fig. 4 Time-resolved activity-regulated gene expression in cued fear conditioning. a, Tone-cued fear conditioning and scRNA-seq sampling timepoints after 2 h, 8 h, 24 h and 2 h after next-day conditioned stimulus (CS) recall (no shock). HC, naïve HC control. b, Per timepoint, fraction and cell number (left) of cells highly expressing IEGs Arc, Bdnf, Btg2, Fos, Fosl2, Homer1, Npas4 or Nr4a1 (IEGhigh, 99th percentile); observed versus the fraction and number expected by chance, shown for the five top-responding and all clusters. Right, resultant ratio (observed/expected), per timepoint. c, Time-dynamic expression (fold change) of the eight IEGs, 90th percentile, for the five top IEG-scoring clusters among GABA (top) and GLUT (bottom) types. d, Cluster-wise IEG score (Methods), visualized as heatmap on t-SNE (as in Fig. 1d). Blue, low; red, high and gray, cluster too small (<60 cells). Gray label/dashed circle, smallest group size <20 cells. Circle size represents cluster size. Source data
Fig. 4 Time-resolved activity-regulated gene expression in cued fear conditioning. a, Tone-cued fear conditioning and scRNA-seq sampling timepoints after 2 h, 8 h, 24 h and 2 h after next-day conditioned stimulus (CS) recall (no shock). HC, naïve HC control. b, Per timepoint, fraction and cell number (left) of cells highly expressing IEGs Arc, Bdnf, Btg2, Fos, Fosl2, Homer1, Npas4 or Nr4a1 (IEGhigh, 99th percentile); observed versus the fraction and number expected by chance, shown for the five top-responding and all clusters. Right, resultant ratio (observed/expected), per timepoint. c, Time-dynamic expression (fold change) of the eight IEGs, 90th percentile, for the five top IEG-scoring clusters among GABA (top) and GLUT (bottom) types. d, Cluster-wise IEG score (Methods), visualized as heatmap on t-SNE (as in Fig. 1d). Blue, low; red, high and gray, cluster too small (<60 cells). Gray label/dashed circle, smallest group size <20 cells. Circle size represents cluster size. Source dataCC BY · PubMed Central
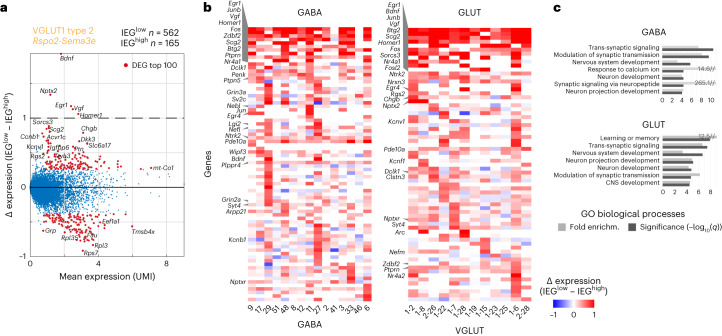
Fig. 5 Gene expression in IEGhigh engram cells. a, Scatterplot of differentially expressed genes between activated (IEGhigh, 95th percentile) and nonactivated (IEGlow) cells, for the highest IEG-scoring GLUT population. Dots represent genes, red dots: top 100 DEGs with mean UMI > 1. b, DEGs frequently upregulated in activated (IEGhigh) cells (as in a), per cluster. Blue, low and red, high. c, Biological processes enriched in activated (IEGhigh) cells (as in a) per class; FDR-adjusted q values, and fold enrichment (DAVID). Source data
Fig. 5 Gene expression in IEGhigh engram cells. a, Scatterplot of differentially expressed genes between activated (IEGhigh, 95th percentile) and nonactivated (IEGlow) cells, for the highest IEG-scoring GLUT population. Dots represent genes, red dots: top 100 DEGs with mean UMI > 1. b, DEGs frequently upregulated in activated (IEGhigh) cells (as in a), per cluster. Blue, low and red, high. c, Biological processes enriched in activated (IEGhigh) cells (as in a) per class; FDR-adjusted q values, and fold enrichment (DAVID). Source dataCC BY · PubMed Central
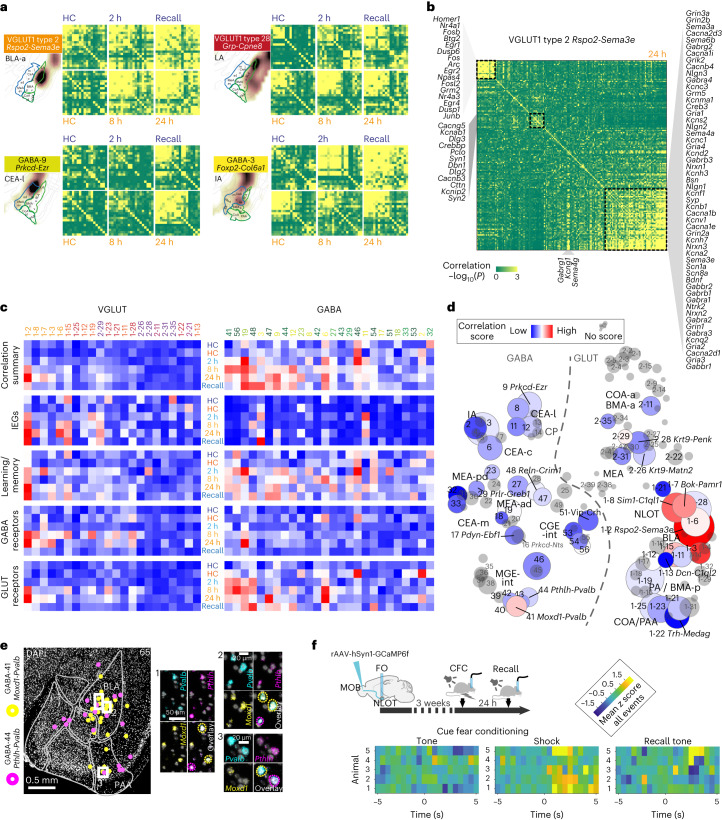
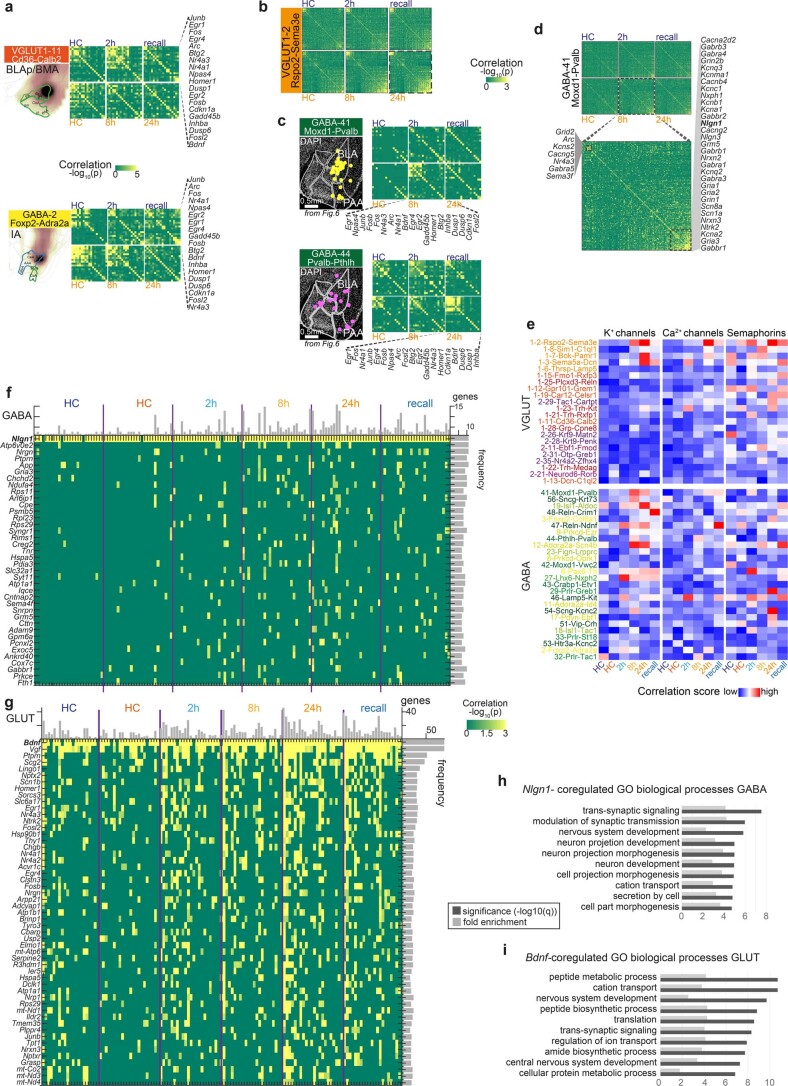
Fig. 6 Gene expression correlation identifies cell types with CFC-activated learning gene modules. a, Pearson pairwise correlation (green, low and yellow, high) of 18 IEGs for four cell types, resolved by post-CFC sampling timepoint and batch-specific HC control. For each cell type; top row, batch B (HC-2 h-recall); bottom row, batch A (HC-8 h-24 h); genes ordered by hierarchical clustering. b, Pairwise correlation of 156 learning-related genes, in VGLUT1 type 2, 24 h post CFC, with three correlated gene expression modules highlighted. Pearson coefficient (green, low and yellow, high), genes are ordered by hierarchical clustering. c, Time-resolved correlation, per experimental group (post-CFC, HC controls), for large clusters (smallest group in cluster ≥20 cells), for gene modules indicated, or all genes combined (‘correlation summary’). d, CFC-induced correlation across the full amygdala taxonomy, visualized as heatmap on t-SNE (as in Fig. 1b). Pairwise correlation score (gray, no score (smallest group in cluster <20 cells)). Circle size represents cluster size. c,d, Pearson pairwise correlation score (blue, low and red, high). e, Multiplex fluorescent in situ hybridization validates two Pvalb+ interneuron populations GABA-41 and GABA-44 (with different transcriptional responses to CFC) had similar spatial distributions primarily in the BLA. f, Targeting strategy for validation of NLOT participation in CFC via retrograde labeling of MOB-projecting neurons with GCaMP6f, and fiberphotometry recording in NLOT, during CFC and recall. Mean z score of NLOT calcium activity recorded in seven CFC tone-shock pairings (left), and four no-shock tone recall events (right), visualized as heatmap 5 seconds before and after the event, for five mice (rows). Source data
Fig. 6 Gene expression correlation identifies cell types with CFC-activated learning gene modules. a, Pearson pairwise correlation (green, low and yellow, high) of 18 IEGs for four cell types, resolved by post-CFC sampling timepoint and batch-specific HC control. For each cell type; top row, batch B (HC-2 h-recall); bottom row, batch A (HC-8 h-24 h); genes ordered by hierarchical clustering. b, Pairwise correlation of 156 learning-related genes, in VGLUT1 type 2, 24 h post CFC, with three correlated gene expression modules highlighted. Pearson coefficient (green, low and yellow, high), genes are ordered by hierarchical clustering. c, Time-resolved correlation, per experimental group (post-CFC, HC controls), for large clusters (smallest group in cluster ≥20 cells), for gene modules indicated, or all genes combined (‘correlation summary’). d, CFC-induced correlation across the full amygdala taxonomy, visualized as heatmap on t-SNE (as in Fig. 1b). Pairwise correlation score (gray, no score (smallest group in cluster <20 cells)). Circle size represents cluster size. c,d, Pearson pairwise correlation score (blue, low and red, high). e, Multiplex fluorescent in situ hybridization validates two Pvalb+ interneuron populations GABA-41 and GABA-44 (with different transcriptional responses to CFC) had similar spatial distributions primarily in the BLA. f, Targeting strategy for validation of NLOT participation in CFC via retrograde labeling of MOB-projecting neurons with GCaMP6f, and fiberphotometry recording in NLOT, during CFC and recall. Mean z score of NLOT calcium activity recorded in seven CFC tone-shock pairings (left), and four no-shock tone recall events (right), visualized as heatmap 5 seconds before and after the event, for five mice (rows). Source dataCC BY · PubMed Central
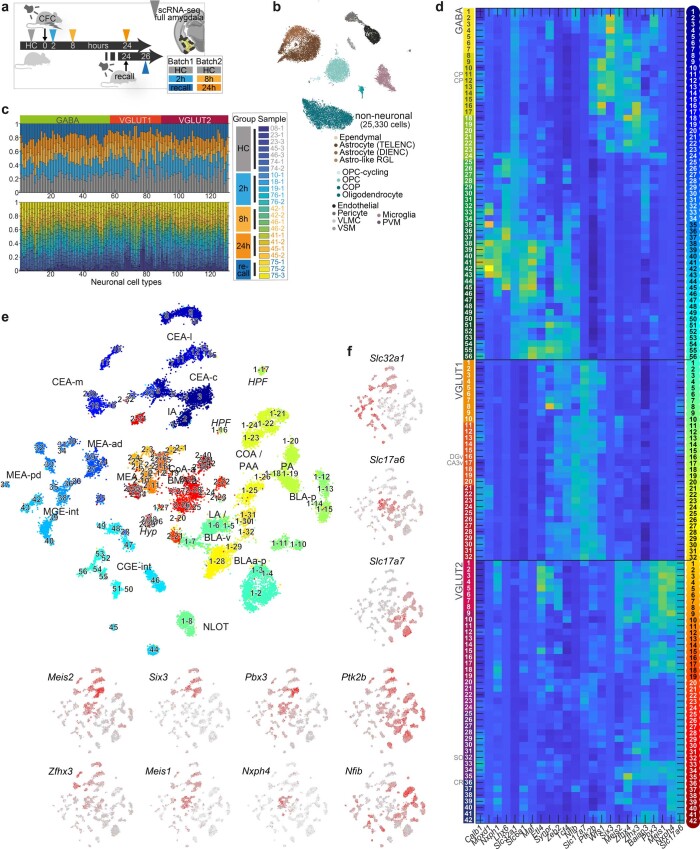
Extended Data Fig. 1 Cell types of the amygdala from adult, behaving mice. a, Sampling overview for full-cell scRNA-seq on amygdala of naïve, and cued-fear conditioned mice. b, tSNE embedding of 25,330 non-neuronal cells, colored by cell type (14 clusters). c Fraction of cells for 130 neuronal types, by sample (top) or experimental group (bottom). c Expression of genes differentially expressed between branches of the taxonomy, across 130 neuronal cell types by dendrogram order. Left, branch colors; right, cluster colors. d, tSNE embedding of 30,184 neuronal cells, colored by cluster (as c), annotated by cluster number, and region. e, tSNE embedding of neuronal cells with expression of neuronal class-defining genes Slc32a1, Slc17a7, Slc17a6; gray, low; red, high; highlighting GABA, VGLUT1 and VGLUT2 cells respectively. f, Expression of genes defining branches of the taxonomy; gray, low; red, high.
Extended Data Fig. 1 Cell types of the amygdala from adult, behaving mice. a, Sampling overview for full-cell scRNA-seq on amygdala of naïve, and cued-fear conditioned mice. b, tSNE embedding of 25,330 non-neuronal cells, colored by cell type (14 clusters). c Fraction of cells for 130 neuronal types, by sample (top) or experimental group (bottom). c Expression of genes differentially expressed between branches of the taxonomy, across 130 neuronal cell types by dendrogram order. Left, branch colors; right, cluster colors. d, tSNE embedding of 30,184 neuronal cells, colored by cluster (as c), annotated by cluster number, and region. e, tSNE embedding of neuronal cells with expression of neuronal class-defining genes Slc32a1, Slc17a7, Slc17a6; gray, low; red, high; highlighting GABA, VGLUT1 and VGLUT2 cells respectively. f, Expression of genes defining branches of the taxonomy; gray, low; red, high.CC BY · PubMed Central
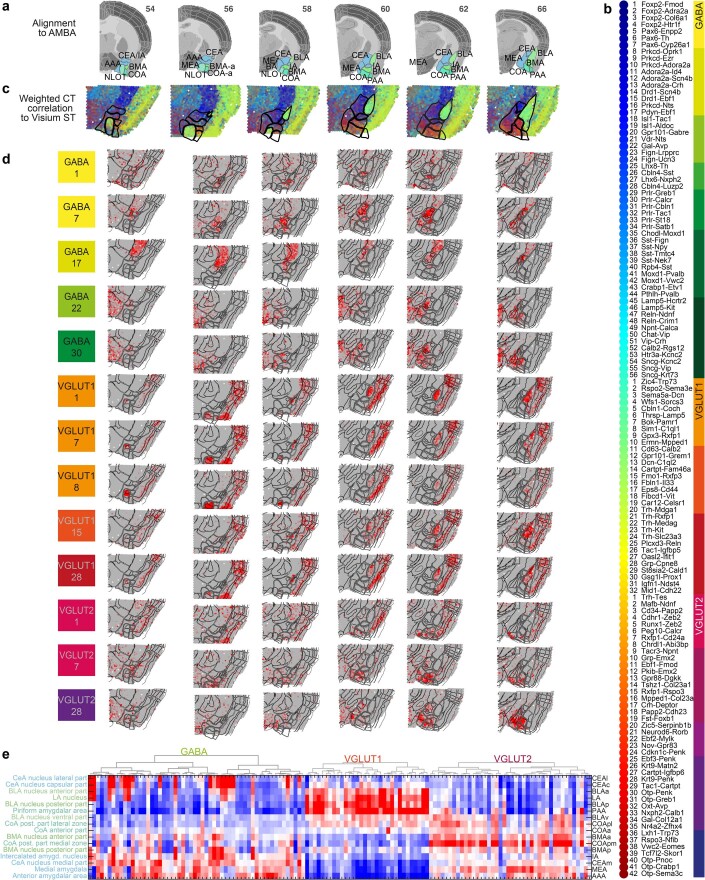
Extended Data Fig. 2 Spatial transcriptomics (Visium) for cell type mapping. a, Sample and section overview. 6 coronal sections covering the anterior-posterior amygdala; with alignment to reference sections (adjusted from Allen Reference Atlas – Mouse Brain (atlas.brain-map.org), and amygdala regions highlighted for anatomical reference. b, Cell types in dendrogram order, with color map for branches (right), and cluster colors (left). c, Spatial mapping of 130 neuronal clusters to Visium ST sections, visualized by weighted correlation of scRNA-seq-derived cell type profiles (b) to Visium ST capture spots. d, Correlation heatmap between spatial transcriptomics and 13 cell types (examples), visualized on the Visium ST sections. Gray, low; red, high correlation. e, Correlation heatmap between spatial transcriptomics expression annotated to amygdala regions (rows, ordered by similarity) and all 130 cell types (dendrogram order, as b). Blue, low; red, high correlation. Source data
Extended Data Fig. 2 Spatial transcriptomics (Visium) for cell type mapping. a, Sample and section overview. 6 coronal sections covering the anterior-posterior amygdala; with alignment to reference sections (adjusted from Allen Reference Atlas – Mouse Brain (atlas.brain-map.org), and amygdala regions highlighted for anatomical reference. b, Cell types in dendrogram order, with color map for branches (right), and cluster colors (left). c, Spatial mapping of 130 neuronal clusters to Visium ST sections, visualized by weighted correlation of scRNA-seq-derived cell type profiles (b) to Visium ST capture spots. d, Correlation heatmap between spatial transcriptomics and 13 cell types (examples), visualized on the Visium ST sections. Gray, low; red, high correlation. e, Correlation heatmap between spatial transcriptomics expression annotated to amygdala regions (rows, ordered by similarity) and all 130 cell types (dendrogram order, as b). Blue, low; red, high correlation. Source dataCC BY · PubMed Central
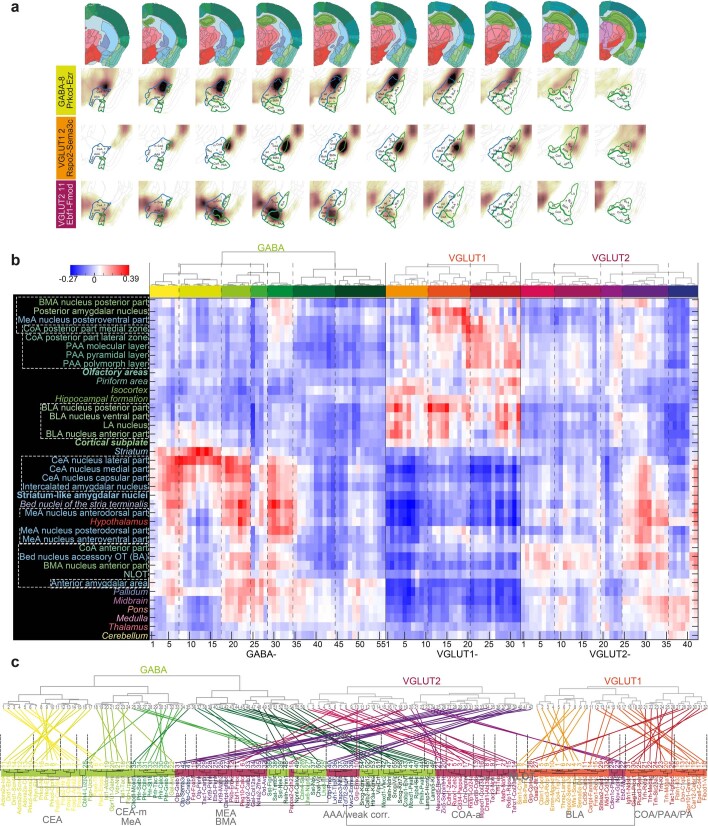
Extended Data Fig. 3 Inferred spatial cell type distributions using AMBA volumetric ISH. a, Inferred spatial distribution of three neuronal cell types, by correlating transcriptomic profiles with Allen Mouse Brain Atlas (AMBA-ISH), on eight a-p (left-to-right) sections, with amygdala nuclei labeled. For every cluster and every voxel, a correlation coefficient heatmap is shown (dark, high; white, low). b, Spatial correlation of all amygdala neuron clusters with the dissected amygdala nuclei, related or neighboring regions, and other higher-order gray matter structures. Regions are sorted by correlation similarity, cell types by dendrogram order. Region names are colored according to the AMBA convention; regions that were not (fully) dissected are in italic; higher-order amygdala regions are in bold. c, Up: Neuronal cell type taxonomy in dendrogram order of scRNA-seq clusters (note; VGLUT2 switched with VGLUT1 compared to Fig. 1), and below; neuronal cell type taxonomy by regional correlation; that is, cell types are arranged according to similarity in correlation with regions analyzed in b. The dendrogram is colored by cell class, ‘spatial clusters’ (that is cell types most strongly correlated in their spatial enrichment) with highest correlating regions indicated on dendrogram branches. Cell types are linked between the two classifications to reveal the relation of their scRNA-seq and spatial clustering.
Extended Data Fig. 3 Inferred spatial cell type distributions using AMBA volumetric ISH. a, Inferred spatial distribution of three neuronal cell types, by correlating transcriptomic profiles with Allen Mouse Brain Atlas (AMBA-ISH), on eight a-p (left-to-right) sections, with amygdala nuclei labeled. For every cluster and every voxel, a correlation coefficient heatmap is shown (dark, high; white, low). b, Spatial correlation of all amygdala neuron clusters with the dissected amygdala nuclei, related or neighboring regions, and other higher-order gray matter structures. Regions are sorted by correlation similarity, cell types by dendrogram order. Region names are colored according to the AMBA convention; regions that were not (fully) dissected are in italic; higher-order amygdala regions are in bold. c, Up: Neuronal cell type taxonomy in dendrogram order of scRNA-seq clusters (note; VGLUT2 switched with VGLUT1 compared to Fig. 1), and below; neuronal cell type taxonomy by regional correlation; that is, cell types are arranged according to similarity in correlation with regions analyzed in b. The dendrogram is colored by cell class, ‘spatial clusters’ (that is cell types most strongly correlated in their spatial enrichment) with highest correlating regions indicated on dendrogram branches. Cell types are linked between the two classifications to reveal the relation of their scRNA-seq and spatial clustering.CC BY · PubMed Central
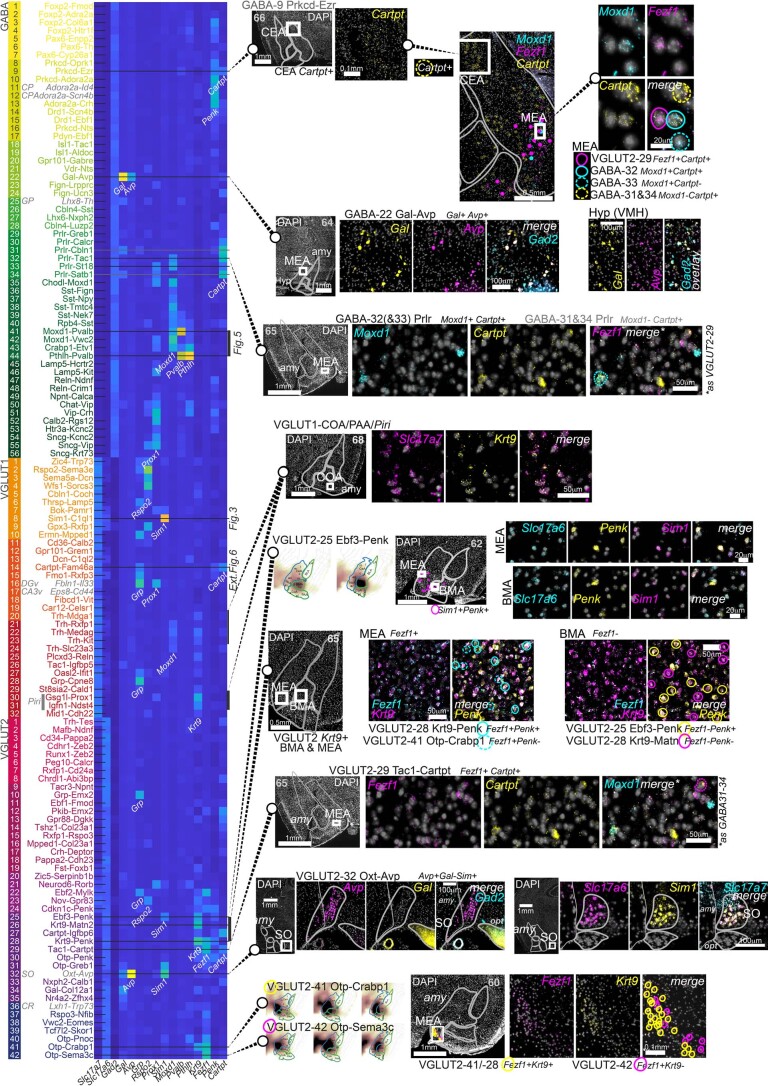
Extended Data Fig. 4 Validation of amygdala cell types using multiplex fluorescent in situ hybridization. Left, expression of genes validated in situ across the amygdala neuronal cell types taxonomy, in dendrogram order. Cell types validated using combinatorial staining are indicated as lines across the heatmap. Counterstained section overviews indicate position of zoom-ins. Section number in gray indicates anterior-posterior position used for amygdala masks (Allen Reference Atlas – Mouse Brain).
Extended Data Fig. 4 Validation of amygdala cell types using multiplex fluorescent in situ hybridization. Left, expression of genes validated in situ across the amygdala neuronal cell types taxonomy, in dendrogram order. Cell types validated using combinatorial staining are indicated as lines across the heatmap. Counterstained section overviews indicate position of zoom-ins. Section number in gray indicates anterior-posterior position used for amygdala masks (Allen Reference Atlas – Mouse Brain).CC BY · PubMed Central
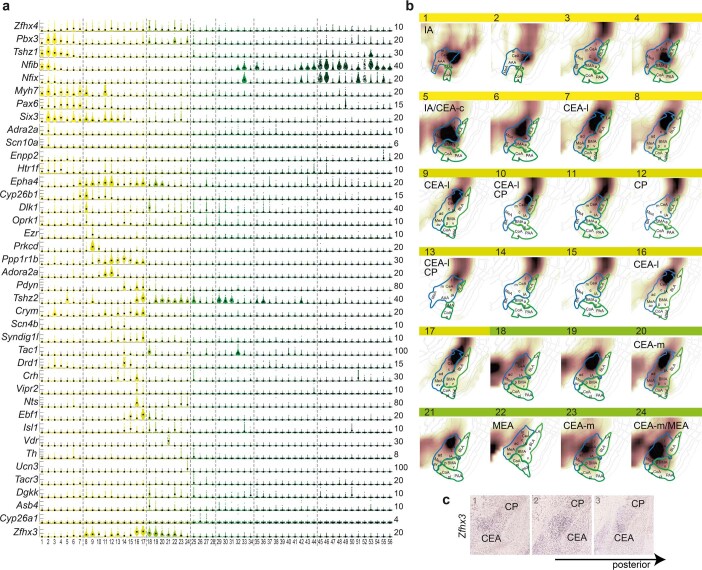
Extended Data Fig. 5 GABAergic populations of intercalated (IA) and central (CEA) amygdala. a, Gene expression in IA and CEA populations (GABA1-24), visualized as single-cell violin plots. Each dot represents one cell; black square, median expression, number of molecules (y-scale maximum) on the right. b, Inferred spatial distributions of GABA populations 1-24 using AMBA volumetric expression ISH data. Correlation coefficients visualized as a heat map on relevant coronal sections; white, low; brown, high correlation. c Expression of Zfhx3 (Allen Mouse Brain Atlas https://mouse.brain-map.org/experiment/show/74641308) is enriched in the CEA, compared to surrounding and related structures, such as dorsally neighboring striatal caudoputamen (CP).
Extended Data Fig. 5 GABAergic populations of intercalated (IA) and central (CEA) amygdala. a, Gene expression in IA and CEA populations (GABA1-24), visualized as single-cell violin plots. Each dot represents one cell; black square, median expression, number of molecules (y-scale maximum) on the right. b, Inferred spatial distributions of GABA populations 1-24 using AMBA volumetric expression ISH data. Correlation coefficients visualized as a heat map on relevant coronal sections; white, low; brown, high correlation. c Expression of Zfhx3 (Allen Mouse Brain Atlas https://mouse.brain-map.org/experiment/show/74641308) is enriched in the CEA, compared to surrounding and related structures, such as dorsally neighboring striatal caudoputamen (CP).CC BY · PubMed Central
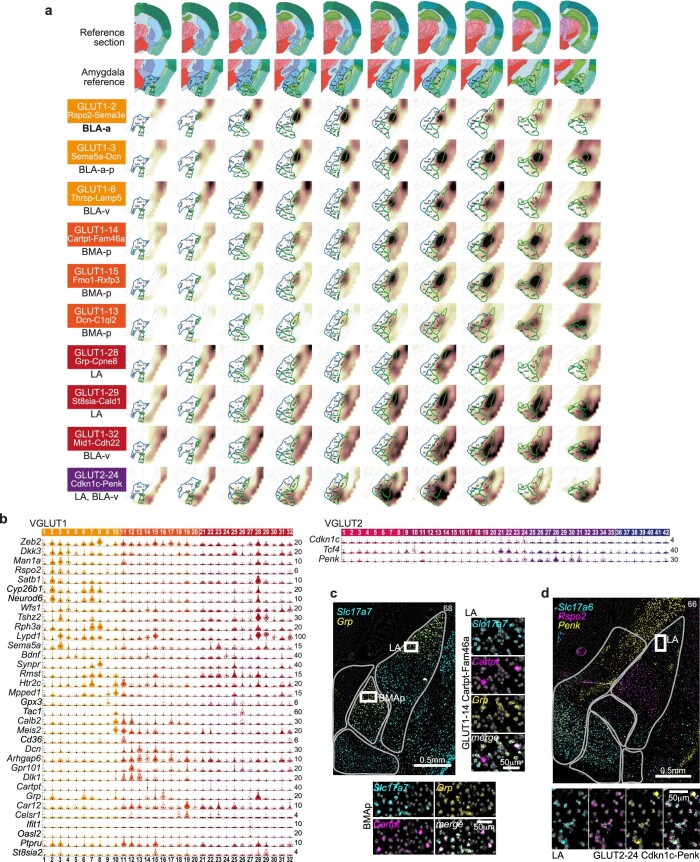
Extended Data Fig. 6 BLA/BMA/LA glutamatergic neuron populations. a, Inferred spatial distributions of VGLUT1 populations using AMBA volumetric expression ISH data. Correlation coefficients visualized as a heat map on coronal sections; white, low; brown, high correlation. Top rows, reference section adapted from Allen Reference Atlas – Mouse Brain, and annotated zoom-in; left column, cluster name, and most enriched structure. b, BLA/BMA/LA cell types gene expression visualized as single-cell violin plots. Each dot represents one cell; black square, median cluster expression, number of molecules (y-scale maximum) on the right. c, Multiplex fluorescent in situ hybridization validate Grp-VGLUT1 populations in the LA, and posterior BMA; such as Cartpt-expressing GLUT1-14. d, Multiplex fluorescent in situ hybridization validate VGLUT2 cells in the LA, alongside Rspo2; such as Penk-expressing GLUT2-24. c-d, scalebars for zoom-ins, 50μm.
Extended Data Fig. 6 BLA/BMA/LA glutamatergic neuron populations. a, Inferred spatial distributions of VGLUT1 populations using AMBA volumetric expression ISH data. Correlation coefficients visualized as a heat map on coronal sections; white, low; brown, high correlation. Top rows, reference section adapted from Allen Reference Atlas – Mouse Brain, and annotated zoom-in; left column, cluster name, and most enriched structure. b, BLA/BMA/LA cell types gene expression visualized as single-cell violin plots. Each dot represents one cell; black square, median cluster expression, number of molecules (y-scale maximum) on the right. c, Multiplex fluorescent in situ hybridization validate Grp-VGLUT1 populations in the LA, and posterior BMA; such as Cartpt-expressing GLUT1-14. d, Multiplex fluorescent in situ hybridization validate VGLUT2 cells in the LA, alongside Rspo2; such as Penk-expressing GLUT2-24. c-d, scalebars for zoom-ins, 50μm.CC BY · PubMed Central
Extended Data Fig. 7 Activated cell states across the neuronal taxonomy. a, Time-resolved expression of IEGs for three cell types; median, black; 90th percentile, orange. b, As Fig. 4c, in fraction cells expressing in the 90th percentile, eight IEGs used for IEG score, in the five top IEG-scoring GABA and GLUT types. c, GABA and GLUT clusters ranked according to IEG score. Circle size represents cluster size, color represents size of smallest sampling group (gray; <10 cells, dark green; >30 cells). d, Scatterplot of differentially expressed genes between activated (IEGhigh, 95th percentile) and non-activated (IEGlow) cells, for the highest IEG-scoring GLUT population. Dots represent genes, red dots; top 100 DEGs with mean UMI > 1.
Extended Data Fig. 7 Activated cell states across the neuronal taxonomy. a, Time-resolved expression of IEGs for three cell types; median, black; 90th percentile, orange. b, As Fig. 4c, in fraction cells expressing in the 90th percentile, eight IEGs used for IEG score, in the five top IEG-scoring GABA and GLUT types. c, GABA and GLUT clusters ranked according to IEG score. Circle size represents cluster size, color represents size of smallest sampling group (gray; <10 cells, dark green; >30 cells). d, Scatterplot of differentially expressed genes between activated (IEGhigh, 95th percentile) and non-activated (IEGlow) cells, for the highest IEG-scoring GLUT population. Dots represent genes, red dots; top 100 DEGs with mean UMI > 1.CC BY · PubMed Central
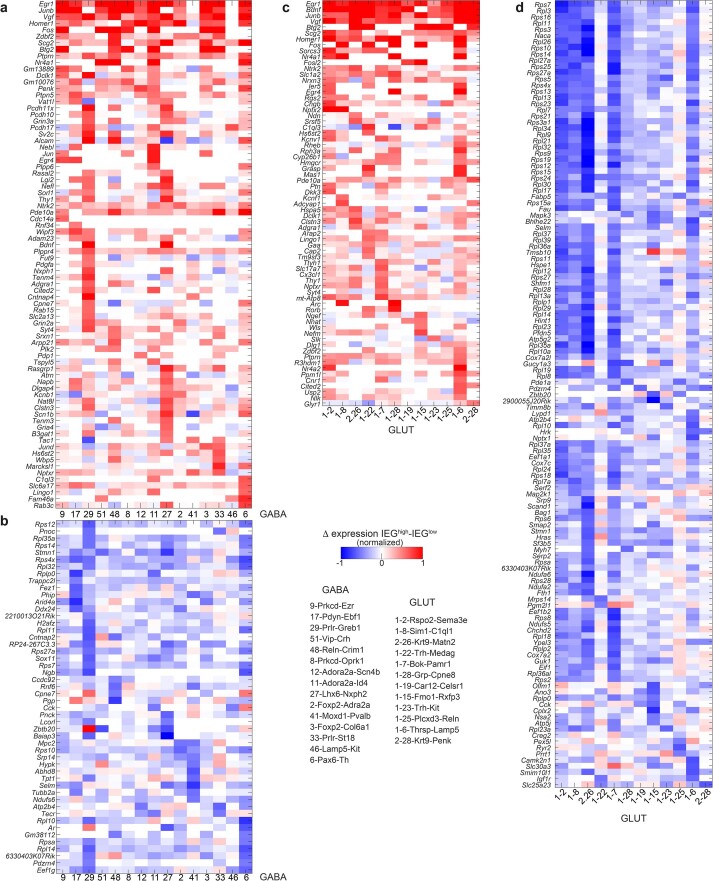
Extended Data Fig. 8 Differential gene expression in IEGhigh cells. Heatmaps of upregulated (a,c) and downregulated (b,d) genes in IEGhigh cells, per cell type, large clusters only. Cluster order by IEG score. Blue, low; red, high expression. Source data
Extended Data Fig. 8 Differential gene expression in IEGhigh cells. Heatmaps of upregulated (a,c) and downregulated (b,d) genes in IEGhigh cells, per cell type, large clusters only. Cluster order by IEG score. Blue, low; red, high expression. Source dataCC BY · PubMed Central
Extended Data Fig. 9 Gene expression correlation as a response to CFC. a, Pearson pairwise correlation coefficient (green, low; yellow, high) of 18 IEGs (rows and columns) for two cell types, resolved by post-CFC sampling time point and batch-specific home cage (HC) control. For each cell type; top row, batch B (HC-2h-recall); bottom row, batch A (HC-8h-24h); genes are ordered by hierarchical clustering, indicated on the right. b, For VGLUT1 2 Rspo2-Sema3e, pairwise correlation of 155 learning-related genes (rows and columns), per post-CFC sampling time point and batch-specific home cage (HC) control. Pearson coefficient (green, low; yellow, high), genes are ordered by hierarchical clustering. c, Pearson coefficient (green, low; yellow, high) of 18 IEGs (rows and columns) for Pvalb-interneuron types GABA 41 and -44, resolved by post-CFC sampling time point and batch-specific home cage (HC) control. For each cell type; top row, batch B (HC-2h-recall); bottom row, batch A (HC-8h-24h); genes are ordered by hierarchical clustering, indicated below. Left, distribution of each population in one amygdala section by multiplex FISH (see Fig. 5e) d, For GABAergic interneuron type Moxd1-Pvalb, pairwise correlation of 155 learning-related genes (rows and columns), per post-CFC sampling time point and batch-specific home cage (HC) control. Pearson coefficient (green, low; yellow, high), genes are ordered by hierarchical clustering. Zoom-in to 8 h post-CFC (right), with two correlated gene expression modules highlighted. e, As Fig. 6c; time-resolved correlation, per experimental group (post-CFC, HC controls), for large clusters (smallest group in cluster ≥20cells), resolved for sampling timepoints and batch-specific home cage (HC) controls, for gene modules indicated. f,g, For large clusters, Pearson coefficient for genes highly and frequently correlated with neuroligin Nlgn1 in GABA (f) or Bdnf in GLUT (g), per sample group (timepoints post-CFC, and naïve home cage (HC) per batch (orange, batch A; blue, batch B). Green, low; yellow, high. Rows, genes; columns, cell types (ordered by overall correlation score, as e). Bars on the top and left are the sum of each column or row (p > 0.01), respectively. h,i, Biological processes enriched among the top 200-genes correlated with Bdnf (GLUT) or Nlgn1 (GABA); FDR-adjusted q-values, and fold enrichment (DAVID). Source data
Extended Data Fig. 9 Gene expression correlation as a response to CFC. a, Pearson pairwise correlation coefficient (green, low; yellow, high) of 18 IEGs (rows and columns) for two cell types, resolved by post-CFC sampling time point and batch-specific home cage (HC) control. For each cell type; top row, batch B (HC-2h-recall); bottom row, batch A (HC-8h-24h); genes are ordered by hierarchical clustering, indicated on the right. b, For VGLUT1 2 Rspo2-Sema3e, pairwise correlation of 155 learning-related genes (rows and columns), per post-CFC sampling time point and batch-specific home cage (HC) control. Pearson coefficient (green, low; yellow, high), genes are ordered by hierarchical clustering. c, Pearson coefficient (green, low; yellow, high) of 18 IEGs (rows and columns) for Pvalb-interneuron types GABA 41 and -44, resolved by post-CFC sampling time point and batch-specific home cage (HC) control. For each cell type; top row, batch B (HC-2h-recall); bottom row, batch A (HC-8h-24h); genes are ordered by hierarchical clustering, indicated below. Left, distribution of each population in one amygdala section by multiplex FISH (see Fig. 5e) d, For GABAergic interneuron type Moxd1-Pvalb, pairwise correlation of 155 learning-related genes (rows and columns), per post-CFC sampling time point and batch-specific home cage (HC) control. Pearson coefficient (green, low; yellow, high), genes are ordered by hierarchical clustering. Zoom-in to 8 h post-CFC (right), with two correlated gene expression modules highlighted. e, As Fig. 6c; time-resolved correlation, per experimental group (post-CFC, HC controls), for large clusters (smallest group in cluster ≥20cells), resolved for sampling timepoints and batch-specific home cage (HC) controls, for gene modules indicated. f,g, For large clusters, Pearson coefficient for genes highly and frequently correlated with neuroligin Nlgn1 in GABA (f) or Bdnf in GLUT (g), per sample group (timepoints post-CFC, and naïve home cage (HC) per batch (orange, batch A; blue, batch B). Green, low; yellow, high. Rows, genes; columns, cell types (ordered by overall correlation score, as e). Bars on the top and left are the sum of each column or row (p > 0.01), respectively. h,i, Biological processes enriched among the top 200-genes correlated with Bdnf (GLUT) or Nlgn1 (GABA); FDR-adjusted q-values, and fold enrichment (DAVID). Source dataCC BY · PubMed Central
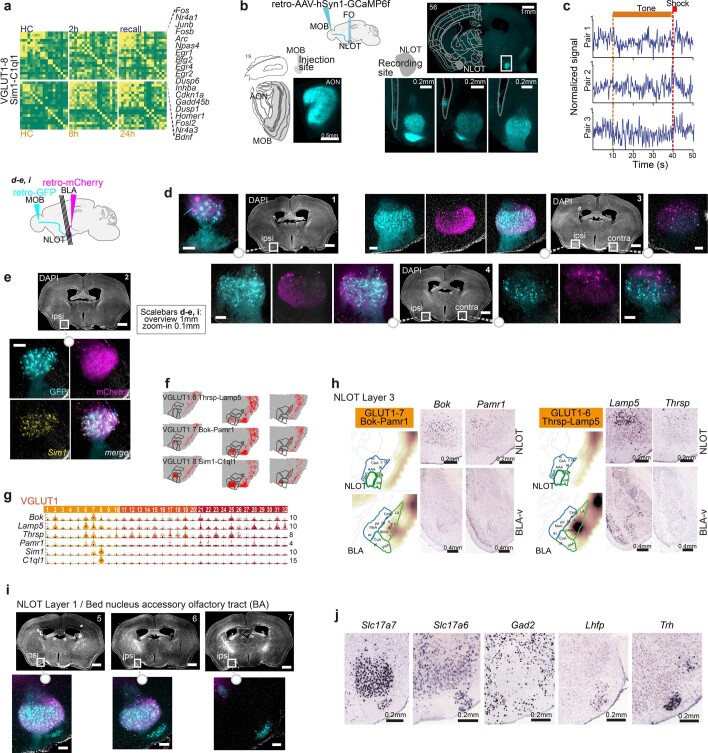
Extended Data Fig. 10 NLOT’s participation in CFC, and diversity in molecular NLOT types and projections. a, Pearson pairwise correlation (green, low; yellow, high) of 18 IEGs (rows and columns) for VGLUT1-8, resolved by post-CFC sampling time point and batch-specific home cage (HC) control. Top row, batch B (HC-2h-recall); bottom row, batch A (HC-8h-24h); genes are ordered by hierarchical clustering, indicated on the right. b, Expression of retro-AAV-hSyn1-GCaMP6f (cyan) in the injection site (left; MOB, with accessory olfactory nucleus (AON) strongly labeled), and recording site (right; NLOT) of one mouse. NLOT zoom-ins, 3 a.-p. positions reveal GCaMP6f expression in layer 1 and 2 NLOT, and tissue damage (outlined) indicates proximal optic-fiber tip placement. c, Examples of individual calcium-traces in three consecutive tone-shock pairings; with tone and shock duration indicated. d,e, NLOT projection tracing by injection of retro-AAV-hSyn1 to MOB (GFP; cyan) and BLA (mCherry; magenta). MOB-projecting NLOT neurons (cyan) primarily populate ipsi- and contralateral NLOT layer 2, BLA-projecting NLOT neurons (magenta) dominate layer 3; both populations partially express Sim1 (e). f, Spatial correlation to three Visium ST sections, for NLOT populations VGLUT1 6-8. g, Gene expression visualized as single-cell violin plots. h, Two additional populations sparsely label NLOT layer 3, but also BLA-v; indicated by inferred spatial distributions (AMBA volumetric correlation), and individual marker genes in Allen Mouse Brain Atlas (Bok, https://mouse.brain-map.org/experiment/show/71064032; Pamr1, https://mouse.brain-map.org/experiment/show/70744322; Lamp5, https://mouse.brain-map.org/experiment/show/70927827; Thrsp, https://mouse.brain-map.org/experiment/show/71587845). i, NLOT projection tracing (as d,e) in posterior sections reveal MOB-projecting (but not BLA-projecting) NLOT neurons (cyan) also populate NLOT layer 1, and putative bed nucleus of the accessory olfactory tract (BA). j, Individual genes expressed in NLOT layer 1 and BA (bed nucleus of the accessory olfactory tract), from Allen Mouse Brain Atlas (Slc17a7, https://mouse.brain-map.org/experiment/show/70436317; Slc17a6, https://mouse.brain-map.org/experiment/show/73818754; Gad2, https://mouse.brain-map.org/experiment/show/79591669; Lhfp, https://mouse.brain-map.org/experiment/show/73769323; Trh, https://mouse.brain-map.org/experiment/show/71016631).
Extended Data Fig. 10 NLOT’s participation in CFC, and diversity in molecular NLOT types and projections. a, Pearson pairwise correlation (green, low; yellow, high) of 18 IEGs (rows and columns) for VGLUT1-8, resolved by post-CFC sampling time point and batch-specific home cage (HC) control. Top row, batch B (HC-2h-recall); bottom row, batch A (HC-8h-24h); genes are ordered by hierarchical clustering, indicated on the right. b, Expression of retro-AAV-hSyn1-GCaMP6f (cyan) in the injection site (left; MOB, with accessory olfactory nucleus (AON) strongly labeled), and recording site (right; NLOT) of one mouse. NLOT zoom-ins, 3 a.-p. positions reveal GCaMP6f expression in layer 1 and 2 NLOT, and tissue damage (outlined) indicates proximal optic-fiber tip placement. c, Examples of individual calcium-traces in three consecutive tone-shock pairings; with tone and shock duration indicated. d,e, NLOT projection tracing by injection of retro-AAV-hSyn1 to MOB (GFP; cyan) and BLA (mCherry; magenta). MOB-projecting NLOT neurons (cyan) primarily populate ipsi- and contralateral NLOT layer 2, BLA-projecting NLOT neurons (magenta) dominate layer 3; both populations partially express Sim1 (e). f, Spatial correlation to three Visium ST sections, for NLOT populations VGLUT1 6-8. g, Gene expression visualized as single-cell violin plots. h, Two additional populations sparsely label NLOT layer 3, but also BLA-v; indicated by inferred spatial distributions (AMBA volumetric correlation), and individual marker genes in Allen Mouse Brain Atlas (Bok, https://mouse.brain-map.org/experiment/show/71064032; Pamr1, https://mouse.brain-map.org/experiment/show/70744322; Lamp5, https://mouse.brain-map.org/experiment/show/70927827; Thrsp, https://mouse.brain-map.org/experiment/show/71587845). i, NLOT projection tracing (as d,e) in posterior sections reveal MOB-projecting (but not BLA-projecting) NLOT neurons (cyan) also populate NLOT layer 1, and putative bed nucleus of the accessory olfactory tract (BA). j, Individual genes expressed in NLOT layer 1 and BA (bed nucleus of the accessory olfactory tract), from Allen Mouse Brain Atlas (Slc17a7, https://mouse.brain-map.org/experiment/show/70436317; Slc17a6, https://mouse.brain-map.org/experiment/show/73818754; Gad2, https://mouse.brain-map.org/experiment/show/79591669; Lhfp, https://mouse.brain-map.org/experiment/show/73769323; Trh, https://mouse.brain-map.org/experiment/show/71016631).CC BY · PubMed Central

Verification

Claims the paper makes

The claims and statistics of this paper haven’t been checked yet.

Run the check — free, no account needed. It reads the open-access text and checks the sources it cites.

A few free checks a day · papers already verified open instantly · results are public

Claims other papers make about this one

Each is checked against this paper’s own text: does it say what the citing paper says it does?

Self-check

Percentages, sums and reported differences re-computed from the paper’s own numbers.

The self-check needs the paper’s full text.

Citations

Cites

Show all 78 references

Research works printed but not linked: 1

  1. Ester, M., Kriegel, H.-P., Sander, J. & Xu, X. A density-based algorithm for discovering clusters in large spatial databases with noise. Proceedings of the Second International Conference on Knowledge Discovery and Data Mining (KDD'96) pp. 226–231 (AAAI Press, 1996).

Cited by

Sorted by citations

See all 110

Metadata

Authors
Hochgerner, H., Singh, S., Tibi, M., Lin, Z., Skarbianskis, N., Admati, I., Ophir, O., Reinhardt, N., Netser, S., Wagner, S., & Zeisel, A.
Affiliations
  • Technion – Israel Institute of Technology (IL)
  • University of Haifa (IL)
Corresponding author
Zeisel, Amit
Venue
Nature Neuroscience
Published
2023-10-26
Volume
26
Issue
12
Pages
2237-2249
ISSN
  • 1097-6256 (ISSN-L)
  • 1546-1726
OpenAlex
W4387965083
Cited by
110
References
78
Citations by year
2026: 34 · 2025: 48 · 2024: 27 · 2023: 1
FWCI
16.47
Type
journal article
Language
en
Open access
Locations
  • Nature Neuroscience (publishedVersion, cc-by)
  • PubMed Central (publishedVersion, cc-by)
  • PubMed (publishedVersion)
Funders
Israel Science Foundation (2028912)
Topics
  • Life Sciences › Neuroscience › Cognitive Neuroscience › Memory and Neural Mechanisms
  • Life Sciences › Biochemistry, Genetics and Molecular Biology › Molecular Biology › Single-cell and spatial transcriptomics
  • Life Sciences › Neuroscience › Cellular and Molecular Neuroscience › Neuroscience and Neuropharmacology Research
Keywords
amygdala, neuronal cell types, fear conditioning, fear memory consolidation, memory retrieval, engram cells, single-cell transcriptomics, molecular atlas, synaptic plasticity, neurite outgrowth
MeSH terms
Amygdala, Animals, Fear, Memory, Neuronal Plasticity, Neurons, Mice

About these checks

Registry, retraction, Cites and statistics results are computed, not judged, with one exception: a printed reference that no index lists is read once by a model before it counts as a citation error. Claims are extracted by a model and kept only when their quote appears verbatim in the text; each cited source is then checked, with a model’s help, for whether it says what the claim relies on. Those verdicts can be wrong — read the claim’s quote and the cited source before relying on one.

Statistics and arithmetic are recomputed, not judged.

Confidence bands are shown only for fields calibrated on our annotated test set. None is calibrated yet, so no band is shown.

What counts as a claim ›How we measure confidence ›How we check this ›

Are you an author, or do you see a problem with this page? Request a review