Cited by 21RNA Research and SplicingRNA and protein synthesis mechanismsRNA regulation and disease

The DOI matches its Crossref record; 3 of the 3 references it cites were found in a registry or an index.

Deadenylation kinetics of mixed poly(A) tails at single-nucleotide resolution

Open access
Lee, Young-suk, Levdansky, Yevgen, Jung, Yoonseok, Kim, V. Narry, Valkov, Eugene·2024·Nature Structural & Molecular Biology

Abstract

Shortening of messenger RNA poly(A) tails, or deadenylation, is a rate-limiting step in mRNA decay and is highly regulated during gene expression. The incorporation of non-adenosines in poly(A) tails, or ‘mixed tailing’, has been observed in vertebrates and viruses. Here, to quantitate the effect of mixed tails, we mathematically modeled deadenylation reactions at single-nucleotide resolution using an in vitro deadenylation system reconstituted with the complete human CCR4–NOT complex. Applying this model, we assessed the disrupting impact of single guanosine, uridine or cytosine to be equivalent to approximately 6, 8 or 11 adenosines, respectively. CCR4–NOT stalls at the 0, −1 and −2 positions relative to the non-adenosine residue. CAF1 and CCR4 enzyme subunits commonly prefer adenosine but exhibit distinct sequence selectivities and stalling positions. Our study provides an analytical framework to monitor deadenylation and reveals the molecular basis of tail sequence-dependent regulation of mRNA stability.

Overview

The claims and statistics of this paper haven’t been checked yet.

Run the check — free, no account needed. It reads the open-access text and checks the sources it cites.

A few free checks a day · papers already verified open instantly · results are public

Integrity signals

Registry

Crossref · 10.1038/s41594-023-01187-1

Cites

3 of 3 references verified0 citation errors · 0 not checkable

Statistics

Figures

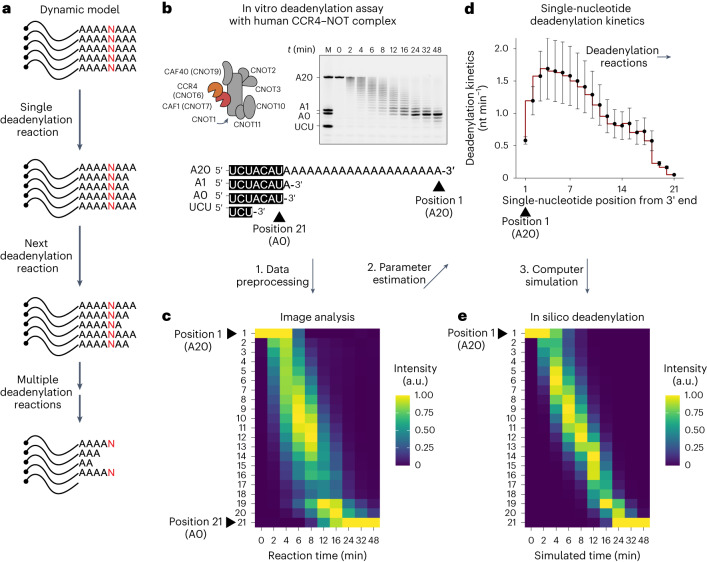
Fig. 1 Mathematical modeling of deadenylation kinetics at single-nucleotide resolution. a, Schematic of a dynamic model of deadenylation. b, In vitro deadenylation assay with human CCR4–NOT complex. c, Heatmap presentation of the deadenylation assay data. Position 1 represents the A20 RNA substrate, and position 21 represents the tailless 7-mer RNA. Column-specific unity-based normalization was applied for data visualization. d, Parameter estimation and deadenylation kinetics at each single-nucleotide position from the 3′ end. Error bars represent the standard error of parameter estimation. e, In silico deadenylation based on the estimated parameters. Column-specific unity-based normalization was applied for data visualization.
Fig. 1 Mathematical modeling of deadenylation kinetics at single-nucleotide resolution. a, Schematic of a dynamic model of deadenylation. b, In vitro deadenylation assay with human CCR4–NOT complex. c, Heatmap presentation of the deadenylation assay data. Position 1 represents the A20 RNA substrate, and position 21 represents the tailless 7-mer RNA. Column-specific unity-based normalization was applied for data visualization. d, Parameter estimation and deadenylation kinetics at each single-nucleotide position from the 3′ end. Error bars represent the standard error of parameter estimation. e, In silico deadenylation based on the estimated parameters. Column-specific unity-based normalization was applied for data visualization.CC BY · PubMed Central
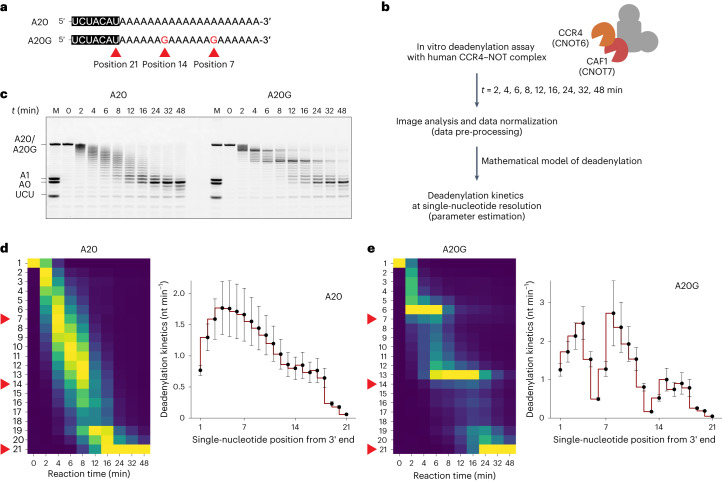
Fig. 2 Stalling effect of a single guanosine residue on human CCR4–NOT complex. a, Sequences of the synthetic 7-mer-A20 and 7-mer-A20G RNA substrates. Note the two guanosine residues at positions 7 and 14 for A20G. Position 21 represents the tailless 7-mer RNA. b, Schematic of the in vitro deadenylation analysis with human CCR4–NOT complex. c, In vitro deadenylation experiment with A20 and A20G RNA substrates (50 nM) and wild-type CCR4–NOT complex (25 nM). d, Left: heatmap analysis for A20 substrates. Column-specific unity-based normalization was applied for data visualization. Red arrowheads indicate the single-nucleotide positions 7, 14 and 21 from the 3′ end. Right: estimated deadenylation kinetics (nt min−1) based on the dynamic model. Error bars represent the standard error of parameter estimation. e, Deadenylation analysis as in d but with A20G RNA substrates. Error bars represent the standard error of parameter estimation. Heatmaps in d and e follow the same colour scale as in Fig. 1c,e. Source data
Fig. 2 Stalling effect of a single guanosine residue on human CCR4–NOT complex. a, Sequences of the synthetic 7-mer-A20 and 7-mer-A20G RNA substrates. Note the two guanosine residues at positions 7 and 14 for A20G. Position 21 represents the tailless 7-mer RNA. b, Schematic of the in vitro deadenylation analysis with human CCR4–NOT complex. c, In vitro deadenylation experiment with A20 and A20G RNA substrates (50 nM) and wild-type CCR4–NOT complex (25 nM). d, Left: heatmap analysis for A20 substrates. Column-specific unity-based normalization was applied for data visualization. Red arrowheads indicate the single-nucleotide positions 7, 14 and 21 from the 3′ end. Right: estimated deadenylation kinetics (nt min−1) based on the dynamic model. Error bars represent the standard error of parameter estimation. e, Deadenylation analysis as in d but with A20G RNA substrates. Error bars represent the standard error of parameter estimation. Heatmaps in d and e follow the same colour scale as in Fig. 1c,e. Source dataCC BY · PubMed Central
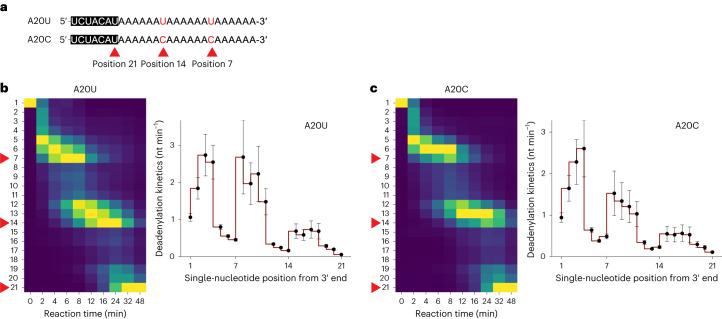
Fig. 3 Single pyrimidine residue produces a similar stalling effect but with greater impact at the terminal and antepenultimate positions. a, Sequences of the synthetic 7-mer-A20U and 7-mer-A20C RNA substrates (50 nM) and wild-type CCR4–NOT complex (25 nM). Note the two pyrimidine residues at position 7 and 14 for A20U and A20C. Position 21 represents the tailless 7-mer RNA. b, Left: heatmap analysis for A20U substrates. Column-specific unity-based normalization was applied for data visualization. Red arrowheads indicate the single-nucleotide positions 7, 14 and 21 from the 3′ end. Right: estimated deadenylation kinetics (nt min−1) based on the dynamic model. Error bars represent the standard error of parameter estimation. c, Deadenylation analysis as in b but with A20C RNA substrates. Error bars represent the standard error of parameter estimation. Heatmaps in b and c follow the same colour scale as in Fig. 1c,e.
Fig. 3 Single pyrimidine residue produces a similar stalling effect but with greater impact at the terminal and antepenultimate positions. a, Sequences of the synthetic 7-mer-A20U and 7-mer-A20C RNA substrates (50 nM) and wild-type CCR4–NOT complex (25 nM). Note the two pyrimidine residues at position 7 and 14 for A20U and A20C. Position 21 represents the tailless 7-mer RNA. b, Left: heatmap analysis for A20U substrates. Column-specific unity-based normalization was applied for data visualization. Red arrowheads indicate the single-nucleotide positions 7, 14 and 21 from the 3′ end. Right: estimated deadenylation kinetics (nt min−1) based on the dynamic model. Error bars represent the standard error of parameter estimation. c, Deadenylation analysis as in b but with A20C RNA substrates. Error bars represent the standard error of parameter estimation. Heatmaps in b and c follow the same colour scale as in Fig. 1c,e.CC BY · PubMed Central
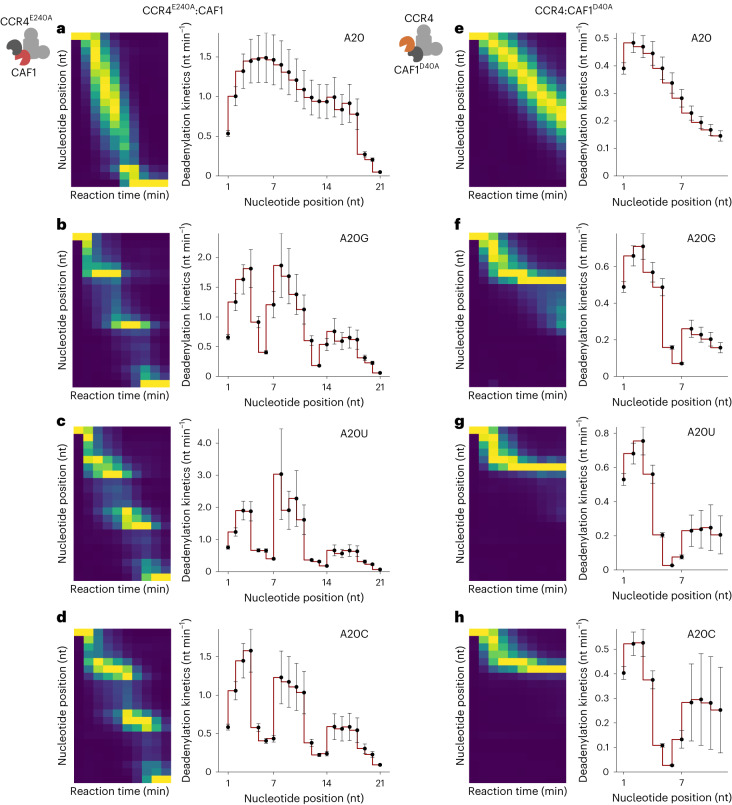
Fig. 4 The distinct kinetic property of each catalytic subunit. a–d, CCR4E240A:CAF1 mutant deadenylation analysis with A20 (a), A20G (b), A20U (c) and A20C (d) RNA substrates. e–h, CCR4:CAF1D40A mutant deadenylation analysis with A20 (e), A20G (f), A20U (g) and A20C (h) RNA substrates. Left: heatmap analysis. Column-specific unity-based normalization was applied for data visualization. Incubation was done for up to 48 min as in Fig. 3. Right: estimated deadenylation kinetics (nt min−1) based on the dynamic model. Error bars represent the standard error of parameter estimation. Heatmaps in a–h follow the same colour scale as in Fig. 1c,e.
Fig. 4 The distinct kinetic property of each catalytic subunit. a–d, CCR4E240A:CAF1 mutant deadenylation analysis with A20 (a), A20G (b), A20U (c) and A20C (d) RNA substrates. e–h, CCR4:CAF1D40A mutant deadenylation analysis with A20 (e), A20G (f), A20U (g) and A20C (h) RNA substrates. Left: heatmap analysis. Column-specific unity-based normalization was applied for data visualization. Incubation was done for up to 48 min as in Fig. 3. Right: estimated deadenylation kinetics (nt min−1) based on the dynamic model. Error bars represent the standard error of parameter estimation. Heatmaps in a–h follow the same colour scale as in Fig. 1c,e.CC BY · PubMed Central
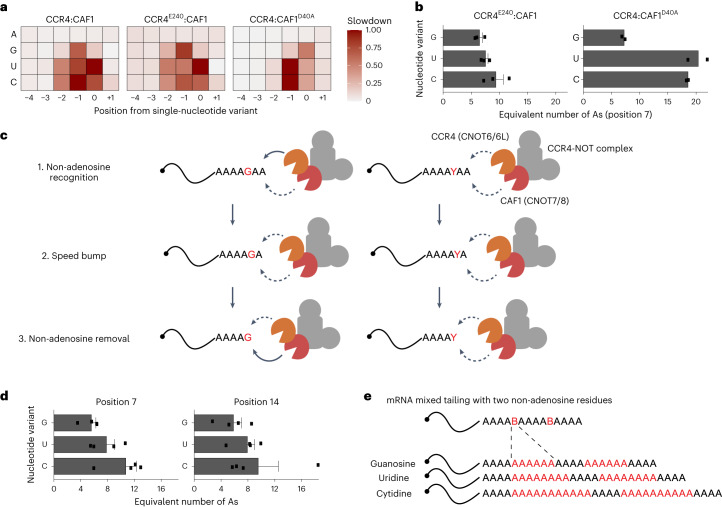
Fig. 5 Quantitative impact of mixed tails in terms of stalling deadenylation. a, The relative slowdown (or time for single-nucleotide removal) for each nucleotide variant and nucleotide position from the first non-A residue (that is, position 7). Unity-based normalization was applied for each type of human CCR4–NOT complex experiment. A, adenosine; G, guanosine; U, uridine; C, cytidine. b, The equivalent number of additional adenosines in terms of the deadenylation activity of CCR4E240A:CAF1 (n = 3) and CCR4:CAF1D40A (n = 2). The impact of the first residue (that is, position 7) was estimated. The barplot represents the mean number of additional adenosines, and error bars represent the s.e.m. c, A quantitative model of CCR4–NOT-dependent deadenylation. The solid lines represent strong deadenylation activity, and dashed lines represent relatively weak activity. d, The equivalent number of additional adenosines in terms of the deadenylation activity of wild-type complexes (n = 4). Impacts of both residues (positions 7 and 14) were estimated and are presented separately. The barplot represents the mean number of additional adenosines, and error bars represent the s.e.m. e, The quantitative impact of mixed tails in terms of the number of additional adenosines.
Fig. 5 Quantitative impact of mixed tails in terms of stalling deadenylation. a, The relative slowdown (or time for single-nucleotide removal) for each nucleotide variant and nucleotide position from the first non-A residue (that is, position 7). Unity-based normalization was applied for each type of human CCR4–NOT complex experiment. A, adenosine; G, guanosine; U, uridine; C, cytidine. b, The equivalent number of additional adenosines in terms of the deadenylation activity of CCR4E240A:CAF1 (n = 3) and CCR4:CAF1D40A (n = 2). The impact of the first residue (that is, position 7) was estimated. The barplot represents the mean number of additional adenosines, and error bars represent the s.e.m. c, A quantitative model of CCR4–NOT-dependent deadenylation. The solid lines represent strong deadenylation activity, and dashed lines represent relatively weak activity. d, The equivalent number of additional adenosines in terms of the deadenylation activity of wild-type complexes (n = 4). Impacts of both residues (positions 7 and 14) were estimated and are presented separately. The barplot represents the mean number of additional adenosines, and error bars represent the s.e.m. e, The quantitative impact of mixed tails in terms of the number of additional adenosines.CC BY · PubMed Central
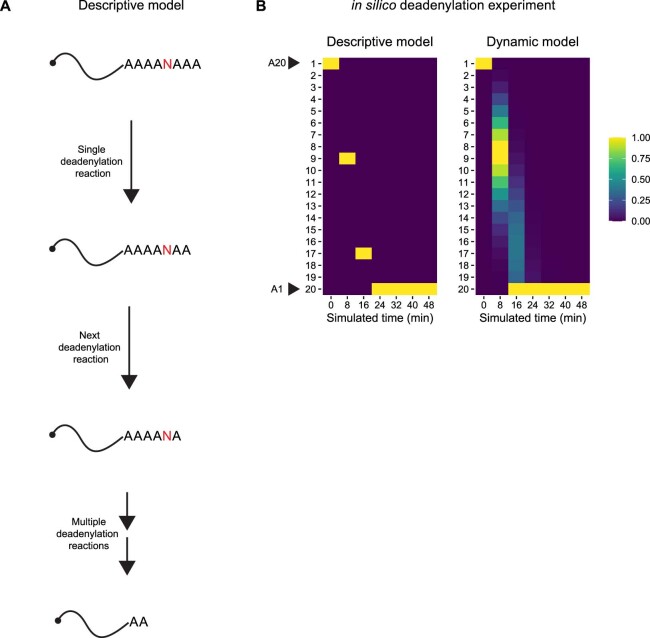
Extended Data Fig. 1 Mathematical models of deadenylation. a. Schematic of a descriptive model of deadenylation. b. In silico deadenylation experiment and heatmap analysis comparing the descriptive and dynamic models. Column-specific unity-based normalization was applied for data visualization. A20 represents RNA with a poly(A) tail length 20, and A1 represents RNA with a single-adenosine tail.
Extended Data Fig. 1 Mathematical models of deadenylation. a. Schematic of a descriptive model of deadenylation. b. In silico deadenylation experiment and heatmap analysis comparing the descriptive and dynamic models. Column-specific unity-based normalization was applied for data visualization. A20 represents RNA with a poly(A) tail length 20, and A1 represents RNA with a single-adenosine tail.CC BY · PubMed Central
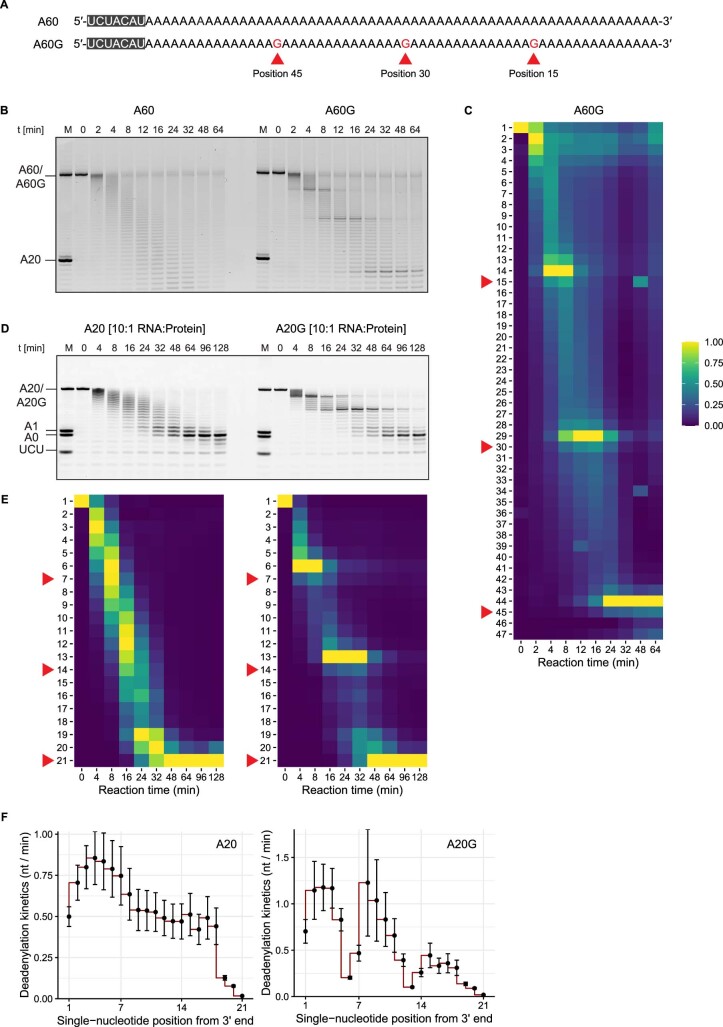
Extended Data Fig. 2 Alternative conditions for in vitro deadenylation experiments. a. Sequences of the synthetic 7-mer-A60 and 7-mer-A60G RNA substrates. b. Representative raw gel images from in vitro deadenylation experiment with A60 and A60G RNA substrates (50 nM) and wildtype CCR4-NOT complex (25 nM) of at least three technical and two biological replicates. c. Heatmap analysis for A60G substrates in (B). Column-specific unity-based normalization was applied for data visualization. Red arrowheads indicate the single-nucleotide positions 15, 30, and 45 from the 3′ end. d. Representative raw gel images after five-fold dilution from in vitro deadenylation experiment with A20 and A20G RNA substrates (250 nM) and wildtype CCR4-NOT complex (25 nM) of at least three technical and two biological replicates. e. Heatmap analysis for A20 and A20G substrates in (D). Column-specific unity-based normalization was applied for data visualization. Red arrowheads indicate the single-nucleotide positions 7, 14, and 21 from the 3′ end. f. Estimated deadenylation kinetics (nt / min) based on the dynamic model of (E). Error bars represent the standard error of parameter estimation. Source data
Extended Data Fig. 2 Alternative conditions for in vitro deadenylation experiments. a. Sequences of the synthetic 7-mer-A60 and 7-mer-A60G RNA substrates. b. Representative raw gel images from in vitro deadenylation experiment with A60 and A60G RNA substrates (50 nM) and wildtype CCR4-NOT complex (25 nM) of at least three technical and two biological replicates. c. Heatmap analysis for A60G substrates in (B). Column-specific unity-based normalization was applied for data visualization. Red arrowheads indicate the single-nucleotide positions 15, 30, and 45 from the 3′ end. d. Representative raw gel images after five-fold dilution from in vitro deadenylation experiment with A20 and A20G RNA substrates (250 nM) and wildtype CCR4-NOT complex (25 nM) of at least three technical and two biological replicates. e. Heatmap analysis for A20 and A20G substrates in (D). Column-specific unity-based normalization was applied for data visualization. Red arrowheads indicate the single-nucleotide positions 7, 14, and 21 from the 3′ end. f. Estimated deadenylation kinetics (nt / min) based on the dynamic model of (E). Error bars represent the standard error of parameter estimation. Source dataCC BY · PubMed Central
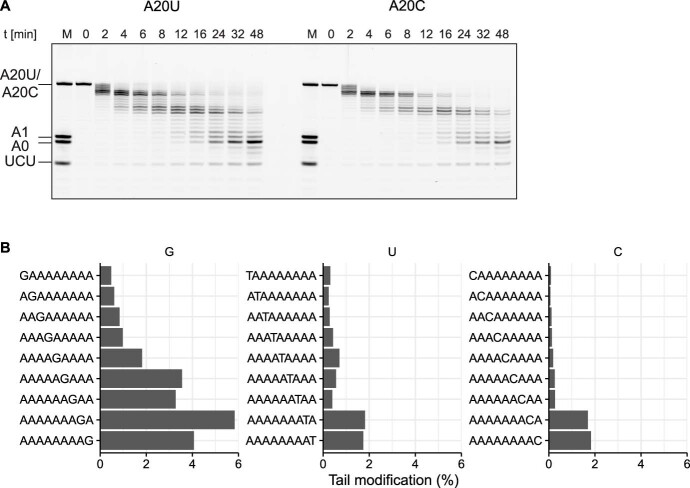
Extended Data Fig. 3 Supporting evidence related to Fig. 3. a. Representative raw gel images from in vitro deadenylation experiment with A20U and A20C RNA substrates (50 nM) and wildtype CCR4-NOT complex (25 nM) of at least three technical and two biological replicates. These images were used to quantitate deadenylation kinetics shown in Fig. 3. b. Re-analysis of TAIL-Seq data on HCMV-infected cells 10. The fraction of modified tails of HCMV RNA2.7 was calculated for RNAs with a poly(A) tail length of ≥25 nt (n = 1 TAIL-seq experiments). Source data
Extended Data Fig. 3 Supporting evidence related to Fig. 3. a. Representative raw gel images from in vitro deadenylation experiment with A20U and A20C RNA substrates (50 nM) and wildtype CCR4-NOT complex (25 nM) of at least three technical and two biological replicates. These images were used to quantitate deadenylation kinetics shown in Fig. 3. b. Re-analysis of TAIL-Seq data on HCMV-infected cells 10. The fraction of modified tails of HCMV RNA2.7 was calculated for RNAs with a poly(A) tail length of ≥25 nt (n = 1 TAIL-seq experiments). Source dataCC BY · PubMed Central
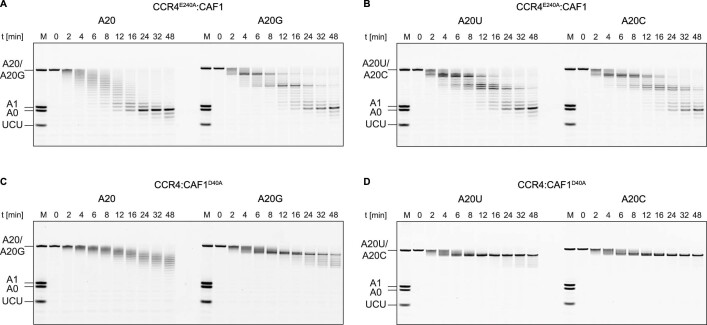
Extended Data Fig. 4 Supporting evidence related to Fig. 4. Representative raw gel images from in vitro deadenylation experiments with catalytic mutants (A,B) CCR4E240A:CAF1 and (C,D) CCR4:CAF1D40A of at least three technical and two biological replicates. These images were used to quantitate deadenylation kinetics shown in Fig. 4. Source data
Extended Data Fig. 4 Supporting evidence related to Fig. 4. Representative raw gel images from in vitro deadenylation experiments with catalytic mutants (A,B) CCR4E240A:CAF1 and (C,D) CCR4:CAF1D40A of at least three technical and two biological replicates. These images were used to quantitate deadenylation kinetics shown in Fig. 4. Source dataCC BY · PubMed Central

Verification

Claims the paper makes

The claims and statistics of this paper haven’t been checked yet.

Run the check — free, no account needed. It reads the open-access text and checks the sources it cites.

A few free checks a day · papers already verified open instantly · results are public

Claims other papers make about this one

Each is checked against this paper’s own text: does it say what the citing paper says it does?

Self-check

Percentages, sums and reported differences re-computed from the paper’s own numbers.

The self-check needs the paper’s full text.

Citations

Cites

Show all 3 references

Research works printed but not linked: 38

  1. Chang, H., Lim, J., Ha, M. & Kim, V. N. TAIL-seq: genome-wide determination of poly(A) tail length and 3′ end modifications. Mol. Cell 53, 1044–1052 (2014). · DOI · Paper page
  2. Lim, J. et al. Mixed tailing by TENT4A and TENT4B shields mRNA from rapid deadenylation. Science 361, 701–704 (2018). · DOI · Paper page
  3. Legnini, I., Alles, J., Karaiskos, N., Ayoub, S. & Rajewsky, N. FLAM-seq: full-length mRNA sequencing reveals principles of poly(A) tail length control. Nat. Methods 16, 879–886 (2019). · DOI
  4. Liu, Y., Nie, H., Liu, H. & Lu, F. Poly(A) inclusive RNA isoform sequencing (PAIso-seq) reveals wide-spread non-adenosine residues within RNA poly(A) tails. Nat. Commun. 10, 5292 (2019). · DOI
  5. Houseley, J. & Tollervey, D. The many pathways of RNA degradation. Cell 136, 763–776 (2009). · DOI
  6. LaCava, J. et al. RNA degradation by the exosome is promoted by a nuclear polyadenylation complex. Cell 121, 713–724 (2005). · DOI
  7. Kilchert, C., Wittmann, S. & Vasiljeva, L. The regulation and functions of the nuclear RNA exosome complex. Nat. Rev. Mol. Cell Biol. 17, 227–239 (2016). · DOI
  8. Hyrina, A. et al. A genome-wide CRISPR screen identifies ZCCHC14 as a host factor required for hepatitis B surface antigen production. Cell Rep. 29, 2970–2978.e6 (2019). · DOI
  9. Kim, D. et al. Viral hijacking of the TENT4–ZCCHC14 complex protects viral RNAs via mixed tailing. Nat. Struct. Mol. Biol. 27, 581–588 (2020). · DOI
  10. Donello, J. E., Beeche, A. A., Smith, G. J. III, Lucero, G. R. & Hope, T. J. The hepatitis B virus posttranscriptional regulatory element is composed of two subelements. J. Virol. 70, 4345–4351 (1996). · DOI
  11. Zufferey, R., Donello, J. E., Trono, D. & Hope, T. J. Woodchuck hepatitis virus posttranscriptional regulatory element enhances expression of transgenes delivered by retroviral vectors. J. Virol. 73, 2886–2892 (1999). · DOI
  12. Chen, C.-Y. A. & Shyu, A.-B. Mechanisms of deadenylation-dependent decay. Wiley Interdiscip. Rev. RNA 2, 167–183 (2011). · DOI
  13. Eisen, T. J. et al. The dynamics of cytoplasmic mRNA metabolism. Mol. Cell 77, 786–799.e10 (2020). · DOI · Paper page
  14. Collart, M. A. & Panasenko, O. O. The Ccr4–Not complex: architecture and structural insights. Subcell. Biochem. 83, 349–379 (2017). · DOI
  15. Yi, H. et al. PABP cooperates with the CCR4–NOT complex to promote mRNA deadenylation and block precocious decay. Mol. Cell 70, 1081–1088.e5 (2018). · DOI
  16. Webster, M. W. et al. mRNA deadenylation is coupled to translation rates by the differential activities of Ccr4–Not nucleases. Mol. Cell 70, 1089–1100.e8 (2018). · DOI
  17. Raisch, T. et al. Reconstitution of recombinant human CCR4–NOT reveals molecular insights into regulated deadenylation. Nat. Commun. 10, 3173 (2019). · DOI
  18. Maillet, L., Tu, C., Hong, Y. K., Shuster, E. O. & Collart, M. A. The essential function of Not1 lies within the Ccr4–Not complex. J. Mol. Biol. 303, 131–143 (2000). · DOI
  19. Bhandari, D., Raisch, T., Weichenrieder, O., Jonas, S. & Izaurralde, E. Structural basis for the nanos-mediated recruitment of the CCR4–NOT complex and translational repression. Genes Dev. 28, 888–901 (2014). · DOI
  20. Muhlrad, D. & Parker, R. The yeast EDC1 mRNA undergoes deadenylation-independent decapping stimulated by Not2p, Not4p, and Not5p. EMBO J. 24, 1033–1045 (2005). · DOI
  21. Tang, T. T. L., Stowell, J. A. W., Hill, C. H. & Passmore, L. A. The intrinsic structure of poly(A) RNA determines the specificity of Pan2 and Caf1 deadenylases. Nat. Struct. Mol. Biol. 26, 433–442 (2019). · DOI
  22. Chen, Y., Khazina, E., Izaurralde, E. & Weichenrieder, O. Crystal structure and functional properties of the human CCR4-CAF1 deadenylase complex. Nucleic Acids Res. 49, 6489–6510 (2021). · DOI
  23. Webster, M. W., Stowell, J. A. W., Tang, T. T. L. & Passmore, L. A. Analysis of mRNA deadenylation by multi-protein complexes. Methods 126, 95–104 (2017). · DOI
  24. Wiener, D., Antebi, Y. & Schwartz, S. Decoupling of degradation from deadenylation reshapes poly(A) tail length in yeast meiosis. Nat. Struct. Mol. Biol. 28, 1038–1049 (2021). · DOI
  25. Jia, H. et al. The RNA helicase Mtr4p modulates polyadenylation in the TRAMP complex. Cell 145, 890–901 (2011). · DOI
  26. Moré, J. J. The Levenberg–Marquardt algorithm: implementation and theory. In Numerical Analysis: Proc. Biennial Conference (ed. Watson, G. A.) 105–116 (Springer, 2006). · DOI
  27. Wang, H. et al. Crystal structure of the human CNOT6L nuclease domain reveals strict poly(A) substrate specificity. EMBO J. 29, 2566–2576 (2010). · DOI
  28. Basquin, J. et al. Architecture of the nuclease module of the yeast Ccr4–not complex: the Not1–Caf1–Ccr4 interaction. Mol. Cell 48, 207–218 (2012). · DOI
  29. Dlakić, M. Functionally unrelated signalling proteins contain a fold similar to Mg2+-dependent endonucleases. Trends Biochem. Sci. 25, 272–273 (2000). · DOI
  30. Jonstrup, A. T., Andersen, K. R., Van, L. B. & Brodersen, D. E. The 1.4-Å crystal structure of the S. pombe Pop2p deadenylase subunit unveils the configuration of an active enzyme. Nucleic Acids Res. 35, 3153–3164 (2007). · DOI
  31. Eisen, T. J., Eichhorn, S. W., Subtelny, A. O. & Bartel, D. P. MicroRNAs cause accelerated decay of short-tailed target mRNAs. Mol. Cell 77, 775–785.e8 (2020). · DOI
  32. Webster, M. W., Stowell, J. A. & Passmore, L. A. RNA-binding proteins distinguish between similar sequence motifs to promote targeted deadenylation by Ccr4–Not. eLife 8, e40670 (2019). · DOI
  33. Enwerem, I. I. I. et al. Human Pumilio proteins directly bind the CCR4–NOT deadenylase complex to regulate the transcriptome. RNA 27, 445–464 (2021). · DOI
  34. Poetz, F. et al. RNF219 attenuates global mRNA decay through inhibition of CCR4–NOT complex-mediated deadenylation. Nat. Commun. 12, 7175 (2021). · DOI
  35. Kulsuptrakul, J., Wang, R., Meyers, N. L., Ott, M. & Puschnik, A. S. A genome-wide CRISPR screen identifies UFMylation and TRAMP-like complexes as host factors required for hepatitis A virus infection. Cell Rep. 34, 108859 (2021). · DOI
  36. Schmid, M., Küchler, B. & Eckmann, C. R. Two conserved regulatory cytoplasmic poly(A) polymerases, GLD-4 and GLD-2, regulate meiotic progression in C. elegans. Genes Dev. 23, 824–836 (2009). · DOI
  37. Liu, Y. et al. Remodeling of maternal mRNA through poly(A) tail orchestrates human oocyte-to-embryo transition. Nat. Struct. Mol. Biol. 30, 200–215 (2023). · DOI
  38. Soetaert, K., Petzoldt, T. & Woodrow Setzer, R. Solving differential equations in R: package deSolve. J. Stat. Softw. 33, 1–25 (2010). · DOI

Cited by

Sorted by citations

Metadata

Authors
Lee, Y.-S., Levdansky, Y., Jung, Y., Kim, V. N., & Valkov, E.
Affiliations
  • Korea Advanced Institute of Science and Technology (KR)
  • National Cancer Institute (US)
  • Institute for Basic Science (KR)
  • Seoul National University (KR)
  • Frederick National Laboratory for Cancer Research (US)
Corresponding author
  • Lee, Young-suk
  • Kim, V. Narry
  • Valkov, Eugene
Venue
Nature Structural & Molecular Biology
Published
2024-02-19
Volume
31
Issue
5
Pages
826-834
ISSN
  • 1545-9985 (ISSN-L)
  • 1545-9993
OpenAlex
W4391927123
Cited by
21
References
3
Citations by year
2026: 9 · 2025: 11 · 2024: 1
FWCI
2.72
Type
journal article
Language
en
Open access
Locations
  • Nature Structural & Molecular Biology (publishedVersion, cc-by)
  • PubMed Central (publishedVersion, cc-by)
  • PubMed (publishedVersion)
  • KAIST Institutional Repository (KAIST) (submittedVersion)
Funders
  • National Research Foundation
  • Ministry of Science, ICT and Future Planning (IBS-R008-D1)
  • National Research Foundation of Korea (IBS-R008-D1, NRF-2021R1A4A3032789)
  • Institute for Basic Science (IBS-R008-D1, R008-D1)
  • Ministry of Science and ICT, South Korea (IBS-R008-D1)
  • National Institutes of Health
  • National Cancer Institute
Topics
  • Life Sciences › Biochemistry, Genetics and Molecular Biology › Molecular Biology › RNA Research and Splicing
  • Life Sciences › Biochemistry, Genetics and Molecular Biology › Molecular Biology › RNA and protein synthesis mechanisms
  • Life Sciences › Biochemistry, Genetics and Molecular Biology › Molecular Biology › RNA regulation and disease
Keywords
deadenylation, poly(A) tail, CCR4-NOT complex, CAF-1, CCR4, mRNA degradation, mRNA stability, sequence selectivity, mathematical modeling, single-nucleotide resolution
MeSH terms
Adenosine, Exoribonucleases, Humans, Kinetics, Poly A, RNA Nucleotidyltransferases, RNA, Messenger, RNA Stability, Receptors, CCR4

About these checks

Registry, retraction, Cites and statistics results are computed, not judged, with one exception: a printed reference that no index lists is read once by a model before it counts as a citation error. Claims are extracted by a model and kept only when their quote appears verbatim in the text; each cited source is then checked, with a model’s help, for whether it says what the claim relies on. Those verdicts can be wrong — read the claim’s quote and the cited source before relying on one.

Statistics and arithmetic are recomputed, not judged.

Confidence bands are shown only for fields calibrated on our annotated test set. None is calibrated yet, so no band is shown.

What counts as a claim ›How we measure confidence ›How we check this ›

Are you an author, or do you see a problem with this page? Request a review