

The DOI matches its Crossref record; 59 of the 59 references it cites were found in a registry or an index; 3 of the 31 sources its claims cite were checked for support.
A Multimodal Dataset for Mixed Emotion Recognition
Open accessAbstract
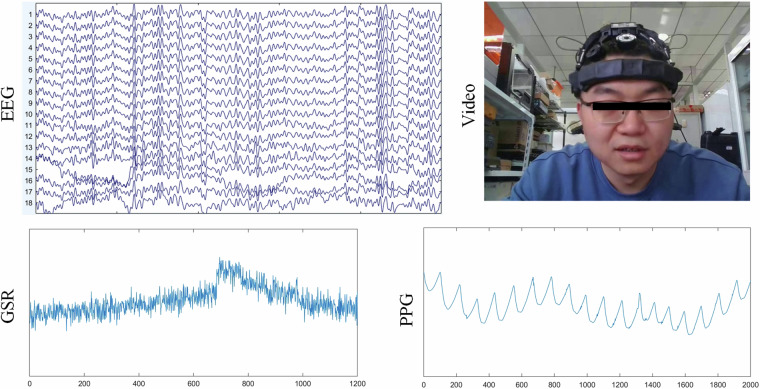
This paper introduces a multimodal dataset for mixed emotion recognition, combining frontal face video with physiological signals such as EEG, GSR, and PPG. It supports recognition of positive, negative, and mixed emotions and provides a benchmark for more realistic affective states.
Overview
CoChat Summary
TL;DR
This paper presents a multimodal dataset for mixed emotion recognition, collected while 80 college students watched 32 selected video clips intended to elicit positive, negative, or mixed emotions. After discarding 7 participants’ data, the final dataset contains EEG, GSR, PPG, frontal face video, and self-assessment data from 73 participants, and the authors report up to 80.96% average accuracy for 3-class emotion classification with SVM using all modalities.
Key findings
- The dataset includes two versions of the data, raw and time-aligned, and after discarding 7 participants due to deficient physiological data, it contains data from 73 participants.
- The final stimulus set contains 32 video clips: 8 positive, 8 negative, and 16 mixed.
- In technical validation, the average accuracy for 3-class classification (positive, negative, mixed) reached 80.96% using SVM with features from all modalities.
- For self-reports, positive videos had higher amusement than disgust, negative videos showed the opposite, and mixed videos had similar amusement and disgust ratings; PANAS also differed significantly across video types (e.g., positive vs. negative scores: W = 3133, p < 0.001; negative vs. positive: W = 32.5, p < 0.001).
Methods
- The study used a rule-based video filtering step on the Stanford film library, followed by expert evaluation by four experienced experts to select clips likely to induce positive, negative, and mixed emotions.
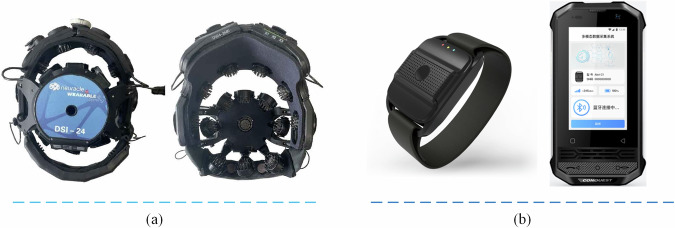
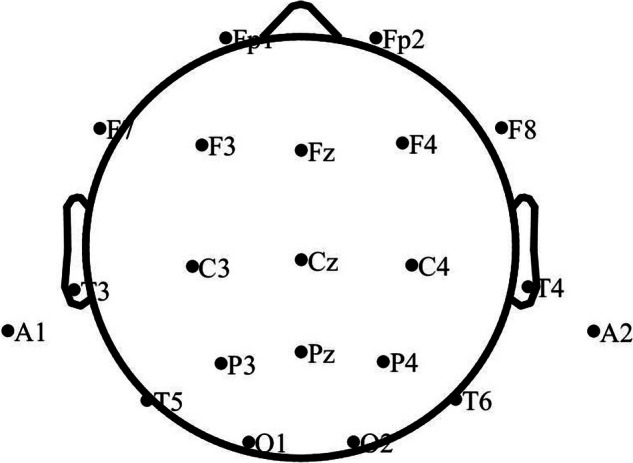
- 80 healthy college students participated; the experiment recorded EEG, GSR, PPG, and frontal face video while participants watched the selected clips and completed PANAS, VAD, amusement, and disgust self-ratings.
- For validation, the authors performed self-assessment analyses and mixed emotion classification using SVM and random forest in a participant-dependent protocol, with feature extraction from physiological signals and face video.
Limitations
- The paper states that the stimulus videos were not included in the repository because of copyright issues; only the names and access channel were provided.
- The dataset is only available upon request and requires a Data Use Agreement for academic research use only.
- Evident from the text: the classification validation is reported as a technical proof-of-concept, but the paper does not provide a full external replication study or cross-dataset validation; this is not explicitly stated as a limitation.
Model-written summary. Check it against the paper before relying on it.
Integrity signals
Registry
Cites
Statistics
Figures



Verification
Claims the paper makes
2 Valid · 1 Not valid · 14 Not checked · 43 Own results and interpretations
At least one cited source doesn’t support this claim or points to a different paper, and none confirmed it — see the verdicts below.
In the paper
“On the one hand, video clips are more effective at inducing emotions because they are more reflective of real life24.”
§ A Multimodal Dataset for Mixed Emotion Recognition > Background & Summary Affective computing plays an increasingly important role, especially in the era of Emotional Intelligence1,2. Among various affective computing tasks, emotion recognition is a key topic to achieving emotional intelligence3. Emotion recognition aims to enable machines to recognize people’s emotional states automatically. Similar to other machine learning problems, data is a prerequisite for this kind of machine intelligence. Consequently, several datasets have been proposed to promote the research of emotion recognition from physiological and behavioral signals. For example, the DEAP dataset4 collected Electroencephalogram (EEG), Galvanic Skin Response (GSR), blood volume pressure, respiration rate, skin temperature (ST), and Electrooculogram (EOG) signals of 32 participants. To contribute to affect recognition and implicit tagging research, Soleymani et al. constructed a multimodal database MAHNOB-HCI5 consisting of recorded face videos, audio signals, eye gaze data, and psychological signals (i.e. EEG, ECG, GSR, respiration amplitude, ST). Recently, Park et al. created a multimodal sensor dataset K-EmoCon6 for continuous emotion recognition in naturalistic conversations. Bota et al. released G-REx7 to support research on group emotion analysis based on (photoplethysmography (PPG) and electrodermal activity (EDA) in real-world settings. Other datasets for emotion analysis include DECAF8 (a database similar to DEAP, using Magnetoencephalogram (MEG) instead of EEG), AMIGOS9, etc. Although these existing datasets greatly promote the research of emotion recognition, they either focus on discrete emotion classification or focus on emotion classification in valence-arousal (VA) space. Mixed emotions are an important topic in emotion analysis and have received increasing attention10–16. Mixed emotion refers to the emotional state that is characterized by the co-occurrence of two or more emotional feelings10, e.g., experiencing both positive and negative emotions. Although there are many opinions about whether human beings can feel mixed emotions11–13, more and more evidence supports the fact that people can experience mixed emotional feelings10,13,17. One crucial issue for mixed emotion analysis is how to identify mixed emotional states. The most popular method used in previous works is the subjective reports, which measures mixed emotions through subject self-reports17,18. However, the limitation of subjective methods is that they may be subject to biases derived from memory19. In contrast, objective methods are less susceptible to subjective factors. Consequently, it is necessary to explore objective assessment methods based on expressive (e.g., facial expression) and physiological signals. Dataset is a key issue in the objective assessment of mixed emotions as none of the existing datasets involve mixed emotions. Therefore, it is urgent to establish a dataset for mixed emotion research. Reliable emotion induction is a main challenge for the construction of mixed emotion datasets. Various kinds of stimuli, including self-selected music20, motion pictures21,22, video clips23, etc., have been used to inducing mixed emotions. On the one hand, video clips are more effective at inducing emotions because they are more reflective of real life24. On the other hand, films usually have a high degree of ecological validity25. Due to the aforementioned advantages of video clips, we use the Stanford film library23 as a stimuli source and use a rule-based stimuli filtering strategy to select video clips that can reliably elicit positive, negative, and mixed emotions.
What the sources say
- Disputedcites [24] Uhrig, M. K. et al. Emotion elicitation: A comparison of pictures and films. Frontiers in psychology 7, 180 (2016). sourceExperimental — accuracy not yet measured
The Introduction presents films’ similarity to real life as a theoretical argument, not an established reason they induce emotions more effectively. The Abstract reports that film clips were less effective than pictures at producing corresponding emotional states, and the Conclusions say they did not appear to be better than pictures. (LLM, conf=0.90)
Checked by a reasoning model — may be wrong.
plainstates a cause- Asserted: passes — The authors put it forward as true.
- Checkable: passes — It can be checked against evidence.
- Load-bearing: passes — The paper’s conclusions depend on it.
- Based: passes — The paper gives a reason why it holds.
- Disputed
A result the paper reports from its own data — it cites no other source for it, so there is none to check. The quote shows it is in the paper.
In the paper
“In total, the dataset consists of multimodal signal data and self-assessment data from 73 participants.”
§ A Multimodal Dataset for Mixed Emotion Recognition > Abstract
plainn = 73- Asserted: passes — The authors put it forward as true.
- Checkable: passes — It can be checked against evidence.
- Load-bearing: passes — The paper’s conclusions depend on it.
- Based: passes — The paper gives a reason why it holds.
A result the paper states — it cites no source for it, so there is none to check. The quote shows it is in the paper.
In the paper
“As a result, we selected 32 video clips, including 8 for positive emotions, 8 for negative emotions, and 16 for mixed emotions.”
§ A Multimodal Dataset for Mixed Emotion Recognition > Methods > Stimuli selection
plain- Asserted: passes — The authors put it forward as true.
- Checkable: passes — It can be checked against evidence.
- Load-bearing: passes — The paper’s conclusions depend on it.
- Based: passes — The paper gives a reason why it holds.
A result the paper states — it cites no source for it, so there is none to check. The quote shows it is in the paper.
In the paper
“By applying the above filtering rules, we finally got 26, 15, and 15 candidate excerpts for mixed, positive, and negative emotions, respectively.”
§ A Multimodal Dataset for Mixed Emotion Recognition > Methods > Stimuli selection
plainstates a cause- Asserted: passes — The authors put it forward as true.
- Checkable: passes — It can be checked against evidence.
- Load-bearing: unclear — It is unclear whether the paper’s conclusions depend on it.
- Based: passes — The paper gives a reason why it holds.
A result the paper reports from its own data — it cites no other source for it, so there is none to check. The quote shows it is in the paper.
In the paper
“For mixed emotion videos (see Fig. 1(c)), compared to non-selected videos, the selected mixed videos are more likely to be in the center of the Figure, which means that the selected videos have closer PA and NA values.”
§ A Multimodal Dataset for Mixed Emotion Recognition > Methods > Stimuli selection
hedgedstates an association- Asserted: passes — The authors put it forward as true.
- Checkable: passes — It can be checked against evidence.
- Load-bearing: passes — The paper’s conclusions depend on it.
- Based: passes — The paper gives a reason why it holds.
25 more claims
Create a free account to see all 60 claims and to verify the 1 reference still open.
- Probably not a substantial claim. 16
- It may state two separate claims as one. 16
Self-check
Percentages, sums and reported differences re-computed from the paper’s own numbers.
Self-check results appear here once an independent check has confirmed them.
Cited works that were retracted
Works this paper cites that were later retracted, from the retraction notices publishers deposit. Major when the notice came out before this paper was published.
A note, not an issue: for example, a cited work that was retracted only after this paper was published, which its authors could not have known.
In the paper
“It has been widely collected in previous emotion recognition databases, such as DEAP 4 , MANHOB-HCI 5 , and has been reported to be related to different emotion experiences 29,30 .”
Cited work 10.1109/icscse.2016.0051 · retraction date not known · this paper published 2024-08-05
Citations
Cites
1 retracted
Liu, M., Fan, D., Zhang, X., & Gong, X. (2016) · 2016 International Conference on Smart City and Systems Engineering (ICSCSE) · doi:10.1109/icscse.2016.0051 · Cited by 57 · cited 1×
“It has been widely collected in previous emotion recognition databases, such as DEAP 4 , MANHOB-HCI 5 , and has been reported to be related to different emotion experiences 29,30 .”
MethodRetractedWelch, P. (1967) · IEEE Transactions on Audio and Electroacoustics · doi:10.1109/tau.1967.1161901 · Cited by 12,277
PsychoPy2: Experiments in behavior made easy
Peirce, J., Gray, J. R., Simpson, S., MacAskill, M., Höchenberger, R., Sogo, H., Kastman, E., & Lindeløv, J. K. (2019) · Behavior Research Methods · doi:10.3758/s13428-018-01193-y · Cited by 5,166
DEAP: A Database for Emotion Analysis ;Using Physiological Signals
Koelstra, S., Muhl, C., Soleymani, M., Lee, J.-S., Yazdani, A., Ebrahimi, T., Pun, T., Nijholt, A., & Patras, I. (2012) · IEEE Transactions on Affective Computing · doi:10.1109/t-affc.2011.15 · Cited by 5,093
Russell, J. A., & Barrett, L. F. (1999) · Journal of Personality and Social Psychology · doi:10.1037//0022-3514.76.5.805 · Cited by 3,102 · cited 1×
“Although there are many opinions about whether human beings can feel mixed emotions 11–13 , more and more evidence supports the fact that people can experience mixed emotional feelings 10,13,17 .”
BackgroundDynamic Texture Recognition Using Local Binary Patterns with an Application to Facial Expressions
Zhao, G., & Pietikainen, M. (2007) · IEEE Transactions on Pattern Analysis and Machine Intelligence · doi:10.1109/tpami.2007.1110 · Cited by 2,846
TARGET ARTICLES: "Emotional Intelligence: Theory, Findings, and Implications"
Mayer, J. D., Salovey, P., & Caruso, D. R. (2004) · Psychological Inquiry · doi:10.1207/s15327965pli1503_02 · Cited by 2,337
Toward machine emotional intelligence: analysis of affective physiological state
Picard, R. W., Vyzas, E., & Healey, J. (2001) · IEEE Transactions on Pattern Analysis and Machine Intelligence · doi:10.1109/34.954607 · Cited by 2,334
Emotion elicitation using films
Gross, J. J., & Levenson, R. W. (1995) · Cognition & Emotion · doi:10.1080/02699939508408966 · Cited by 2,179 · cited 1×
“On the other hand, films usually have a high degree of ecological validity 25 .”
BackgroundCacioppo, J. T., & Berntson, G. G. (1994) · Psychological Bulletin · doi:10.1037//0033-2909.115.3.401 · Cited by 1,882
Cited by
Ometov, A., Mezina, A., Lin, H.-C., Arponen, O., Bürget, R., & Nurmi, J. (2025) · Journal of Healthcare Informatics Research · doi:10.1007/s41666-025-00200-0 · Cited by 29
Emotion recognition via affective EEG signals: State of the art
Meng, W., Hou, F., Zhao, M., Kong, J., Wu, J., Zuo, J., & Liu, Q. (2025) · Neurocomputing · doi:10.1016/j.neucom.2025.130418 · Cited by 22
Cross-modal gated feature enhancement for multimodal emotion recognition in conversations
Zhao, S., Ren, J., & Zhou, X. (2025) · Scientific Reports · doi:10.1038/s41598-025-11989-6 · Cited by 36
HeLo: Heterogeneous Multi-Modal Fusion with Label Correlation for Emotion Distribution Learning
Zheng, C., Tian, C., Wen, J., Zhang, D., & Zhu, Q. (2025) · ACM International Conference on Multimedia (ACM MM) · doi:10.1145/3746027.3754852 · Cited by 16
Self-citationAn emotion recognition method based on frequency-domain features of PPG
Zhu, Z., Wang, X., Xu, Y., Chen, W., Jing, Z., Chen, S., & Chen, H. (2025) · Frontiers in Physiology · doi:10.3389/fphys.2025.1486763 · Cited by 16
Metadata
- Authors
- Yang, P., Liu, N., Liu, X., Shu, Y., Ji, W., Ren, Z., Sheng, J., Yu, M., Yi, R., Zhang, D., & Liu, Y.-J.
- Affiliations
- Tsinghua University (CN)
- Tianjin University (CN)
- Shanghai Jiao Tong University (CN)
- Corresponding author
- Liu, Yong-Jin
- ORCID
- Venue
- Scientific Data
- Published
- 2024-08-05
- Volume
- 11
- Issue
- 1
- Pages
- 847-847
- ISSN
- 2052-4463 (ISSN-L)
- PMC
- PMC11300855
- OpenAlex
- W4401333309
- Cited by
- 37
- References
- 59
- Citations by year
- 2026: 21 · 2025: 15 · 2024: 1
- Type
- data paper
- Language
- en
- Open access
- gold
- doi.org
- Licence
- cc-by-nc-nd
- creativecommons.org/licenses/by-nc-nd/4.0 (tdm)
- creativecommons.org/licenses/by-nc-nd/4.0 (vor)
- Locations
- Scientific Data (publishedVersion, cc-by-nc-nd)
- PubMed Central (publishedVersion, cc-by-nc-nd)
- PubMed (publishedVersion)
- DOAJ (DOAJ: Directory of Open Access Journals) (submittedVersion)
- Funders
- National Natural Science Foundation of China (U1736220)
- Tsinghua University (Tsinghua University Initiative Scientific Research Program)
- Topics
- Physical Sciences › Computer Science › Artificial Intelligence › Emotion and Mood Recognition
- Physical Sciences › Computer Science › Artificial Intelligence › Sentiment Analysis and Opinion Mining
- Health Sciences › Medicine › Cardiology and Cardiovascular Medicine › Heart Rate Variability and Autonomic Control
- Keywords
- emotion induction, EEG, skin conductance, photoplethysmography, PANAS, VAD, affective computing
- MeSH terms
- Electroencephalography, Emotions, Facial Expression, Humans, Video Recording
About these checks
Registry, retraction, Cites and statistics results are computed, not judged, with one exception: a printed reference that no index lists is read once by a model before it counts as a citation error. Claims are extracted by a model and kept only when their quote appears verbatim in the text; each cited source is then checked, with a model’s help, for whether it says what the claim relies on. Those verdicts can be wrong — read the claim’s quote and the cited source before relying on one.
The claim verdicts this report counts are experimental: their accuracy is not yet measured.
A language model drew the claims from the paper on 2026-10-10, under version 3 of the claim definition (model deepseek-v4.1-flash, prompt extract-v3).
A second model labelled each claim on 2026-10-10 (model jev-1.13-20260917, definition revision gold-guideline-v0.2).
Cited sources are checked with a language model’s help (gpt-6-sol).
Statistics and arithmetic are recomputed, not judged.
Confidence bands are shown only for fields calibrated on our annotated test set. None is calibrated yet, so no band is shown.
What counts as a claim ›How we measure confidence ›How we check this ›
Are you an author, or do you see a problem with this page? Request a review
How to cite
Cite CoChat for the checks on this page, and the paper for its own findings.
- This page
- CoChat. (2026). Citation check: A Multimodal Dataset for Mixed Emotion Recognition. https://app.cochat.ai/papers/10.1038/s41597-024-03676-4
- The paper
- Yang, P., Liu, N., Liu, X., Shu, Y., Ji, W., Ren, Z., Sheng, J., Yu, M., Yi, R., Zhang, D., & Liu, Y.-J. (2024). A Multimodal Dataset for Mixed Emotion Recognition. Scientific Data. https://doi.org/10.1038/s41597-024-03676-4
Data sources
Bibliographic data: Semantic Scholar, OpenAlex, Crossref.
Contains information from the Semantic Scholar Academic Graph Datasets, made available under the ODC Attribution License (ODC-BY 1.0).
Semantic Scholar’s data is described in: Kinney, R., et al. (2023). The Semantic Scholar Open Data Platform. arXiv:2301.10140.
