

The DOI matches its Crossref record; 37 of the 37 references it cites were found in a registry or an index.
Automated analysis of connected speech reveals early biomarkers of Parkinson’s disease in patients with rapid eye movement sleep behaviour disorder
Open accessAbstract
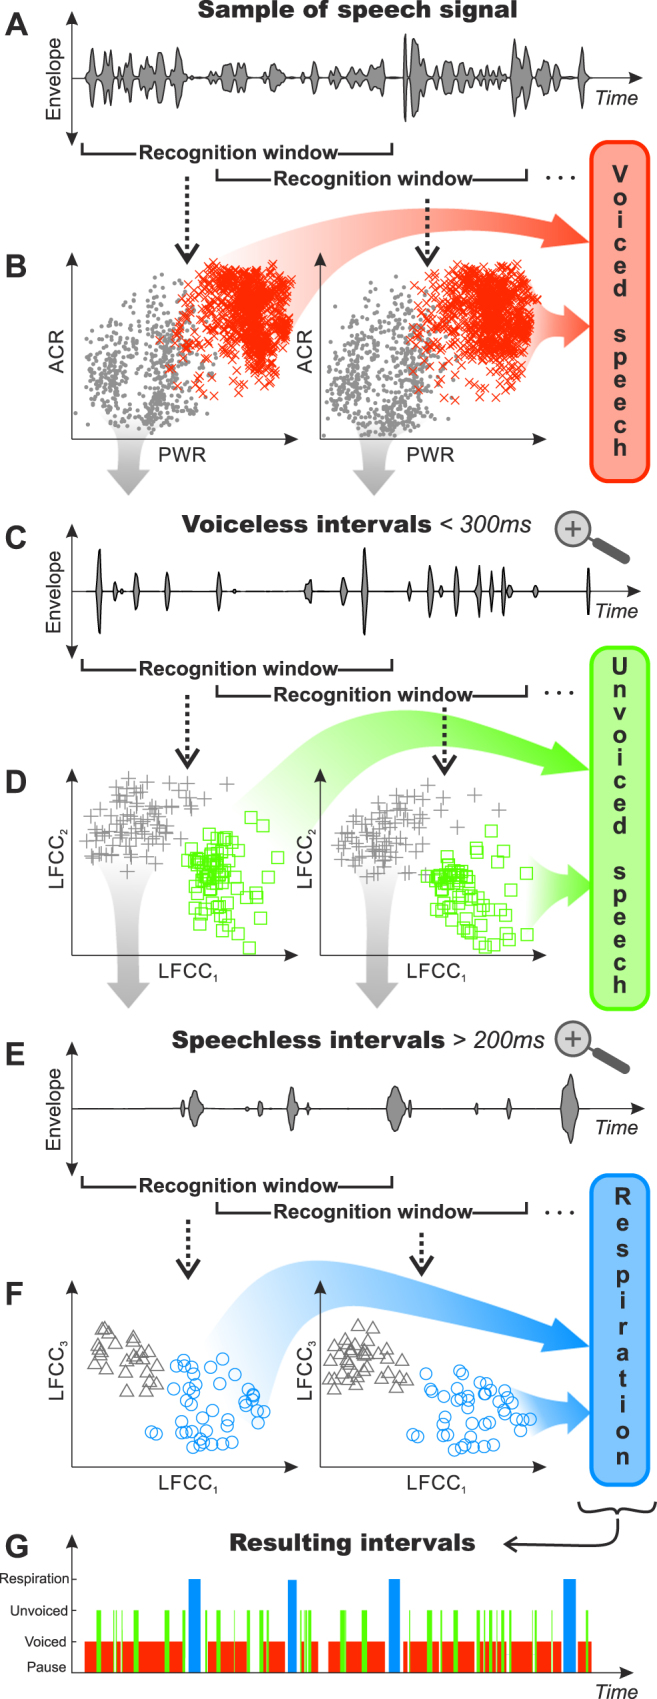
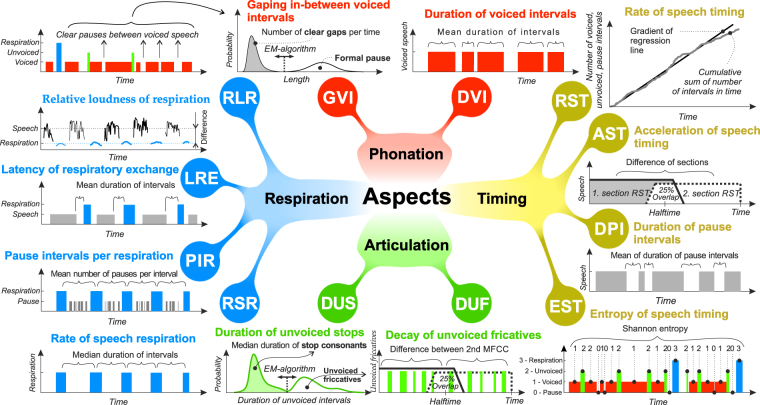
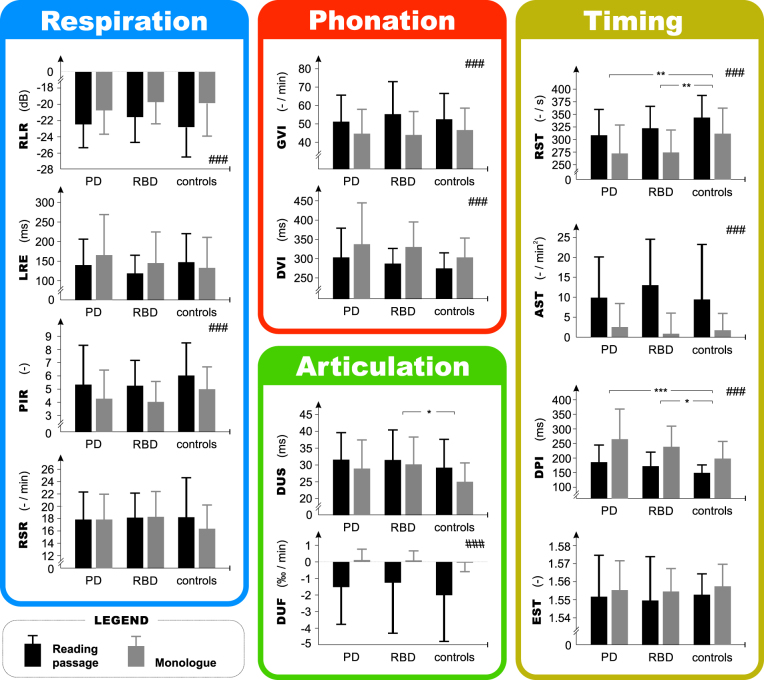
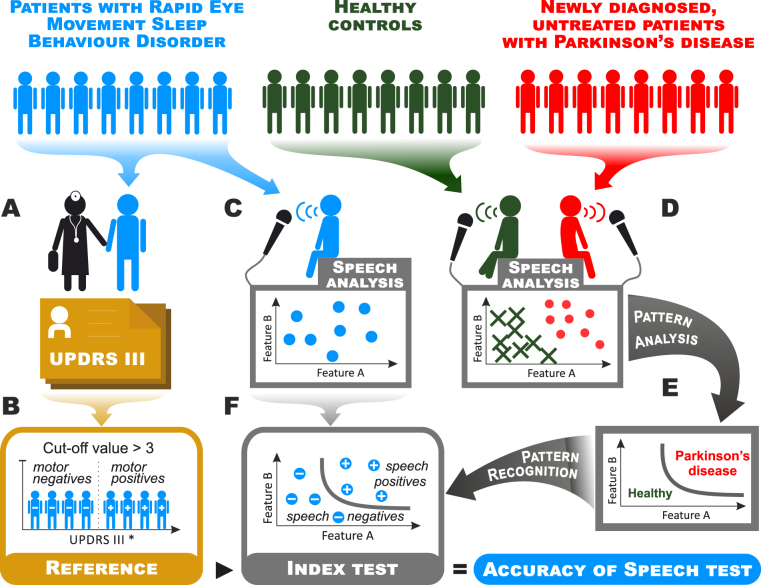
For generations, the evaluation of speech abnormalities in neurodegenerative disorders such as Parkinson’s disease (PD) has been limited to perceptual tests or user-controlled laboratory analysis based upon rather small samples of human vocalizations. Our study introduces a fully automated method that yields significant features related to respiratory deficits, dysphonia, imprecise articulation and dysrhythmia from acoustic microphone data of natural connected speech for predicting early and distinctive patterns of neurodegeneration. We compared speech recordings of 50 subjects with rapid eye movement sleep behaviour disorder (RBD), 30 newly diagnosed, untreated PD patients and 50 healthy controls, and showed that subliminal parkinsonian speech deficits can be reliably captured even in RBD patients, which are at high risk of developing PD or other synucleinopathies. Thus, automated vocal analysis should soon be able to contribute to screening and diagnostic procedures for prodromal parkinsonian neurodegeneration in natural environments.
Overview
The claims and statistics of this paper haven’t been checked yet.
Run the check — free, no account needed. It reads the open-access text and checks the sources it cites.
Integrity signals
Registry
Cites
Statistics
Figures
Verification
Claims the paper makes
The claims and statistics of this paper haven’t been checked yet.
Run the check — free, no account needed. It reads the open-access text and checks the sources it cites.
Claims other papers make about this one
Each is checked against this paper’s own text: does it say what the citing paper says it does?
In the citing paper
“MFCC2 reflects the ratio between vocal tract resonation of the high, and vocal fold vibration of the low, Mel‐frequency bands67; a parameter not specifically scored by MDS‐UPDRS item 2.1.25”
From Evaluation of smartphone‐based testing to generate exploratory outcome measures in a phase 1 Parkinson's disease clinical trial (2018) · cites this paper as [67]
In the citing paper
“Some of these deficits may actually occur preclini cally in each of these disorders. 3,33-36”
From Speech and language markers of neurodegeneration: a call for global equity (2023) · cites this paper as [35]
Self-check
Percentages, sums and reported differences re-computed from the paper’s own numbers.
The self-check needs the paper’s full text.
Citations
Cites
Faul, F., Erdfelder, E., Lang, A.-G., & Buchner, A. (2007) · Behavior Research Methods · doi:10.3758/bf03193146 · Cited by 65,971
Hughes, A. J., Daniel, S. E., Kilford, L., & Lees, A. J. (1992) · Journal of Neurology, Neurosurgery & Psychiatry · doi:10.1136/jnnp.55.3.181 · Cited by 10,378
Speaking: From Intention to Articulation
Levelt, W. J. M. (1989) · doi:10.7551/mitpress/6393.001.0001 · Cited by 4,804
Praat, a system for doing phonetics by computer
Boersma, P. (2002) · UvA-DARE (University of Amsterdam) · Cited by 4,417
Epidemiology of Parkinson's disease
de Lau, L. M., & Breteler, M. M. (2006) · The Lancet Neurology · doi:10.1016/s1474-4422(06)70471-9 · Cited by 4,110
The International Telecommunication Union
Jones, R. W. (2002) · Digest - IEEE Antennas and Propagation Society. International Symposium · doi:10.1109/aps.1997.631791 · Cited by 1,903
MDS research criteria for prodromal Parkinson's disease
Berg, D., Postuma, R. B., Adler, C. H., Bloem, B. R., Chan, P., Dubois, B., Gasser, T., Goetz, C. G., Halliday, G. M., Joseph, L., et al. (2015) · Movement Disorders · doi:10.1002/mds.26431 · Cited by 1,394
Differential diagnostic patterns of dysarthria
Darley, F. L., Aronson, A. E., & Brown, J. R. (1969) · Journal of Speech and Hearing Research · doi:10.1044/jshr.1202.246 · Cited by 1,323
Correlates of linguistic rhythm in the speech signal
Ramus, F., Nespor, M., & Mehler, J. (1999) · Cognition · doi:10.1016/s0010-0277(99)00058-x · Cited by 1,281
Suitability of Dysphonia Measurements for Telemonitoring of Parkinson's DiseasePreprint
Little, M. A., McSharry, P., Hunter, E. J., Spielman, J. L., & Ramig, L. O. (2008) · Nature Precedings · doi:10.1109/tbme.2008.2005954 · Cited by 1,194
Research works printed but not linked: 3
- Duffy, J. R. Motor Speech Disorders: Substrates, Differential Diagnosis and Management, 3rd ed., Mosby, St. Louis (2013).
- Weismer, G. & McNeil, M. Articulatory characteristics of Parkinsonian dysarthria: Segmental and phrase-level timing, spirantization, and glottal-supraglottal coordination. The dysarthrias: Physiology, acoustics, perception, management, College-Hill Press, San Diego 101–130 (1984).
- American Academy of Sleep Medicine. International Classification of Sleep Disorders, Third Edition: Diagnostic and Coding Manual, Westchester, Illinois: American Academy of Sleep Medicine (2014).
Cited by
Sorted by citations
Items 201–300 of 325
Artificial Intelligence‐Powered Acoustic Analysis System for Dysarthria Severity Assessment
Zhang, Z., Shang, X., Yang, L., Ai, W., Wang, J., Wang, H., Wong, S. T. C., Wang, X., & Li, H. (2023) · Advanced Intelligent Systems · doi:10.1002/aisy.202300097 · Cited by 10
Liu, Y., Chu, Y., Lu, Y., Li, Y., Li, S., Jin, C. J., Chen, J., & Wang, X. (2020) · physica status solidi (RRL) - Rapid Research Letters · doi:10.1002/pssr.202000108 · Cited by 8
Parkinson’s Disease Classification Framework Using Vocal Dynamics in Connected Speech
Appakaya, S. B., Pratihar, R., & Sankar, R. T. (2023) · Algorithms · doi:10.3390/a16110509 · Cited by 8
Micropatterned macroporous structures in microfluidic devices for viral separation from whole blood
Surawathanawises, K., Wiedorn, V., & Cheng, X. (2017) · The Analyst · doi:10.1039/c7an00576h · Cited by 8
Казанферович, А. А., & Tychkov, A. Y. (2020) · IEEE Conference of Russian Young Researchers in Electrical and Electronic Engineering · doi:10.1109/eiconrus49466.2020.9039480 · Cited by 8
The 5-HTTLPR polymorphism impacts moral permissibility of impersonal harmful behaviors
Yang, Y., Wang, C., Li, X., Yu, R., Zhang, M., Xue, M., Guo, W., He, L., Gao, X., & Gong, P. (2019) · Social Cognitive and Affective Neuroscience · doi:10.1093/scan/nsz060 · Cited by 8
Actigraphic Screening for Rapid Eye Movement Sleep Behavior DisorderPreprint
Kristián, Š., Dostálová, S., Nepožitek, J., y Losada, V. I. L., Dušek, P., Růžička, E., Šonka, K., & Kemlink, D. (2019) · medRxiv · doi:10.1101/19001867 · Cited by 8
Self-citationFumel, J., Bahuaud, D., Weed, E., Fusaroli, R., & Basirat, A. (2024) · Journal of Speech Language and Hearing Research · doi:10.1044/2024_jslhr-23-00588 · Cited by 7
Digital speech biomarkers can measure acute effects of levodopa in Parkinson’s disease
Sousa, M., Krýže, P., Amstutz, D., Petermann, K., Averna, A., Castelli, M., Magalhães, A. D., Jorge, A., Švihlík, J., Tykalová, T., et al. (2025) · npj Parkinson s Disease · doi:10.1038/s41531-025-01045-5 · Cited by 8
Self-citationКазанферович, А. А., Tychkov, A. Y., & Ageykin, A. V. (2020) · Lecture notes in electrical engineering · doi:10.1007/978-3-030-39225-3_95 · Cited by 7
Švihlík, J., Novotný, M., Tykalová, T., Poláková, K., Brožová, H., Krýže, P., Sousa, M., Krack, P., Tripoliti, E., Růžička, E., et al. (2022) · Journal of Speech Language and Hearing Research · doi:10.1044/2022_jslhr-22-00308 · Cited by 7
Self-citationFriedman, L., Lauber, M. V., Behroozmand, R., Fogerty, D., Kunecki, D., Berry‐Kravis, E., & Klusek, J. (2023) · Experimental Brain Research · doi:10.1007/s00221-023-06653-2 · Cited by 7
A Machine Learning Approach for Early Identification of Prodromal Parkinson’s Disease
Vaish, A. (2024) · Cureus · doi:10.7759/cureus.63240 · Cited by 7
Wireless graphene-enabled wearable temperature sensor
Kovalska, E. O., Baldycheva, A. V., & Somov, A. (2020) · Journal of Physics Conference Series · doi:10.1088/1742-6596/1571/1/012001 · Cited by 7
Vásquez-Correa, J. C., García-Ospina, N., Orozco‐Arroyave, J. R., Cerňak, M., & Nöth, E. (2018) · Lecture notes in computer science · doi:10.1007/978-3-030-00794-2_49 · Cited by 7
The Gustatory System in Insects
Marion‐Poll, F. (2020) · Elsevier eBooks · doi:10.1016/b978-0-12-809324-5.23881-9 · Cited by 7
Automated machine learning for positive-unlabelled learning
Saunders, J. D., & Freitas, A. A. (2025) · Applied Intelligence · doi:10.1007/s10489-025-06706-9 · Cited by 6
Kadiri, S. R., Kodali, M., & Alku, P. (2023) · Interspeech (USB) · doi:10.21437/interspeech.2023-2531 · Cited by 6
Direct Laser Annealing of Surface‐Enhanced Raman Scattering Substrates
Cao, B., Mu, Y., & Zhang, X. (2019) · Advanced Engineering Materials · doi:10.1002/adem.201900779 · Cited by 6
Liu, Z., Wang, Q., Mao, J., Wang, K., Fang, Z., Miao, Q., & Ye, M. (2020) · Journal of Proteomics · doi:10.1016/j.jprot.2020.103738 · Cited by 6
Souto, P. L. G., Carmo, L. S. T., dos Santos, C., Martins, E., Martins, V. M. V., Hatamoto-Zervoudakis, L. K., Murad, A. M., Mehta, Â., Mcmanus, C. M., & Ramos, A. F. (2021) · Tropical Animal Health and Production · doi:10.1007/s11250-020-02536-8 · Cited by 6
Khan, T., Kuznetsova, V., Domínguez-Martín, M. A., Kerfeld, C. A., & Polı́vka, T. (2021) · ChemPhotoChem · doi:10.1002/cptc.202100194 · Cited by 6
ISOPT Clinical Hot Topic Panel Discussion on Ocular Drug Delivery
Kompella, U. B., Domb, A. J., Urtti, A. O., Jayagopal, A., WILSON, C. G., & Tang-Liu, D. D.-S. (2019) · Journal of Ocular Pharmacology and Therapeutics · doi:10.1089/jop.2018.0138 · Cited by 6
Deep Attentive End-to-End Continuous Breath Sensing from Speech
MacIntyre, A. D., Rizos, G., Batliner, A. M., Baird, A., Amiriparian, S., Hamilton, A. F. D. C., & Schuller, B. W. (2020) · Interspeech (USB) · doi:10.21437/interspeech.2020-2832 · Cited by 6
EMD-Based Noise-Robust Method for Speech/Pause Segmentation
Казанферович, А. А., & Tychkov, A. Y. (2021) · International Youth Conference on Radio Electronics, Electrical and Power Engineering (REEPE) · doi:10.1109/reepe51337.2021.9388066 · Cited by 6
Speech Markers of Parkinson’s Disease: Phonological Features and Acoustic Measures
Wayland, R. P., Meyer, R., & Tang, K. (2025) · Brain Sciences · doi:10.3390/brainsci15111162 · Cited by 5
Measurement of speech signal patterns under borderline mental disorders
Казанферович, А. А., Tychkov, A. Y., Kuzmin, A. V., Churakov, P. P., Ageykin, A. V., & Vishnevskaya, G. V. (2017) · Conference of Open Innovations Association (FRUCT) · doi:10.23919/fruct.2017.8250161 · Cited by 5
EFFECT OF AGE AND GENDER ON ARTICULATION OF VOICED AND VOICELESS STOP CONSONANTS IN CZECH
Kaňok, M., & Novotný, M. (2020) · Lékař a technika - Clinician and Technology · doi:10.14311/ctj.2019.3.05 · Cited by 5
Surface morphology features of point contact gas sensors based on Cu-TCNQ compound
Harbuz, D. A., Pospelov, A. P., Гудименко, В. А., Konotop, O. P., Mateychenko, P. V., Kowalska, D. A., Faulques, E., & Камарчук, Г. В. (2021) · Molecular Crystals and Liquid Crystals · doi:10.1080/15421406.2020.1861518 · Cited by 5
Attentional Demand of Motor Speech Encoding: Evidence From Parkinson's Disease
Fournet, M., Chiuvé, S. C., & Laganaro, M. (2022) · Journal of Speech Language and Hearing Research · doi:10.1044/2022_jslhr-22-00096 · Cited by 5
Mo‐O Dual‐Doped Argyrodite Electrolyte Enables Stable All‐Solid‐State Lithium Batteries
Cao, P., Chen, J., Li, J., Yu, H., Lin, J., Tian, Z., Liu, G., & Yao, X. (2025) · Small · doi:10.1002/smll.202501901 · Cited by 5
A method to determine cepstral markers of speech signals under psychogenic disorders
Казанферович, А. А., Tychkov, A. Y., Ageykin, A. V., & Churakov, P. P. (2018) · Ural Symposium on Biomedical Engineering, Radioelectronics and Information Technology (USBEREIT) · doi:10.1109/usbereit.2018.8384568 · Cited by 5
Progress in Thick Film 2G-HTS Development
Majkic, G. (2019) · Springer eBooks · doi:10.1007/978-3-030-23303-7_4 · Cited by 5
Saunders, J. D., & Freitas, A. A. (2022) · Genetic and Evolutionary Computation Conference Companion (GECCO Companion) · doi:10.1145/3520304.3528932 · Cited by 5
Lang, M., Stedman, S.-M., Nettles, J. E., & Griffin, R. K. (2020) · Wetlands · doi:10.1007/s13157-019-01243-x · Cited by 5
Eisen-Enosh, A., Farah, N., Burgansky–Eliash, Z., Maharshak, I., Polat, U., & Mandel, Y. (2020) · Experimental Eye Research · doi:10.1016/j.exer.2020.108290 · Cited by 5
García, A. M., & Orozco‐Arroyave, J. R. (2021) · Movement Disorders · doi:10.1002/mds.28831 · Cited by 5
Chen, X., Wei, P., Chen, T., Ye, X., Ge, J., Tang, Z., Zhu, W., Nie, X., He, D., Liu, M., et al. (2025) · Science China Materials · doi:10.1007/s40843-025-3446-2 · Cited by 4
Selective Polysomnographic Findings in REM Sleep Behavior Disorder (RBD) and Parkinson’s Disease
Cesari, M., & Jennum, P. (2018) · Springer eBooks · doi:10.1007/978-3-319-90152-7_20 · Cited by 4
Fan, T., Ke, Y., Zhang, L., Cai, L., & Li, Z. (2022) · CrystEngComm · doi:10.1039/d2ce00572g · Cited by 4
Kumari, R., & Ramachandran, P. (2023) · Journal of Intelligent & Fuzzy Systems · doi:10.3233/jifs-230183 · Cited by 4
Low Cost Machine Vision for Insect Classification
Brandt, D., Tschaikner, M., Chiaburu, T., Schmidt, H., Schrimpf, I., Stadel, A., Beckers, I. E., & Haußer, F. (2024) · Lecture notes in networks and systems · doi:10.1007/978-3-031-47715-7_2 · Cited by 4
Kumari, R., & Ramachandran, P. (2024) · IETE Journal of Research · doi:10.1080/03772063.2024.2409677 · Cited by 4
Superhydrophilic Bi-methylimidazole for preferred pH-responsive, targeted drug delivery to tumor
Ouyang, R., Xue, W., Cao, P., Sun, Z., Wang, H., Zhang, X., Zhou, S., & Miao, Y. (2025) · Colloids and Surfaces B Biointerfaces · doi:10.1016/j.colsurfb.2025.114701 · Cited by 4
Diagnosis of REM Sleep Behavior Disorder
Stefani, A., Frauscher, B., & Högl, B. (2018) · Springer eBooks · doi:10.1007/978-3-319-90152-7_18 · Cited by 4
Hazlewood, D., Feng, Y., Lu, Q., Wang, J., & Yang, X. (2018) · Physics in Medicine and Biology · doi:10.1088/1361-6560/aadff0 · Cited by 4
A transversal study of fundamental frequency contours in parkinsonian voices
Rodríguez‐Pérez, P., Fraile, R., Escrig, M. G., Sáenz-Lechón, N., Gutiérrez-Arriola, J. M., & Osma-Ruiz, V. (2019) · Biomedical Signal Processing and Control · doi:10.1016/j.bspc.2019.02.021 · Cited by 4
A Knowledge Base Data Mining based on Parkinson's Disease
Hassan, M. R., Kadir, S. K. O., Islam, M. A., Abujar, S., Zannat, R., & Ohidujjaman, O. (2019) · International Conference on System Modeling & Advancement in Research Trends (SMART) · doi:10.1109/smart46866.2019.9117450 · Cited by 4
Rheological properties of MoSi2-NbSi2 powders obtained by SHS-method and solid-phase mixture
Титов, Д. Д., Miloserdov, P. A., Лысенков, А. С., Frolova, M. G., Gumennikova, E. A., & Kargin, Y. F. (2019) · IOP Conference Series Materials Science and Engineering · doi:10.1088/1757-899x/525/1/012077 · Cited by 4
Whitfield, J. A. (2019) · Perspectives of the ASHA Special Interest Groups · doi:10.1044/2019_pers-sig19-2018-0004 · Cited by 4
Speech/Pause Segmentation Method Based on Teager Energy Operator and Short-Time Energy Analysis
Казанферович, А. А. (2021) · Ural Symposium on Biomedical Engineering, Radioelectronics and Information Technology (USBEREIT) · doi:10.1109/usbereit51232.2021.9455103 · Cited by 4
MARTA: a model for the automatic phonemic grouping of the parkinsonian speechPreprint
Guerrero-López, A., Arias-Londoño, J. D., Shattuck‐Hufnagel, S., & Godino-Llorente, J. I. (2024) · doi:10.36227/techrxiv.171084943.31044695/v1 · Cited by 4
Uncovering variation in social insect communication
Cini, A., Casacci, L. P., & Nehring, V. (2021) · Current Zoology · doi:10.1093/cz/zoab065 · Cited by 3
Variability in Vowel Space in Parkinson's Disease: Associations With Cognitive and Motor Impairment
DeSilva, G. S., Upadhyay, P., Manxhari, M., Gopal, D., & Smith, K. M. (2024) · Journal of Speech Language and Hearing Research · doi:10.1044/2024_jslhr-24-00008 · Cited by 3
Detection of breath sounds in speech: A deep learning approach
Arafath, K. M. I. Y., & Routray, A. (2024) · Engineering Applications of Artificial Intelligence · doi:10.1016/j.engappai.2024.109808 · Cited by 3
Computer audition for healthcare: A survey on speech analysis
Qian, K., Zhao, Z., Tan, Y., Zhang, W., Cho, M., Zhu, C., Tian, F., Hu, B., Yamamoto, Y., & Schuller, B. W. (2025) · AI Open · doi:10.1016/j.aiopen.2025.10.001 · Cited by 3
Zhong, Y., Lü, X., Deng, Z., Lu, Z., & Fu, M. (2021) · BMC Plant Biology · doi:10.1186/s12870-021-02832-x · Cited by 3
Enhancement of Speech Signal Segmentation Using Teager Energy Operator
Казанферович, А. А. (2021) · International Conference on Digital Signal Processing and its Applications (DSPA) · doi:10.1109/dspa51283.2021.9535805 · Cited by 3
Climate Change on Plant Community Structure and Ecosystem Function
Singh, R., & Raj, M. K. (2021) · Soil biology · doi:10.1007/978-3-030-76863-8_17 · Cited by 3
Pinto, S., Cardoso, R., Atkinson-Clément, C., Guimarães, I., Sadat, J., Santos, H., Mercier, C., Carvalho, J., Cuartero, M., Oliveira, P., et al. (2024) · Journal of Speech Language and Hearing Research · doi:10.1044/2024_jslhr-23-00525 · Cited by 6
The transcriptomic and proteomic changes of Hannaella sinensis in response to patulin stress
Yang, Q., Ji, Q., Zhang, X., Dhanasekaran, S., Ma, J., Li, Y., & Zhang, H. (2024) · New Zealand Journal of Crop and Horticultural Science · doi:10.1080/01140671.2024.2426659 · Cited by 3
Hypoxia and Matrix Manipulation for Vascular Engineering
Blatchley, M. R., Abaci, H. E., Hanjaya‐Putra, D., & Gerecht, S. (2018) · Biological and medical physics, biomedical engineering · doi:10.1007/978-3-319-99319-5_4 · Cited by 3
Cho, W., Han, E., Son, D. C., & Lee, J.-H. (2020) · Mitochondrial DNA Part B · doi:10.1080/23802359.2020.1806755 · Cited by 3
Cell specific variation in viability in suspension in in vitro Poiseuille flow conditions
Connolly, S. A., Newport, D. T., & McGourty, K. (2021) · Scientific Reports · doi:10.1038/s41598-021-91865-1 · Cited by 3
EMD-Based Method to Improve the Efficiency of Speech/Pause Segmentation
Казанферович, А. А., & Tychkov, A. Y. (2021) · International Siberian Conference on Control and Communications · doi:10.1109/sibcon50419.2021.9438905 · Cited by 3
Self-supervised learning for early detection of neurodegenerative diseases with small data
Jiang, H. (2023) · DR-NTU (Nanyang Technological University) · doi:10.32657/10356/166402 · Cited by 3
Ham, H., Jin, B., Cha, K. S., Woo, K. A., Shin, J. H., & Kim, H. (2025) · Journal of Neurology · doi:10.1007/s00415-025-13352-1 · Cited by 2
Vázquez‐Mojena, Y., Rodríguez‐Labrada, R., Córdova-Rodríguez, Y., Domínguez-Barrios, Y., Zamora-Loyarte, D. I., Fernández-Herrera, M. E., Fuentes, N. P., Robinson‐Agramonte, M. D. L. Á., & Velázquez‐Pérez, L. (2025) · The Cerebellum · doi:10.1007/s12311-025-01917-9 · Cited by 2
Ren, Y., Lou, J., Li, X., Ho, J. C., Jiang, X., & Bhavani, S. V. (2023) · PubMed · Cited by 2
Xu, Z., Li, L., Liu, X., Liang, X., Yang, M., Chen, Y., Han, X., Wang, J., Tang, Y., Zhang, M., et al. (2025) · Journal of Voice · doi:10.1016/j.jvoice.2025.05.024 · Cited by 2
The sintering process difference of MoSi2, NbSi2 and (Mo1-x,Nbx)Si2 solid solution
Титов, Д. Д., Miloserdov, P. A., Frolova, M. G., Лысенков, А. С., Kargin, Y. F., Petrakova, N. V., & Ашмарин, А. А. (2018) · Journal of Physics Conference Series · doi:10.1088/1742-6596/1134/1/012058 · Cited by 2
X-ray diffraction method to identify epithelial to mesenchymal transition in breast cancer tissue
Alsharif, A. M., Sani, S. F. A., & Moradi, F. (2020) · IOP Conference Series Materials Science and Engineering · doi:10.1088/1757-899x/785/1/012044 · Cited by 2
Krýže, P., Tykalová, T., Růžička, E., & Rusz, J. (2021) · The Journal of the Acoustical Society of America · doi:10.1121/10.0005050 · Cited by 2
Self-citationParkinson’s Disease Identification using Deep Neural Network with RESNET50
Anila, M., & Pradeepini, G. (2022) · International Journal of Advanced Computer Science and Applications · doi:10.14569/ijacsa.2022.0131156 · Cited by 2
Boogers, A., Peeters, J., Bogaert, T. V., Rusz, J., Bogaert-Miclaus, C., Loret, G., Vloo, P. D., Vandenberghe, W., Nuttin, B., & Laughlin, M. M. (2023) · Parkinsonism & Related Disorders · doi:10.1016/j.parkreldis.2023.105435 · Cited by 2
Self-citationKumari, R., & Ramachandran, P. (2023) · Lecture notes in electrical engineering · doi:10.1007/978-981-19-8338-2_18 · Cited by 2
Parkinson's Disease Diagnosis Using Voice Features and Effective Machine Learning Methods
Goyal, S., Kaur, A., Batra, N., & Chauhan, R. (2024) · Advances in medical technologies and clinical practice book series · doi:10.4018/979-8-3693-1115-8.ch006 · Cited by 2
Speech Disorders in Parkinsonism
Skripkina, N. A., & Arefyeva, A. P. (2021) · Neuroscience and Behavioral Physiology · doi:10.1007/s11055-021-01143-w · Cited by 2
Revankar, G. S., Salian, A. C., Ozono, T., Maki, S., Kanemoto, H., Shigenobu, K., Nishio, Y., Yoshiyama, K., Yamamoto, Y., Revankar, S. S., et al. (2025) · medRxiv · doi:10.1101/2025.03.31.25324871 · Cited by 2
Longitudinal Evaluation of Dysarthria Progression in Patients with Parkinson’s Disease
Vásquez-Barrientos, W. A., Escobar-Grisales, D., Ríos-Urrego, C. D., & Orozco‐Arroyave, J. R. (2026) · Diagnostics · doi:10.3390/diagnostics16050683 · Cited by 1
Nurhasan, A. A., & Kasprowski, P. (2026) · Applied Sciences · doi:10.3390/app16052548 · Cited by 1
Jinming, X., Kathiresan, T., Siddiqui, A., & Vogel, A. P. (2026) · Future Neurology · doi:10.1080/14796708.2026.2692075 · Cited by 1
Biometrické údaje a jejich právní režim
Matejka, J., Krausová, A., & Güttler, V. (2018) · Revue pro právo a technologie · doi:10.5817/rpt2018-1-5 · Cited by 1
Emotion Detection During Human-Robots Interaction in Visual Reality Environment
Yang, B., Sun, B., Zhang, Q., Wang, Y., Li, Y., Yang, J., & Gu, L. (2020) · Communications in computer and information science · doi:10.1007/978-981-33-4932-2_6 · Cited by 1
A Novel Approach to Speech Signal Segmentation Based on Time-Frequency Analysis
Казанферович, А. А., Tychkov, A. Y., Churakov, P. P., & Сергеевич, Д. Д. (2022) · Scientific School Dynamics of Complex Networks and their Applications (DCNA) · doi:10.1109/dcna56428.2022.9923223 · Cited by 1
Evaluating a New Genetic Algorithm for Automated Machine Learning in Positive-Unlabelled Learning
Saunders, J. D., & Freitas, A. A. (2023) · Lecture notes in computer science · doi:10.1007/978-3-031-42616-2_4 · Cited by 1
Tykalová, T., Rusz, J., Klempíř, J., & Pellecchia, M. T. (2025) · Journal of Neural Transmission · doi:10.1007/s00702-025-03016-9 · Cited by 1
Self-citationDisorders of language processes in patients with Parkinson's disease without dementia
Cséfalvay, Z., & Jánošková, P. (2018) · Neurologie pro praxi · doi:10.36290/neu.2018.131 · Cited by 1
Казанферович, А. А., Tychkov, A. Y., & Ageykin, A. V. (2019) · International Multi-Conference on Engineering, Computer and Information Sciences (SIBIRCON) · doi:10.1109/sibircon48586.2019.8958212 · Cited by 1
Казанферович, А. А., Tychkov, A. Y., & Churakov, P. P. (2021) · IEEE Conference of Russian Young Researchers in Electrical and Electronic Engineering · doi:10.1109/elconrus51938.2021.9396561 · Cited by 1
Living in mixed species groups promotes predator learning in degraded habitats
Chivers, D. P., McCormick, M. I., Fakan, E. P., Barry, R. P., & Ferrari, M. C. O. (2021) · Scientific Reports · doi:10.1038/s41598-021-98224-0 · Cited by 2
Off-Chip/On-Foil Passive and Active Components
Elsobky, M. (2022) · Springer theses · doi:10.1007/978-3-030-97726-9_3 · Cited by 1
Effects of Neuroacoustic Stimulation on Two Study Cases of Parkinson’s Disease Dysarthria
Gómez‐Vilda, P., Gómez-Rodellar, A., Alonso, D. P., & Álvarez-Marquina, A. (2022) · Lecture notes in computer science · doi:10.1007/978-3-031-06242-1_21 · Cited by 1
Insulin Producing Cells Monitor the Cold and Compensate the Cold-Induced Sleep in DrosophilaPreprint
Zhang, X. O., Cui, X., & Zhu, D. (2018) · bioRxiv (Cold Spring Harbor Laboratory) · doi:10.1101/419200 · Cited by 1
PCR, PLS, or OPLS Evaluation of different regression techniques for hypothesis generationPreprint
Ahuja, A. (2021) · Preprints.org · doi:10.20944/preprints202111.0549.v1 · Cited by 1
Commodity Sensors, Physiological Signals, Research Opportunities, and Practical Issues
Stanford, M. W., & Stanford, V. M. (2019) · IEEE Signal Processing in Medicine and Biology Symposium · doi:10.1109/spmb47826.2019.9037855
Parkinsonism-associated speech disorders
Skripkina, N. A., & Arefyeva, A. P. (2020) · S S Korsakov Journal of Neurology and Psychiatry · doi:10.17116/jnevro202012010261
学, 木., & 瑞坤, 徐. (1988) · Institutional Repositories DataBase (IRDB)
Metadata
- Authors
- Hlavnička, J., Čmejla, R., Tykalová, T., Šonka, K., Růžička, E., & Rusz, J.
- Affiliations
- Czech Technical University in Prague (CZ)
- Charles University (CZ)
- Corresponding author
- Rusz, Jan
- Venue
- Scientific Reports
- Published
- 2017-02-02
- Volume
- 7
- Issue
- 1
- Pages
- 12-12
- ISSN
- 2045-2322 (ISSN-L)
- PMC
- PMC5428345
- OpenAlex
- W2580210409
- Cited by
- 326
- References
- 37
- Citations by year
- 2026: 11 · 2025: 25 · 2024: 25 · 2023: 30 · 2022: 28 · 2021: 71 · 2020: 44 · 2019: 46 · 2018: 33 · 2017: 11
- FWCI
- 27.12
- Type
- journal article
- Language
- en
- Open access
- gold
- doi.org
- Locations
- Scientific Reports (publishedVersion, cc-by)
- PubMed Central (publishedVersion, cc-by)
- PubMed (publishedVersion)
- DOAJ (DOAJ: Directory of Open Access Journals) (submittedVersion, cc-by-sa)
- Cvut DSpace (Czech Technical University) (submittedVersion, cc-by)
- Funders
- Grantová Agentura České Republiky (GA16-07879S)
- Ministerstvo Zdravotnictví Ceské Republiky (16-28914A, 15 – 28038A)
- Topics
- Health Sciences › Health Professions › Speech and Hearing › Voice and Speech Disorders
- Health Sciences › Medicine › Clinical Neurology › Parkinson's Disease Mechanisms and Treatments
- Social Sciences › Psychology › Experimental and Cognitive Psychology › Phonetics and Phonology Research
- Keywords
- Parkinson's disease, rapid eye movement sleep behavior disorder, automated speech analysis, acoustic biomarkers, early diagnosis, prodromal neurodegeneration, dysphonia, cardiac arrhythmias, synucleinopathies, speech screening
- MeSH terms
- Adult, Aged, Aged, 80 and over, Articulation Disorders, Female, Humans, Male, Middle Aged, Parkinson Disease, Pattern Recognition, Automated, Respiration, Biomarkers, REM Sleep Behavior Disorder, Dysphonia
About these checks
Registry, retraction, Cites and statistics results are computed, not judged, with one exception: a printed reference that no index lists is read once by a model before it counts as a citation error. Claims are extracted by a model and kept only when their quote appears verbatim in the text; each cited source is then checked, with a model’s help, for whether it says what the claim relies on. Those verdicts can be wrong — read the claim’s quote and the cited source before relying on one.
Statistics and arithmetic are recomputed, not judged.
Confidence bands are shown only for fields calibrated on our annotated test set. None is calibrated yet, so no band is shown.
What counts as a claim ›How we measure confidence ›How we check this ›
Are you an author, or do you see a problem with this page? Request a review
