

The DOI matches its Crossref record; 37 of the 37 references it cites were found in a registry or an index.
Rumen Fluid Metabolomics Analysis Associated with Feed Efficiency on Crossbred Steers
Open accessAbstract
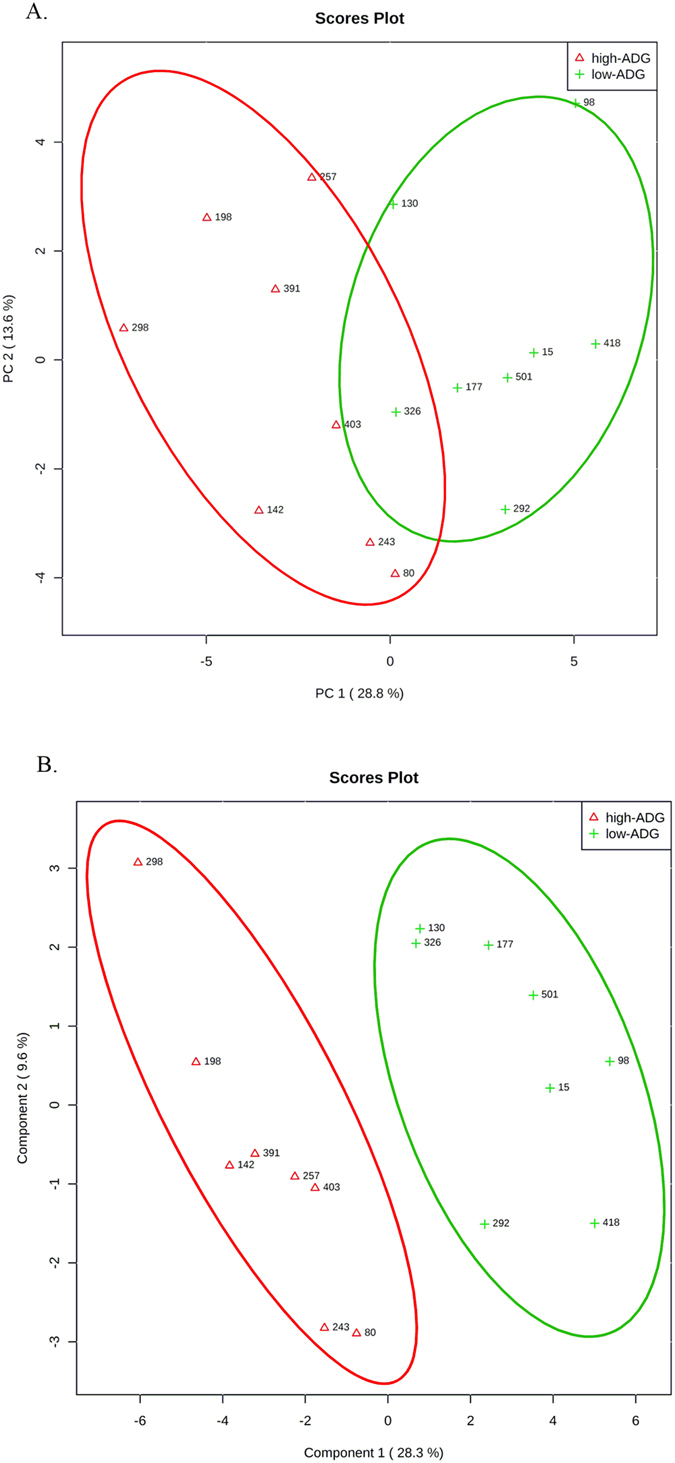
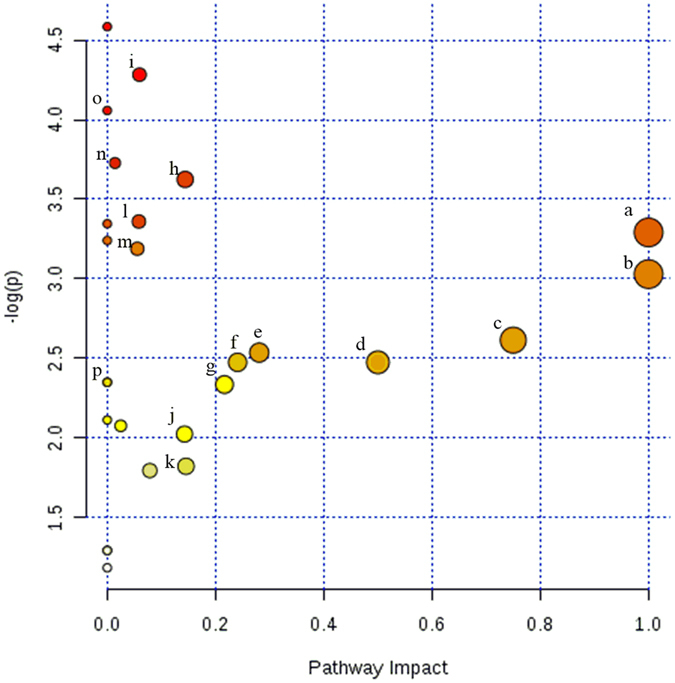
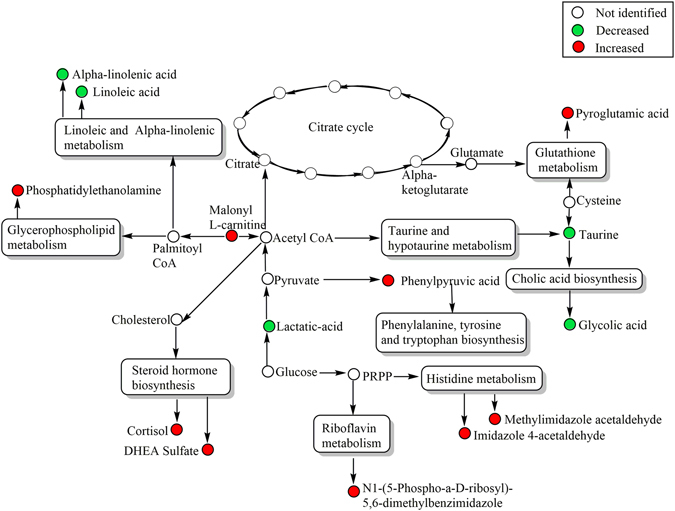
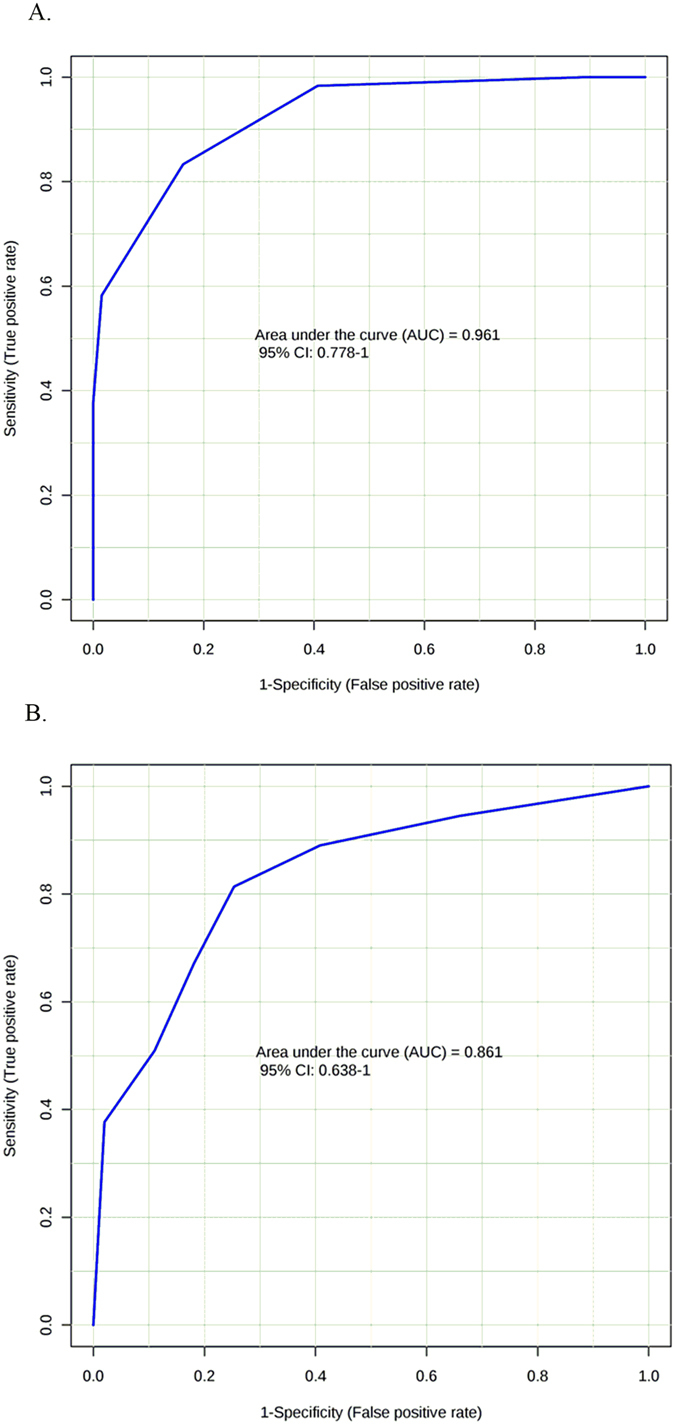
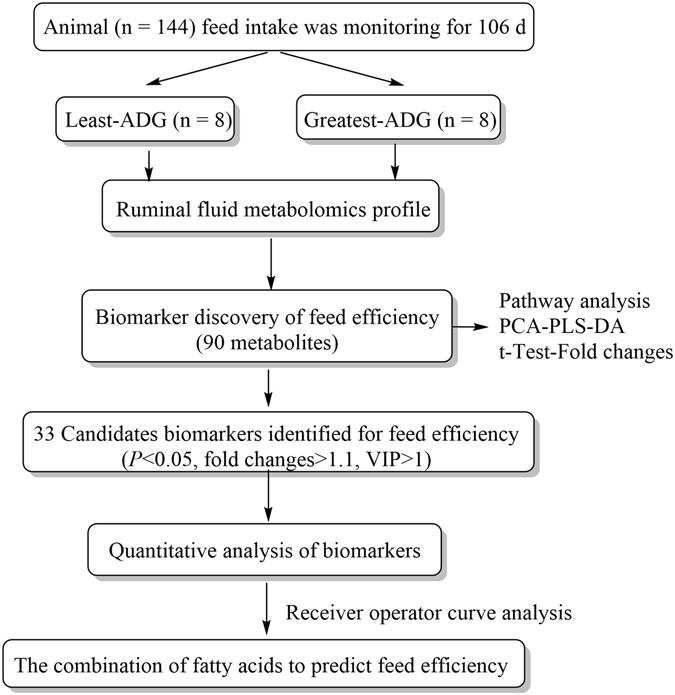
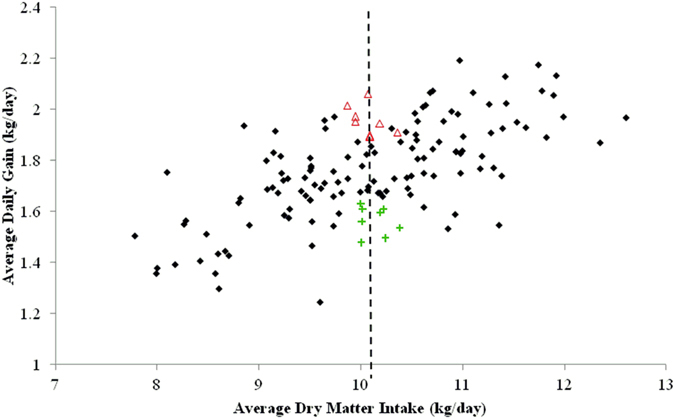
The rumen has a central role in the efficiency of digestion in ruminants. To identify potential differences in rumen function that lead to differences in average daily gain (ADG), rumen fluid metabolomic analysis by LC-MS and multivariate/univariate statistical analysis were used to identify differences in rumen metabolites. Individual feed intake and body-weight was measured on 144 steers during 105 d on a high concentrate ration. Eight steers with the greatest ADG and 8 steers with the least-ADG with dry matter intake near the population average were selected. Blood and rumen fluid was collected from the 16 steers 26 d before slaughter and at slaughter, respectively. As a result of the metabolomics analysis of rumen fluid, 33 metabolites differed between the ADG groups based on t-test, fold changes and partial least square discriminant analysis. These metabolites were primarily involved in linoleic and alpha-linolenic metabolism (impact-value 1.0 and 0.75, respectively; P < 0.05); both pathways were down-regulated in the greatest-ADG compared with least-ADG group. Ruminal biohydrogenation might be associated with the overall animal production. The fatty acids were quantified in rumen and plasma using targeted MS to validate and evaluate the simple combination of metabolites that effectively predict ADG.
Overview
The claims and statistics of this paper haven’t been checked yet.
Run the check — free, no account needed. It reads the open-access text and checks the sources it cites.
Integrity signals
Registry
Cites
Statistics
Figures
Verification
Claims the paper makes
The claims and statistics of this paper haven’t been checked yet.
Run the check — free, no account needed. It reads the open-access text and checks the sources it cites.
Claims other papers make about this one
Each is checked against this paper’s own text: does it say what the citing paper says it does?
In the citing paper
“Recently, Artegoitia et al. (2017) reported 33 metabolites differing in cattle having high or low average daily gain.”
From Addressing global ruminant agricultural challenges through understanding the rumen microbiome: past, present, and future (2018) · cites this paper as Artegoitia et al., 2017
Self-check
Percentages, sums and reported differences re-computed from the paper’s own numbers.
The self-check needs the paper’s full text.
Citations
Cites
MetaboAnalyst 3.0—making metabolomics more meaningful
Xia, J., Sinelnikov, I. V., Han, B., & Wishart, D. S. (2015) · Nucleic Acids Research · doi:10.1093/nar/gkv380 · Cited by 2,680
MetaboAnalyst: a web server for metabolomic data analysis and interpretation
Xia, J., Psychogios, N., Young, N., & Wishart, D. S. (2009) · Nucleic Acids Research · doi:10.1093/nar/gkp356 · Cited by 2,238
Global metabolic profiling of animal and human tissues via UPLC-MS
Want, E. J., Masson, P., Michopoulos, F., Wilson, I. D., Theodoridis, G. A., Plumb, R. S., Shockcor, J. P., Loftus, N. J., Holmes, E. C., & Nicholson, J. K. (2012) · Nature Protocols · doi:10.1038/nprot.2012.135 · Cited by 1,647
Xia, J., & Wishart, D. S. (2011) · Nature Protocols · doi:10.1038/nprot.2011.319 · Cited by 1,332
Jenkins, T. C. (1993) · Journal of Dairy Science · doi:10.3168/jds.s0022-0302(93)77727-9 · Cited by 1,241
MetaboAnalyst 2.0--a comprehensive server for metabolomic data analysis
Xia, J., Mandal, R., Sinelnikov, I., Broadhurst, D., & Wishart, D. S. (2012) · Nucleic Acids Research · doi:10.1093/nar/gks374 · Cited by 1,146
Translational biomarker discovery in clinical metabolomics: an introductory tutorial
Xia, J., Broadhurst, D., Wilson, M., & Wishart, D. S. (2012) · Metabolomics · doi:10.1007/s11306-012-0482-9 · Cited by 976
Ruminal Acidosis in Beef Cattle: The Current Microbiological and Nutritional Outlook
Nagaraja, T. G., & Titgemeyer, E. C. (2007) · Journal of Dairy Science · doi:10.3168/jds.2006-478 · Cited by 884
Specific microbiome-dependent mechanisms underlie the energy harvest efficiency of ruminants.
Shabat, S. K. B., Sasson, G., Doron-Faigenboim, A., Durman, T., Yaacoby, S., Berg Miller, M. E., White, B. A., Shterzer, N., & Mizrahi, I. (2016) · The ISME Journal · doi:10.1038/ismej.2016.62 · Cited by 823
Potential role of the bovine rumen microbiome in modulating milk composition and feed efficiency
Jami, E., White, B. A., & Mizrahi, I. (2014) · PLoS ONE · doi:10.1371/journal.pone.0085423 · Cited by 588
Cited by
Sorted by citations
Items 101–124 of 124
Xu, S.-Y., Feng, X.-R., Zhao, W., YanLiang, B., Diao, Q.-Y., & Tu, Y. (2024) · Figshare · doi:10.6084/m9.figshare.26751493
Xu, S.-Y., Feng, X.-R., Zhao, W., YanLiang, B., Diao, Q.-Y., & Tu, Y. (2024) · Figshare · doi:10.6084/m9.figshare.26751485
Xu, S.-Y., Feng, X.-R., Zhao, W., Bi, Y.-L., Diao, Q.-Y., & Tu, Y. (2024) · Figshare · doi:10.6084/m9.figshare.26751499
Xu, S.-Y., Feng, X.-R., Zhao, W., YanLiang, B., Diao, Q.-Y., & Tu, Y. (2024) · Figshare · doi:10.6084/m9.figshare.26751479
Xu, S.-Y., Feng, X.-R., Zhao, W., YanLiang, B., Diao, Q.-Y., & Tu, Y. (2024) · Figshare · doi:10.6084/m9.figshare.26751520
Xu, S.-Y., Feng, X.-R., Zhao, W., YanLiang, B., Diao, Q.-Y., & Tu, Y. (2024) · Figshare · doi:10.6084/m9.figshare.26751508
Xu, S.-Y., Feng, X.-R., Zhao, W., Bi, Y.-L., Diao, Q.-Y., & Tu, Y. (2024) · Figshare · doi:10.6084/m9.figshare.26751488
Xu, S.-Y., Feng, X.-R., Zhao, W., Bi, Y.-L., Diao, Q.-Y., & Tu, Y. (2024) · Figshare · doi:10.6084/m9.figshare.26751491
Xu, S.-Y., Feng, X.-R., Zhao, W., Bi, Y.-L., Diao, Q.-Y., & Tu, Y. (2024) · Figshare · doi:10.6084/m9.figshare.26751517
Xu, S.-Y., Feng, X.-R., Zhao, W., Bi, Y.-L., Diao, Q.-Y., & Tu, Y. (2024) · Figshare · doi:10.6084/m9.figshare.26751529
Xu, S.-Y., Feng, X.-R., Zhao, W., YanLiang, B., Diao, Q.-Y., & Tu, Y. (2024) · Figshare · doi:10.6084/m9.figshare.26751476
Xu, S.-Y., Feng, X.-R., Zhao, W., YanLiang, B., Diao, Q.-Y., & Tu, Y. (2024) · Figshare · doi:10.6084/m9.figshare.26751511
Xu, S.-Y., Feng, X.-R., Zhao, W., YanLiang, B., Diao, Q.-Y., & Tu, Y. (2024) · Figshare · doi:10.6084/m9.figshare.26751505
Xu, S.-Y., Feng, X.-R., Zhao, W., Bi, Y.-L., Diao, Q.-Y., & Tu, Y. (2024) · Figshare · doi:10.6084/m9.figshare.26751514
Xu, S.-Y., Feng, X.-R., Zhao, W., YanLiang, B., Diao, Q.-Y., & Tu, Y. (2024) · Figshare · doi:10.6084/m9.figshare.26751523
Xu, S.-Y., Feng, X.-R., Zhao, W., YanLiang, B., Diao, Q.-Y., & Tu, Y. (2024) · Figshare · doi:10.6084/m9.figshare.26751526
Xu, S.-Y., Feng, X.-R., Zhao, W., YanLiang, B., Diao, Q.-Y., & Tu, Y. (2024) · Figshare · doi:10.6084/m9.figshare.26751473
Shengyang, X. U., Feng, X.-R., Zhao, W., YanLiang, B., Diao, Q.-Y., & Tu, Y. (2024) · Figshare · doi:10.6084/m9.figshare.26751502
Lin, X., Zhao, W., Wang, C., Ma, Y., Tian, J., Yang, L., Ma, L., Jiang, Q., Chen, Y., Tian, X., et al. (2026) · Research in Veterinary Science · doi:10.1016/j.rvsc.2026.106092 · Cited by 1
del Barrio, E., Baila, C., Fonseca, P. A. D. S., Toral, P. G., Frutos, P., & Hervás, G. (2026) · Animals · doi:10.3390/ani16030426
Fecal metabolite biomarkers for predicting residual feed intake in Nellore bulls
de Oliveira, M. D., Malheiros, J. M., Ligori, V. A., Silva, P. F., Domínguez-Castaño, P., Colnago, L. A., & Silva, J. A. I. V. (2026) · Animal Feed Science and Technology · doi:10.1016/j.anifeedsci.2026.116775
Bao, J., Li, H., Jiang, K., Xu, J., Wu, Y., Ji, W., Li, S., Qi, B., & Niu, H. (2026) · Animals · doi:10.3390/ani16193052
Errico, M., Catellani, A., Froldi, F., Moschini, M., Rocchetti, G., & Gallo, A. (2026) · Italian Journal of Animal Science · doi:10.1080/1828051x.2026.2745959
Metadata
- Authors
- Artegoitia, V. M., Foote, A. P., Lewis, R. M., & Freetly, H. C.
- Affiliations
- University of Nebraska–Lincoln (US)
- Roman L. Hruska U.S. Meat Animal Research Center (US)
- Corresponding author
- Freetly, Harvey C.
- Venue
- Scientific Reports
- Published
- 2017-06-06
- Volume
- 7
- Issue
- 1
- Pages
- 2864-2864
- ISSN
- 2045-2322 (ISSN-L)
- PMC
- PMC5460109
- OpenAlex
- W2553397641
- Cited by
- 123
- References
- 37
- Citations by year
- 2026: 7 · 2025: 4 · 2024: 32 · 2023: 15 · 2022: 15 · 2021: 16 · 2020: 15 · 2019: 7 · 2018: 11
- FWCI
- 15.70
- Type
- journal article
- Language
- en
- Open access
- gold
- doi.org
- Locations
- Scientific Reports (publishedVersion, cc-by)
- Europe PMC (PubMed Central) (publishedVersion, other-oa)
- PubMed Central (publishedVersion, cc-by)
- PubMed (publishedVersion)
- Lincoln (University of Nebraska) (submittedVersion)
- Lincoln (University of Nebraska) (submittedVersion, cc-by)
- DOAJ (DOAJ: Directory of Open Access Journals) (submittedVersion, cc-by-sa)
- Funders
- U.S. Department of Agriculture
- Topics
- Life Sciences › Agricultural and Biological Sciences › Animal Science and Zoology › Ruminant Nutrition and Digestive Physiology
- Life Sciences › Agricultural and Biological Sciences › Animal Science and Zoology › Animal Nutrition and Physiology
- Life Sciences › Biochemistry, Genetics and Molecular Biology › Molecular Biology › Metabolomics and Mass Spectrometry Studies
- Keywords
- feed efficiency, average daily gain, crossbred steers, high-concentrate diet, linoleic acid metabolism, alpha-linolenic acid metabolism, ruminal biohydrogenation, fatty acids, rumen metabolites, growth performance prediction
- MeSH terms
- Animals, Animal Feed, Breeding, Cattle, Crosses, Genetic, Fatty Acids, ROC Curve, Rumen, Extracellular Fluid, Metabolic Networks and Pathways, Metabolomics, Metabolome
About these checks
Registry, retraction, Cites and statistics results are computed, not judged, with one exception: a printed reference that no index lists is read once by a model before it counts as a citation error. Claims are extracted by a model and kept only when their quote appears verbatim in the text; each cited source is then checked, with a model’s help, for whether it says what the claim relies on. Those verdicts can be wrong — read the claim’s quote and the cited source before relying on one.
Statistics and arithmetic are recomputed, not judged.
Confidence bands are shown only for fields calibrated on our annotated test set. None is calibrated yet, so no band is shown.
What counts as a claim ›How we measure confidence ›How we check this ›
Are you an author, or do you see a problem with this page? Request a review
