

The DOI matches its Crossref record; 46 of the 46 references it cites were found in a registry or an index.
Systematic analysis of gene expression patterns associated with postmortem interval in human tissues
Open accessAbstract
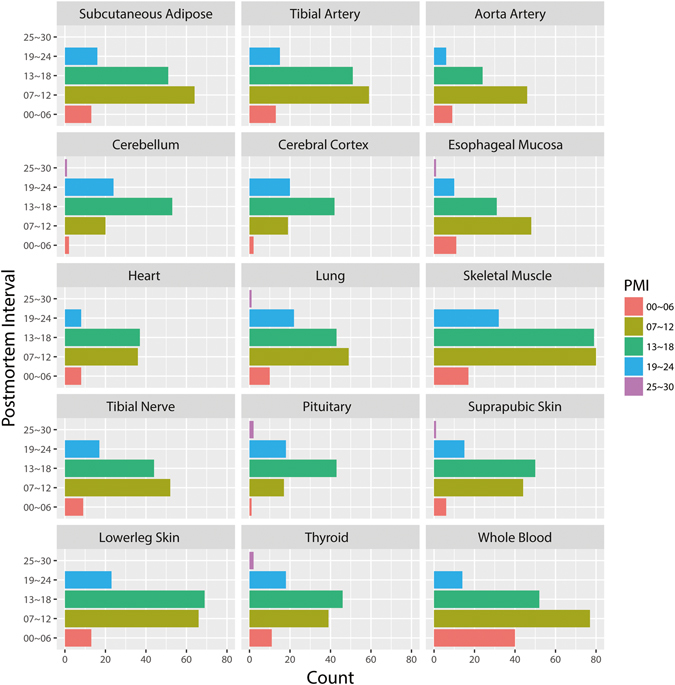
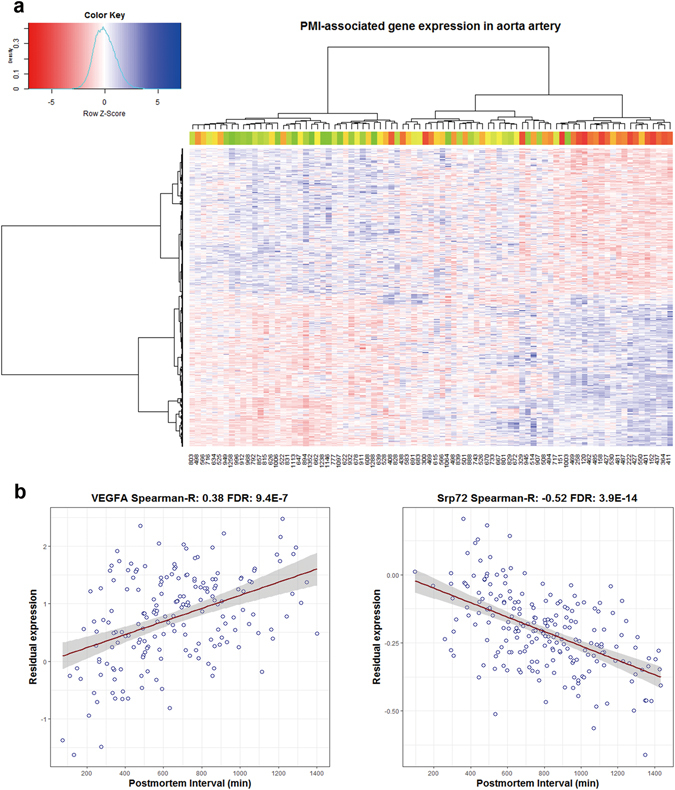
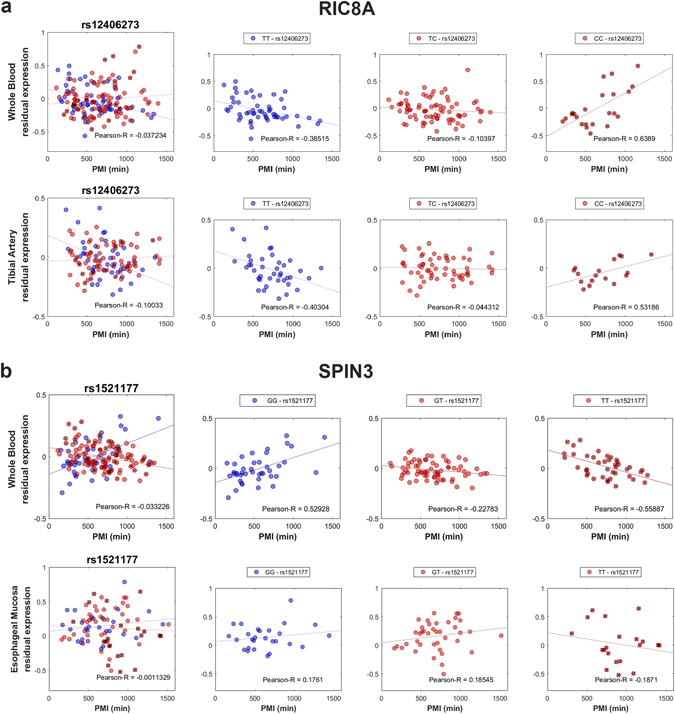
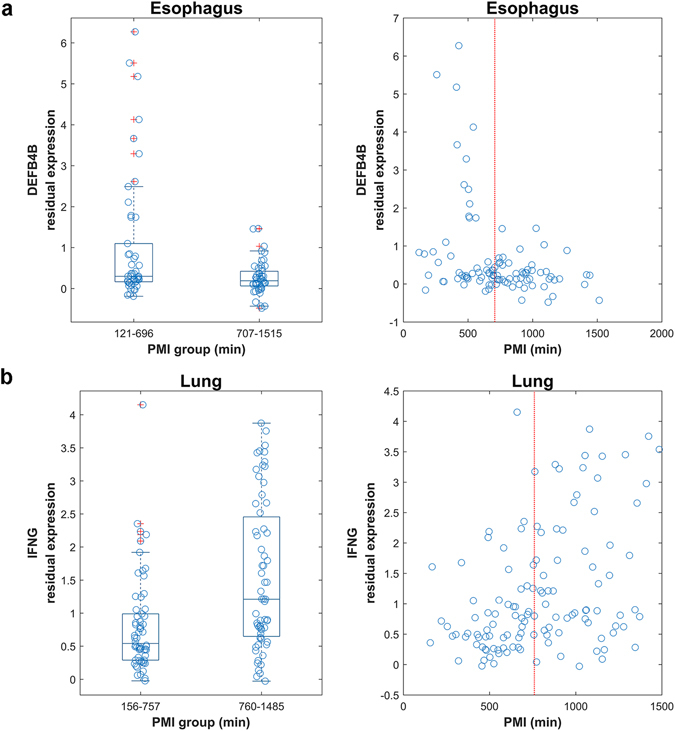
Postmortem mRNA degradation is considered to be the major concern in gene expression research utilizing human postmortem tissues. A key factor in this process is the postmortem interval (PMI), which is defined as the interval between death and sample collection. However, global patterns of postmortem mRNA degradation at individual gene levels across diverse human tissues remain largely unknown. In this study, we performed a systematic analysis of alteration of gene expression associated with PMI in human tissues. From the Genotype-Tissue Expression (GTEx) database, we evaluated gene expression levels of 2,016 high-quality postmortem samples from 316 donors of European descent, with PMI ranging from 1 to 27 hours. We found that PMI-related mRNA degradation is tissue-specific, gene-specific, and even genotype-dependent, thus drawing a more comprehensive picture of PMI-associated gene expression across diverse human tissues. Additionally, we also identified 266 differentially variable (DV) genes, such as DEFB4B and IFNG, whose expression is significantly dispersed between short PMI (S-PMI) and long PMI (L-PMI) groups. In summary, our analyses provide a comprehensive profile of PMI-associated gene expression, which will help interpret gene expression patterns in the evaluation of postmortem tissues.
Overview
The claims and statistics of this paper haven’t been checked yet.
Run the check — free, no account needed. It reads the open-access text and checks the sources it cites.
Integrity signals
Registry
Cites
Statistics
Figures
Verification
Claims the paper makes
The claims and statistics of this paper haven’t been checked yet.
Run the check — free, no account needed. It reads the open-access text and checks the sources it cites.
Self-check
Percentages, sums and reported differences re-computed from the paper’s own numbers.
The self-check needs the paper’s full text.
Citations
Cites
Hierarchical Grouping to Optimize an Objective Function
Ward, J. H. (1963) · Journal of the American Statistical Association · doi:10.1080/01621459.1963.10500845 · Cited by 21,341
DAVID: Database for Annotation, Visualization, and Integrated Discovery
Dennis, G., Sherman, B. T., Hosack, D. A., Yang, J., Gao, W., Lane, H. C., & Lempicki, R. A. (2003) · Genome Biology · doi:10.1186/gb-2003-4-5-p3 · Cited by 9,327
Controlling the false discovery rate in behavior genetics research
Benjamini, Y., Drai, D., Elmer, G., Kafkafi, N., & Golani, I. (2001) · Behavioural Brain Research · doi:10.1016/s0166-4328(01)00297-2 · Cited by 4,146
Robust Tests for the Equality of Variances
Brown, M. B., & Forsythe, A. B. (1974) · Journal of the American Statistical Association · doi:10.1080/01621459.1974.10482955 · Cited by 3,216
The RIN: an RNA integrity number for assigning integrity values to RNA measurements
Schroeder, A., Mueller, O., Stocker, S., Salowsky, R., Leiber, M., Gassmann, M., Lightfoot, S., Menzel, W., Granzow, M., & Ragg, T. (2006) · BMC Molecular Biology · doi:10.1186/1471-2199-7-3 · Cited by 2,623
The human transcriptome across tissues and individuals
Melé, M., Ferreira, P. G., Reverter, F., DeLuca, D. S., Monlong, J., Sammeth, M., Young, T. R., Goldmann, J. M., Pervouchine, D. D., Sullivan, T. J., et al. (2015) · Science · doi:10.1126/science.aaa0355 · Cited by 1,304
The highways and byways of mRNA decay
Garneau, N. L., Wilusz, J., & Wilusz, C. J. (2007) · Nature Reviews Molecular Cell Biology · doi:10.1038/nrm2104 · Cited by 1,294
The Many Pathways of RNA Degradation
Houseley, J. M., & Tollervey, D. W. (2009) · Cell · doi:10.1016/j.cell.2009.01.019 · Cited by 1,220
Stegle, O., Parts, L., Piipari, M., Winn, J., & Durbin, R. (2012) · Nature Protocols · doi:10.1038/nprot.2011.457 · Cited by 1,049
Optimizing illumina next-generation sequencing library preparation for extremely at-biased genomes
Oyola, S. O., Otto, T. D., Gu, Y., Maslen, G. L., Manske, M., Campino, S. G., Turner, D., MacInnis, B. L., Kwiatkowski, D. P., Swerdlow, H., et al. (2012) · BMC Genomics · doi:10.1186/1471-2164-13-1 · Cited by 654
Cited by
Sorted by citations
Conserved cell types with divergent features in human versus mouse cortex
Hodge, R. D., Bakken, T. E., Miller, J. A., Smith, K. A., Barkan, E. R., Graybuck, L. T., Close, J. L., Long, B., Johansen, N., Penn, O., et al. (2019) · Nature · doi:10.1038/s41586-019-1506-7 · Cited by 1,775
Transcriptome-wide isoform-level dysregulation in ASD, schizophrenia, and bipolar disorder
Gandal, M. J., Zhang, P., Hadjimichael, E., Walker, R. L., Chen, C., Liu, S., Won, H., van Bakel, H., Varghese, M., Wang, Y., et al. (2018) · Science · doi:10.1126/science.aat8127 · Cited by 1,247
Grubman, A., Chew, G., Ouyang, J. F., Sun, G., Choo, X. Y., McLean, C., Simmons, R. K., Buckberry, S., Vargas-Landin, D. B., Poppe, D., et al. (2019) · Nature Neuroscience · doi:10.1038/s41593-019-0539-4 · Cited by 956
A practical guide to linking brain-wide gene expression and neuroimaging data
Arnatkevičiūtė, A., Fulcher, B., & Fornito, A. (2019) · NeuroImage · doi:10.1016/j.neuroimage.2019.01.011 · Cited by 831
Transcriptional signature in microglia associated with Aβ plaque phagocytosis
Grubman, A., Choo, X. Y., Chew, G., Ouyang, J. F., Sun, G., Croft, N. P., Rossello, F. J., Simmons, R., Buckberry, S., Landin, D. V., et al. (2021) · Nature Communications · doi:10.1038/s41467-021-23111-1 · Cited by 357
Metadata
- Authors
- Zhu, Y., Wang, L., Yin, Y., & Yang, E.
- Affiliations
- Peking University (CN)
- Corresponding author
- Yin, Yuxin
- Yang, Ence
- Venue
- Scientific Reports
- Published
- 2017-07-14
- Volume
- 7
- Issue
- 1
- Pages
- 5435-5435
- ISSN
- 2045-2322 (ISSN-L)
- PMC
- PMC5511187
- OpenAlex
- W2734938713
- Cited by
- 129
- References
- 46
- Citations by year
- 2026: 12 · 2025: 15 · 2024: 17 · 2023: 9 · 2022: 19 · 2021: 21 · 2020: 13 · 2019: 15 · 2018: 8
- FWCI
- 4.02
- Type
- journal article
- Language
- en
- Open access
- gold
- doi.org
- Locations
- Scientific Reports (publishedVersion, cc-by)
- Europe PMC (PubMed Central) (publishedVersion, cc-by)
- PubMed Central (publishedVersion, cc-by)
- PubMed (publishedVersion)
- DOAJ (DOAJ: Directory of Open Access Journals) (submittedVersion, cc-by-sa)
- Funders
- National Natural Science Foundation of China (111 Project, 31401132, B07001)
- Peking University
- Higher Education Discipline Innovation Project (B07001)
- National Key Research and Development Program of China (#2016YFA0500302)
- Peking University Health Science Center
- Topics
- Life Sciences › Biochemistry, Genetics and Molecular Biology › Molecular Biology › Molecular Biology Techniques and Applications
- Life Sciences › Biochemistry, Genetics and Molecular Biology › Molecular Biology › Gene expression and cancer classification
- Life Sciences › Biochemistry, Genetics and Molecular Biology › Molecular Biology › RNA Research and Splicing
- Keywords
- postmortem interval, gene expression, tissue-specific gene expression, genotype-dependent gene expression, interferon-gamma, GTEx
- MeSH terms
- Autopsy, Cadaver, Genotype, Humans, Interferon-gamma, Organ Specificity, Postmortem Changes, RNA, Messenger, Time Factors, Gene Expression, Databases, Factual, Gene Expression Profiling, RNA Stability, beta-Defensins, White People
About these checks
Registry, retraction, Cites and statistics results are computed, not judged, with one exception: a printed reference that no index lists is read once by a model before it counts as a citation error. Claims are extracted by a model and kept only when their quote appears verbatim in the text; each cited source is then checked, with a model’s help, for whether it says what the claim relies on. Those verdicts can be wrong — read the claim’s quote and the cited source before relying on one.
Statistics and arithmetic are recomputed, not judged.
Confidence bands are shown only for fields calibrated on our annotated test set. None is calibrated yet, so no band is shown.
What counts as a claim ›How we measure confidence ›How we check this ›
Are you an author, or do you see a problem with this page? Request a review
