

The DOI matches its Crossref record; 32 of the 32 references it cites were found in a registry or an index.
TREM2 promotes Aβ phagocytosis by upregulating C/EBPα-dependent CD36 expression in microglia
Open accessAbstract
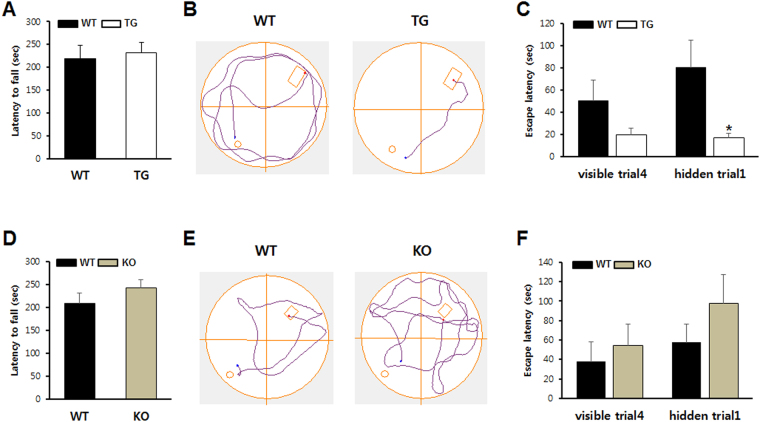
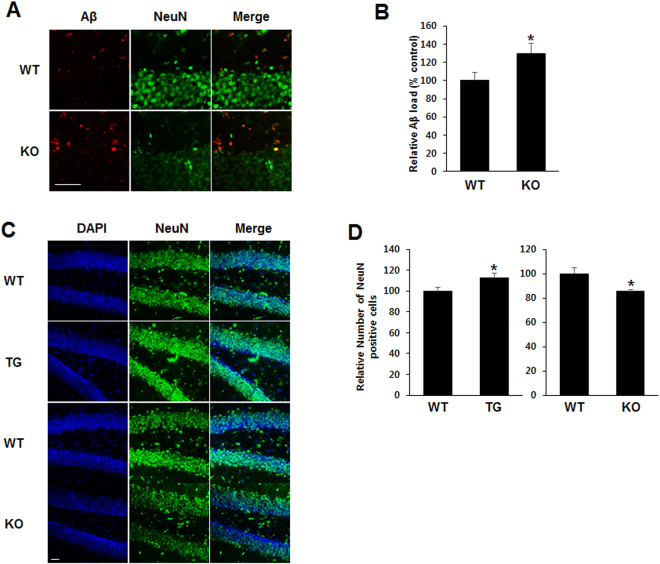
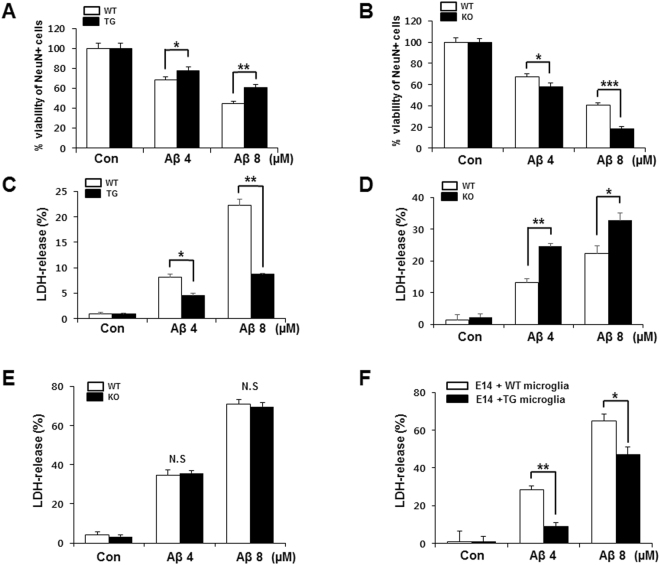
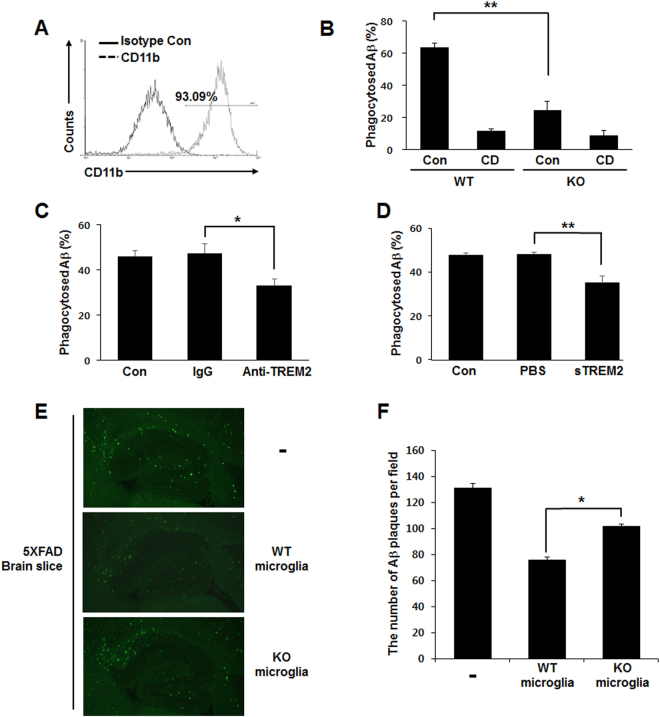
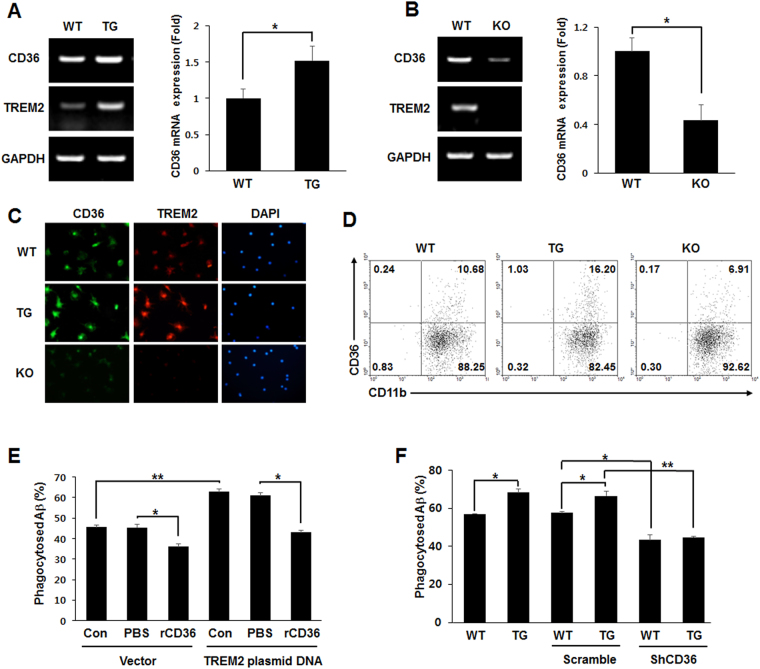
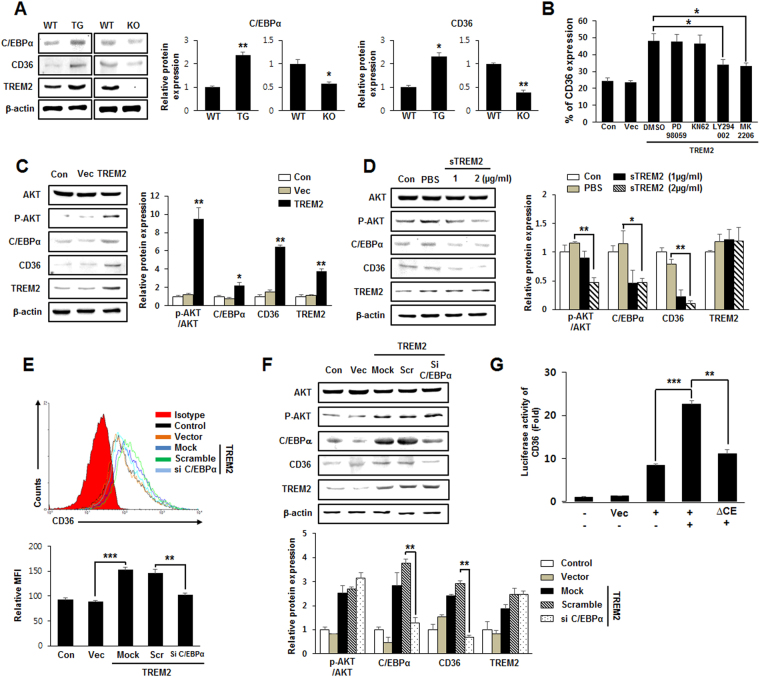
TREM2 plays a critical role in the alleviation of Alzheimer’s disease by promoting Aβ phagocytosis by microglia, but the detailed molecular mechanism underlying TREM2-induced direct phagocytic activity of Aβ remains to be revealed. We found that learning and memory functions were improved in aged TREM2 TG mice, with the opposite effects in KO mice. The amount of phagocytosed Aβ was significantly reduced in the primary microglia of KO mice. CD36 expression in primary microglia was greater in TG than in WT mice but was substantially decreased in KO mice. The expression of C/EBPα, an upstream transcriptional activator of CD36, was also elevated in primary microglia of TG mice but decreased in KO mice. The transcription of CD36 was markedly increased by TREM2 overexpression, and this effect was suppressed by a mutation of the C/EBPα binding site on the CD36 promoter. The TREM2-induced expression of CD36 and C/EBPα was inhibited by treatment with PI3K/AKT signaling blockers, and phosphorylation of AKT was elevated in TREM2-overexpressing BV2 cells. The present study provides evidence that TREM2 is required for preventing loss of memory and learning in Alzheimer’s disease by regulating C/EBPα-dependent CD36 expression and the consequent Aβ phagocytosis.
Overview
The claims and statistics of this paper haven’t been checked yet.
Run the check — free, no account needed. It reads the open-access text and checks the sources it cites.
Integrity signals
Registry
Cites
Statistics
Figures
Verification
Claims the paper makes
The claims and statistics of this paper haven’t been checked yet.
Run the check — free, no account needed. It reads the open-access text and checks the sources it cites.
Claims other papers make about this one
Each is checked against this paper’s own text: does it say what the citing paper says it does?
The source backs part of the claim, not all of it — or backs it for a different population, condition or comparison.
In the citing paper
“Furthermore, lack of Trem2 reduces chemotaxis and phagocytosis of microglia (54, 55).”
From Deletion of Abi3 gene locus exacerbates neuropathological features of Alzheimer’s disease in a mouse model of Aβ amyloidosis (2021) · cites this paper as [54]
Experimental — accuracy not yet measuredThe source backs part of the claim, not all of it — or backs it for a different population, condition or comparison.
In the citing paper
“It was also demonstrated that Trem2 activates multiple signaling pathways involved in actin cytoskeleton organization (54).”
From Deletion of Abi3 gene locus exacerbates neuropathological features of Alzheimer’s disease in a mouse model of Aβ amyloidosis (2021) · cites this paper as [54]
Experimental — accuracy not yet measured
Self-check
Percentages, sums and reported differences re-computed from the paper’s own numbers.
The self-check needs the paper’s full text.
Citations
Cites
The Amyloid Hypothesis of Alzheimer’s Disease: Progress and Problems on the Road to Therapeutics
Hardy, J., & Selkoe, D. J. (2002) · Science · doi:10.1126/science.1072994 · Cited by 13,864
Amyloid oligomers exacerbate tau pathology in a mouse model of tauopathy
Selenica, M.-L. B., Brownlow, M., Jimenez, J. P., Lee, D. C., Pena, G., Dickey, C. A., Gordon, M. N., & Morgan, D. (2013) · Neurodegenerative Diseases · doi:10.1159/000337230 · Cited by 10,359
Diffusible, nonfibrillar ligands derived from Aβ 1–42 are potent central nervous system neurotoxins
Lambert, M. P., Barlow, A. K., Chromy, B. A., Edwards, C., Freed, R., Liosatos, M., Morgan, T. E., Rozovsky, I., Trommer, B., Viola, K. L., et al. (1998) · Proceedings of the National Academy of Sciences · doi:10.1073/pnas.95.11.6448 · Cited by 3,506
Alzheimer Mechanisms and Therapeutic Strategies
Huang, Y., & Mucke, L. (2012) · Cell · doi:10.1016/j.cell.2012.02.040 · Cited by 1,758
TREM2 Lipid Sensing Sustains the Microglial Response in an Alzheimer’s Disease Model
Wang, Y., Cella, M., Mallinson, K., Ulrich, J. D., Young, K. L., Robinette, M. L., Gilfillan, S., Krishnan, G. M., Sudhakar, S., Zinselmeyer, B. H., et al. (2015) · Cell · doi:10.1016/j.cell.2015.01.049 · Cited by 1,736
Soluble Amyloid β Peptide Concentration as a Predictor of Synaptic Change in Alzheimer's Disease
Lue, L.-F., Kuo, Y.-M., Roher, A. E., Brachova, L., Shen, Y., Sue, L., Beach, T., Kurth, J. H., Rydel, R. E., & Rogers, J. (1999) · The American Journal of Pathology · doi:10.1016/s0002-9440(10)65184-x · Cited by 1,530
CD36 is a receptor for oxidized low density lipoprotein
Endemann, G., Stanton, L. W., Madden, K. S., Bryant, C. M., White, R. T., & Protter, A. A. (1993) · Journal of Biological Chemistry · doi:10.1016/s0021-9258(19)50272-1 · Cited by 1,282
Lacor, P. N., Buniel, M. C., Furlow, P. W., Sanz Clemente, A., Velasco, P. T., Wood, M., Viola, K. L., & Klein, W. L. (2007) · The Journal of Neuroscience · doi:10.1523/jneurosci.3501-06.2007 · Cited by 1,188
Takahashi, K., Rochford, C. D. P., & Neumann, H. (2005) · The Journal of Experimental Medicine · doi:10.1084/jem.20041611 · Cited by 1,124
Activation of the innate immune receptor Dectin-1 upon formation of a ‘phagocytic synapse’
Goodridge, H. S., Reyes, C. N., Becker, C. A., Katsumoto, T. R., Ma, J., Wolf, A. J., Bose, N., Chan, A. S. H., Magee, A. S., Danielson, M. E., et al. (2011) · Nature · doi:10.1038/nature10071 · Cited by 885
Cited by
Sorted by citations
Inflammation: the link between comorbidities, genetics, and Alzheimer’s disease
Newcombe, E. A., Camats-Perna, J., Silva, M. L., Valmas, N., Huat, T. J., & Medeiros, R. (2018) · Journal of Neuroinflammation · doi:10.1186/s12974-018-1313-3 · Cited by 532
Beyond the neuron–cellular interactions early in Alzheimer disease pathogenesis
Henstridge, C. M., Hyman, B. T., & Spires-Jones, T. L. (2019) · Nature Reviews Neuroscience · doi:10.1038/s41583-018-0113-1 · Cited by 348
Phagocytosis in the Brain: Homeostasis and Disease
Galloway, D. A., Phillips, A. E. M., Owen, D. R., & Moore, C. S. (2019) · Frontiers in Immunology · doi:10.3389/fimmu.2019.00790 · Cited by 319
Wang, X., He, Q., Zhou, C., Xu, Y., Liu, D., Fujiwara, N., Kubota, N., Click, A., Henderson, P., Vancil, J., et al. (2023) · Immunity · doi:10.1016/j.immuni.2022.11.013 · Cited by 262
Wang, Y., Lin, Y., Wang, L., Zhan, H., Luo, X., Zeng, Y., Wu, W., Zhang, X., & Wang, F. (2020) · Aging · doi:10.18632/aging.104104 · Cited by 196
Brain cell type-specific cholesterol metabolism and implications for learning and memory
Li, D., Zhang, J., & Liu, Q. (2022) · Trends in Neurosciences · doi:10.1016/j.tins.2022.01.002 · Cited by 163
Dysregulated phosphoinositide 3-kinase signaling in microglia: shaping chronic neuroinflammation
Chu, E., Mychasiuk, R., Hibbs, M. L., & Semple, B. D. (2021) · Journal of Neuroinflammation · doi:10.1186/s12974-021-02325-6 · Cited by 152
Microglia in Alzheimer’s Disease: A Target for Therapeutic Intervention
Zhang, G., Wang, Z., Hu, H., Zhao, M., & Sun, L. (2021) · Frontiers in Cellular Neuroscience · doi:10.3389/fncel.2021.749587 · Cited by 137
TREM2: Potential therapeutic targeting of microglia for Alzheimer's disease
Li, Y., Xu, H., Wang, H., Yang, K., Luan, J., & Wang, S. (2023) · Biomedicine & Pharmacotherapy · doi:10.1016/j.biopha.2023.115218 · Cited by 133
McMenamin, P. G., Saban, D. R., & Dando, S. J. (2019) · Progress in Retinal and Eye Research · doi:10.1016/j.preteyeres.2018.12.002 · Cited by 115
The innate immune system in diabetic retinopathy
Pan, W. W., Lin, F., & Fort, P. E. (2021) · Progress in Retinal and Eye Research · doi:10.1016/j.preteyeres.2021.100940 · Cited by 117
TREM2 ectodomain and its soluble form in Alzheimer’s disease
Yang, J., Fu, Z., Zhang, X., Xiong, M., Meng, L., & Zhang, Z. (2020) · Journal of Neuroinflammation · doi:10.1186/s12974-020-01878-2 · Cited by 113
TREM2 promotes cholesterol uptake and foam cell formation in atherosclerosis
Guo, X. Q., Li, B., Wen, C., Zhang, F. S., Xiang, X., Nie, L., Chen, J., & Mao, L. (2023) · Cellular and Molecular Life Sciences · doi:10.1007/s00018-023-04786-9 · Cited by 100
TREM Receptors Connecting Bowel Inflammation to Neurodegenerative Disorders
Natale, G., Biagioni, F., Busceti, C. L., Gambardella, S., Limanaqi, F., & Fornai, F. (2019) · Cells · doi:10.3390/cells8101124 · Cited by 83
Immune Activation in Alzheimer Disease
Mary, A., Mancuso, R., & Heneka, M. T. (2024) · Annual Review of Immunology · doi:10.1146/annurev-immunol-101921-035222 · Cited by 82
Efficacy and mechanism of cGAMP to suppress Alzheimer’s disease by elevating TREM2
Xu, Q., Xu, W., Cheng, H., Yuan, H., & Tan, X. (2019) · Brain, Behavior, and Immunity · doi:10.1016/j.bbi.2019.07.004 · Cited by 75
AmeliMojarad, M., & AmeliMojarad, M. (2024) · CNS Neuroscience & Therapeutics · doi:10.1111/cns.14856 · Cited by 73
Koronyo‐Hamaoui, M., Sheyn, J., Hayden, E. Y., Li, S., Fuchs, D.-T. S., Regis, G. C., Lopes, D. H. J., Black, K. L., Bernstein, K. E., Teplow, D. B., et al. (2019) · Brain · doi:10.1093/brain/awz364 · Cited by 75
Trem2 Y38C mutation and loss of Trem2 impairs neuronal synapses in adult mice
Jadhav, V., Lin, P. B., Pennington, T., Prisco, G. V. D., Jannu, A. J., Xu, G., Moutinho, M., Zhang, J., Atwood, B. K., Puntambekar, S. S., et al. (2020) · Molecular Neurodegeneration · doi:10.1186/s13024-020-00409-0 · Cited by 69
Gedam, M., Comerota, M. M., Propson, N. E., Chen, T., Jin, F., Wang, M. C., & Zheng, H. (2023) · Journal of Clinical Investigation · doi:10.1172/jci167501 · Cited by 74
Aged Mouse Cortical Microglia Display an Activation Profile Suggesting Immunotolerogenic Functions
Zöller, T., Attaai, A., Potru, P. S., Ruß, T., & Spittau, B. (2018) · International Journal of Molecular Sciences · doi:10.3390/ijms19030706 · Cited by 66
Karahan, H., Smith, D. C., Kim, B., Dabin, L. C., Al-Amin, M. M., Wijeratne, H. R. S., Pennington, T., Viana di Prisco, G., McCord, B., Lin, P. B.-C., et al. (2021) · Science Advances · doi:10.1126/sciadv.abe3954 · Cited by 53
TREM2 ‐dependent microglial function is essential for remyelination and subsequent neuroprotection
Wang, Y., Kyauk, R. V., Shen, Y. A., Xie, L., Reichelt, M., Lin, H., Jiang, Z., Ngu, H., Shen, K., Greene, J. J., et al. (2023) · Glia · doi:10.1002/glia.24335 · Cited by 54
Wang, L., Nykänen, N.-P., Western, D., Gorijala, P., Timsina, J., Li, F., Wang, Z., Ali, M., Yang, C., Liu, M., et al. (2024) · Molecular Neurodegeneration · doi:10.1186/s13024-023-00687-4 · Cited by 58
Canepa, E., Parodi‐Rullán, R. M., Vázquez‐Torres, R., Gamallo‐Lana, B., Guzman‐Hernandez, R. A., Lemon, N. L., Angiulli, F., Debure, L., Ilies, M. A., Østergaard, L., et al. (2023) · Alzheimer s & Dementia · doi:10.1002/alz.13063 · Cited by 54
IL-4 and IL-10 promotes phagocytic activity of microglia by up-regulation of TREM2
Yi, S., Jiang, X., Tang, X., Li, Y., Xiao, C., Zhang, J., & Zhou, T. (2020) · Cytotechnology · doi:10.1007/s10616-020-00409-4 · Cited by 49
White matter-associated microglia: New players in brain aging and neurodegenerative diseases
Ahn, K., Lee, S., & Mook‐Jung, I. (2022) · Ageing Research Reviews · doi:10.1016/j.arr.2022.101574 · Cited by 50
Self-citationRecent Insights Into the Role of Macrophages in Acute Gout
Liu, L., Zhu, L., Liu, M., Zhao, L., Yu, Y., Yu, X., & Shan, L. (2022) · Frontiers in Immunology · doi:10.3389/fimmu.2022.955806 · Cited by 47
New insight on microglia activation in neurodegenerative diseases and therapeutics
Xu, Y., Gao, W., Sun, Y., & Wu, M. (2023) · Frontiers in Neuroscience · doi:10.3389/fnins.2023.1308345 · Cited by 50
Mishra, P. K., Palma, M., Buechel, B., Moore, J., Davra, V., Chu, N., Millman, A., Hallab, N. J., Kanneganti, T., Birge, R. B., et al. (2019) · Nature Materials · doi:10.1038/s41563-018-0271-6 · Cited by 44
Electroacupuncture ameliorates neuroinflammation in animal models
Xin, Y., Wang, J.-X., & Xu, A. (2022) · Acupuncture in Medicine · doi:10.1177/09645284221076515 · Cited by 46
An emerging role for microglia in stress‐effects on memory
Sanguino‐Gómez, J., Buurstede, J. C., Abiega, O., Fitzsimons, C. P., Lucassen, P. J., Eggen, B. J. L., Lesuis, S. L., Meijer, O. C., & Krugers, H. J. (2021) · European Journal of Neuroscience · doi:10.1111/ejn.15188 · Cited by 43
TREM2 Acts as a Tumor Suppressor in Colorectal Carcinoma through Wnt1/β-catenin and Erk Signaling
Kim, S., Kim, E.-M., Ji, K.-Y., Lee, H.-Y., Yee, S., Woo, S.-M., Yi, J., Yun, C., Choi, H., & Kang, H. (2019) · Cancers · doi:10.3390/cancers11091315 · Cited by 43
Self-citationOrigin and function of synovial macrophage subsets during inflammatory joint disease
Culemann, S., Grüneboom, A., & Krönke, G. (2019) · Advances in immunology · doi:10.1016/bs.ai.2019.08.006 · Cited by 44
Roles of TREM2 in the Pathological Mechanism and the Therapeutic Strategies of Alzheimer's Disease
Lin, M., Yu, J., Zhang, W., Lao, F., & Huang, H. (2024) · The Journal of Prevention of Alzheimer s Disease · doi:10.14283/jpad.2024.164 · Cited by 46
Blood-brain barrier and innate immunity in the pathogenesis of Alzheimer's disease
Šimić, G., Španić, E., Horvat, L. L., & Hof, P. R. (2019) · Progress in molecular biology and translational science · doi:10.1016/bs.pmbts.2019.06.003 · Cited by 40
Immune Regulatory Functions of Macrophages and Microglia in Central Nervous System Diseases
Poppell, M., Hammel, G., & Ren, Y. (2023) · International Journal of Molecular Sciences · doi:10.3390/ijms24065925 · Cited by 39
Liang, F., Huang, T., Li, B., Zhao, Y., Zhang, X., & Xu, B. (2020) · Neuroreport · doi:10.1097/wnr.0000000000001429 · Cited by 38
Zhou, H., Li, J., Hu, L., Yu, J., Fu, X., Liang, F., Yan, F., & Chen, G. (2022) · Journal of Advanced Research · doi:10.1016/j.jare.2022.03.011 · Cited by 36
Avenanthramide-C Restores Impaired Plasticity and Cognition in Alzheimer’s Disease Model Mice
Ramasamy, V. S., Samidurai, M., Park, H. J., Wang, M., Park, R. Y., Yu, S. Y., Kang, H. K., Hong, S., Choi, W., Lee, Y., et al. (2019) · Molecular Neurobiology · doi:10.1007/s12035-019-01707-5 · Cited by 37
Self-citationThe Past and Present Lives of the Intraocular Transmembrane Protein CD36
Yang, R., Liu, Q., & Zhang, M. (2022) · Cells · doi:10.3390/cells12010171 · Cited by 37
Microglial TREM2 at the Intersection of Brain Aging and Alzheimer’s Disease
Qu, W., & Li, L. (2021) · The Neuroscientist · doi:10.1177/10738584211040786 · Cited by 38
Althafar, Z. M. (2022) · Molecules · doi:10.3390/molecules27134124 · Cited by 36
The emerging role of brain neuroinflammatory responses in Alzheimer’s disease
AmeliMojarad, M., AmeliMojarad, M., & Cui, X. (2024) · Frontiers in Aging Neuroscience · doi:10.3389/fnagi.2024.1391517 · Cited by 34
Ernest James Phillips, T., & Maguire, E. (2021) · Frontiers in Cellular Neuroscience · doi:10.3389/fncel.2021.652593 · Cited by 33
Ni, J., Xie, Z., Quan, Z., Meng, J., & Qing, H. (2023) · Glia · doi:10.1002/glia.24465 · Cited by 33
Unravelling the glial response in the pathogenesis of Alzheimer's disease
Alibhai, J. D., Diack, A. B., & Manson, J. C. (2018) · The FASEB Journal · doi:10.1096/fj.201801360r · Cited by 31
Comerota, M. M., Gedam, M., Xiong, W., Jin, F., Deng, L., Wang, M. C., Wang, J., & Zheng, H. (2023) · Molecular Neurodegeneration · doi:10.1186/s13024-023-00648-x · Cited by 31
Ganz, T., Fainstein, N., Elad, A., Lachish, M., Goldfarb, S., Einstein, O., & Ben‐Hur, T. (2022) · Journal of Neuroinflammation · doi:10.1186/s12974-021-02369-8 · Cited by 31
Autophagy & Phagocytosis in Neurological Disorders and their Possible Cross-talk
Li, G., Sherchan, P., Tang, Z., & Tang, J. (2021) · Current Neuropharmacology · doi:10.2174/1570159x19666210407150632 · Cited by 29
Cellular Biology of Tau Diversity and Pathogenic Conformers
Kang, S., Eskandari‐Sedighi, G., Hromádková, L., Safar, J., & Westaway, D. A. (2020) · Frontiers in Neurology · doi:10.3389/fneur.2020.590199 · Cited by 29
Pfänder, P., Fidan, M., Burret, U., Lipinski, L., & Vettorazzi, S. (2019) · Frontiers in Immunology · doi:10.3389/fimmu.2019.01554 · Cited by 24
Ennerfelt, H. E., & Lukens, J. R. (2023) · Clinical and Translational Medicine · doi:10.1002/ctm2.1178 · Cited by 22
Wang, Y., Bao, D., Xu, B., Cheng, C., Dong, Y., Wei, X., & Niu, C. (2019) · Neural Regeneration Research · doi:10.4103/1673-5374.250620 · Cited by 22
Takatori, S., Kondo, M., & Tomita, T. (2025) · Inflammation and Regeneration · doi:10.1186/s41232-025-00383-4 · Cited by 28
Differential interaction with TREM2 modulates microglial uptake of modified Aβ species
Joshi, P., Riffel, F., Satoh, K., Enomoto, M., Qamar, S., Scheiblich, H., Villacampa, N., Kumar, S., Theil, S., Parhizkar, S., et al. (2021) · Glia · doi:10.1002/glia.24077 · Cited by 21
Wang, X., Xie, Y., Fan, X., Wu, X., Wang, D., & Li, Z. (2024) · Alzheimer s Research & Therapy · doi:10.1186/s13195-024-01489-6 · Cited by 26
Simons, E. S., Smith, M. A., Crish, S. D., & Crish, S. D. (2020) · Neurobiology of Disease · doi:10.1016/j.nbd.2020.105146 · Cited by 19
Survival motor neuron protein deficiency alters microglia reactivity
Khayrullina, G., Alipio‐Gloria, Z. A., Deguise, M., Gagnon, S., Chehadé, L., Stinson, M. W., Belous, N., Bergman, E. M., Lischka, F. W., Rotty, J. D., et al. (2022) · Glia · doi:10.1002/glia.24177 · Cited by 18
Novel Anti-Neuroinflammatory Properties of a Thiosemicarbazone–Pyridylhydrazone Copper(II) Complex
Choo, X. Y., McInnes, L. E., Grubman, A., Wasielewska, J. M., Belaya, I., Burrows, E. L., Quek, H., Cañas-Martín, J., Loppi, S. H., Sorvari, A., et al. (2022) · International Journal of Molecular Sciences · doi:10.3390/ijms231810722 · Cited by 19
Bonomi, C. G., Assogna, M., Donna, M. G. D., Bernocchi, F., Lucia, V. D., Nuccetelli, M., Fiorelli, D., Loizzo, S., Mercuri, N. B., Koch, G., et al. (2023) · Journal of Alzheimer s Disease · doi:10.3233/jad-221010 · Cited by 20
The Role of TREML2 in Alzheimer’s Disease
Wang, S., Gong, P., Yan, E., Zhang, Y., & Jiang, T. (2020) · Journal of Alzheimer s Disease · doi:10.3233/jad-200406 · Cited by 18
Sepulveda, J., Kim, J. Y., Binder, J., Vicini, S., & Rebeck, G. W. (2024) · Molecular Neurodegeneration · doi:10.1186/s13024-024-00714-y · Cited by 19
Guo, X., Liu, Y., Morgan, D., & Zhao, L. (2020) · Aging and Disease · doi:10.14336/ad.2020.0201 · Cited by 16
Jagadeesan, N., Roules, G. C., Chandrashekar, D. V., Yang, J., Kolluru, S., & Sumbria, R. K. (2024) · Journal of Translational Medicine · doi:10.1186/s12967-024-05008-x · Cited by 19
SHIP inhibition mediates select TREM2-induced microglial functions
Ramakrishnan, G. S., Berry, W. L., Pacherille, A., Kerr, W. G., Chisholm, J. D., Pedicone, C., & Humphrey, M. B. (2024) · Molecular Immunology · doi:10.1016/j.molimm.2024.04.002 · Cited by 17
MAVS signaling shapes microglia responses to neurotropic virus infection
Gern, O. L., Pavlou, A., Mulenge, F., Busker, L. M., Ghita, L., Aringo, A., Costa, B., Spanier, J., Waltl, I., Stangel, M., et al. (2024) · Journal of Neuroinflammation · doi:10.1186/s12974-024-03258-6 · Cited by 15
Liu, L., Liang, J., Liu, Y.-H., Liu, B., Dong, X., Cai, W.-H., & Zhang, N. (2024) · Heliyon · doi:10.1016/j.heliyon.2024.e30523 · Cited by 15
RetractedThe role of microglial TREM2 in development: A path toward neurodegeneration?
Matteoli, M. (2024) · Glia · doi:10.1002/glia.24574 · Cited by 16
Danziger, R., Fuchs, D.-T., Koronyo, Y., Rentsendorj, A., Sheyn, J., Hayden, E. Y., Teplow, D. B., Black, K. L., Fuchs, S., Bernstein, K. E., et al. (2023) · Frontiers in Physiology · doi:10.3389/fphys.2023.1179315 · Cited by 16
Boudesco, C., Nonneman, A., Cinti, A., Picardi, P., Redaelli, L., Swijsen, S., Roewe, J., Reinhardt, P., Ibach, M., Walter, J., et al. (2022) · Glia · doi:10.1002/glia.24252 · Cited by 14
Jin, N., Sha, W., & Gao, L. (2021) · Frontiers in Cell and Developmental Biology · doi:10.3389/fcell.2021.741368 · Cited by 16
The various roles of TREM2 in cardiovascular disease
Wang, S., Cao, C., & Peng, D. (2025) · Frontiers in Immunology · doi:10.3389/fimmu.2025.1462508 · Cited by 16
Njoku, G. C., & Kanmogne, G. D. (2025) · International Journal of Molecular Sciences · doi:10.3390/ijms26189069 · Cited by 15
Watson, Z., & Tang, S. (2022) · Cells · doi:10.3390/cells11121943 · Cited by 13
The Pathogenesis in Alzheimer's Disease: TREM2 as a Potential Target
Liu, G., Zhang, L., Fan, Y., & Ji, W. (2023) · Journal of Integrative Neuroscience · doi:10.31083/j.jin2206150 · Cited by 13
Su, P., Zhang, J., Wu, J., Chen, H., Luo, W., & Hu, M. (2023) · Ecotoxicology and Environmental Safety · doi:10.1016/j.ecoenv.2023.115058 · Cited by 13
Macrophage heterogeneity and plasticity in liver injury and repair mechanisms
Zhang, T., Horn, P., Peiseler, M., & Tacke, F. (2025) · Stem Cells · doi:10.1093/stmcls/sxaf072 · Cited by 14
Connor, S. M., Rashid, M., Ryan, K. J., Patel, K. R., Boyd, J. D., Smith, J., Elyaman, W., Bennett, D. A., & Bradshaw, E. M. (2022) · Frontiers in Cellular Neuroscience · doi:10.3389/fncel.2022.894601 · Cited by 12
Biomaterials in Alzheimer's Disease: An Anti‐Neuroinflammatory Perspective
Huang, N., Huang, W., Wang, M., Shi, J., Luo, Y., & Huang, J. (2025) · Advanced Healthcare Materials · doi:10.1002/adhm.202500498 · Cited by 13
Roles of Microglia in AD Pathology
Gao, R., Wu, H., Li, Q., & Zhao, J. (2023) · Current Alzheimer Research · doi:10.2174/1567205020666230203112351 · Cited by 10
Wang, X., Liu, L., Jiang, X., Saredy, J., Xi, H., Cueto, R., Sigler, D., Khan, M., Wu, S., Ji, Y. H., et al. (2023) · Alzheimer s Research & Therapy · doi:10.1186/s13195-023-01311-9 · Cited by 8
Lin, Y.-Y., Chang, W.-H., Hsieh, S.-L. E., & Cheng, I. H.-J. (2024) · Journal of Neuroinflammation · doi:10.1186/s12974-024-03253-x · Cited by 10
Schwarz, H., Bässler, S., Balta, D., Socher, E., Zunke, F., & Arnold, P. (2022) · Behavioural Brain Research · doi:10.1016/j.bbr.2022.113977 · Cited by 8
Li, H., Zhang, Q., Xue, X., Zhang, J., Wang, S., Zhang, J., Li, L., & Niu, Q. L. (2023) · Ecotoxicology and Environmental Safety · doi:10.1016/j.ecoenv.2023.115062 · Cited by 13
Liu, J., Zhou, J., You, C., Xia, H., Gao, Y., Liu, Y., & Gong, X. (2024) · Frontiers in Neuroscience · doi:10.3389/fnins.2024.1435082 · Cited by 10
Hidden features: CD36/SR-B2, a master regulator of macrophage phenotype/function through metabolism
Chen, Y., Zhang, X., Huang, S., & Febbraio, M. (2024) · Frontiers in Immunology · doi:10.3389/fimmu.2024.1468957 · Cited by 9
Jang, B.-K., Shin, S. J., Park, H. H., Kumar, V., Park, Y., Kim, J. Y., Kang, H., Park, S. Y., Kwon, Y., Shin, S.-E., et al. (2024) · Pharmaceutics · doi:10.3390/pharmaceutics17010013 · Cited by 7
Self-citationTargeting Microglial Activation to Modulate Neuroinflammation in Alzheimer’s Disease
Patil, V., Sharma, A., Parekh, B. K., Farah, H., Jyothi, S. R., Mishra, S. S., Nanda, A., Al-Hasnaawei, S., & Mishra, M. K. (2025) · NeuroMolecular Medicine · doi:10.1007/s12017-025-08898-2 · Cited by 9
Gallo, C., Verrillo, L., Manzo, E., Cauzzi, E., Barbera, L. L., Sabatino, G., Paolis, M. L. D., Sciacca, M. F. M., Barra, G., Peroni, E., et al. (2025) · Journal of Neuroinflammation · doi:10.1186/s12974-025-03634-w · Cited by 8
Axl is a key regulator of intestinal γδ T‐cell homeostasis
Kim, S., Park, M. J., Yee, S., Ji, K.-Y., Lee, E., Nguyen, T., Nguyen, T. H., Jang, J. H., Kim, E., Choi, H., et al. (2019) · The FASEB Journal · doi:10.1096/fj.201901356r · Cited by 7
Self-citationSynergistic potential of TREM2 agonists and exercise training in Alzheimer’s disease
Zhang, J., Schneider, B. A., Muguerza, E., Chung, E. K., & Hsu, C. G. (2026) · American Journal of Physiology-Endocrinology and Metabolism · doi:10.1152/ajpendo.00124.2025 · Cited by 6
Yang, A., Chen, Y., Gao, Y., Lv, Q., Li, Y., Li, F., Yu, R., Han, Z., Dai, S., Zhu, J., et al. (2024) · Food & Function · doi:10.1039/d4fo00215f · Cited by 6
Wang, Y., & Han, B. (2022) · Combinatorial Chemistry & High Throughput Screening · doi:10.2174/1386207325666220726163514 · Cited by 6
Genomic analyses reveal new insights into Alzheimer's diseasePreprint
Uffelmann, E., Wightman, D. P., Bahrami, S., Shadrin, A. A., Fominykh, V., Ojima, T., Jiang, C., Benner, C., Moreno, E., Campos, A. I., et al. (2025) · medRxiv · doi:10.1101/2025.10.10.25337470 · Cited by 8
Chen, B., Lu, H.-C., Huang, L., Wang, J., Bujold, M., Tang, L., Du, X., & Wang, Y. (2026) · Journal of Neuroinflammation · doi:10.1186/s12974-026-03733-2 · Cited by 5
Paul, D., & Basavan, D. (2022) · Future Journal of Pharmaceutical Sciences · doi:10.1186/s43094-022-00446-0 · Cited by 5
Kim, J. E., & Leem, J. Y. (2021) · Korean Journal of Medicinal Crop Science · doi:10.7783/kjmcs.2021.29.5.337 · Cited by 4
Yang, F., Kong, X., Hu, Y., Liu, W., Xie, P., Gu, Y., Zhang, Y., Yang, Y. L., Tang, C., & Li, J. (2025) · Journal of Advanced Research · doi:10.1016/j.jare.2025.08.050 · Cited by 3
High Content Imaging and Quantification of Microglia Phagocytosis In Vitro
McPherson, C. A., Kelly‐Rajan, K., d’Hellencourt, C. L., & Harry, G. J. (2023) · Current Protocols · doi:10.1002/cpz1.638 · Cited by 4
Metadata
- Authors
- Kim, S.-M., Mun, B.-R., Lee, S.-J., Joh, Y., Lee, H.-Y., Ji, K.-Y., Choi, H.-R., Lee, E.-H., Kim, E.-M., Jang, J.-H., Song, H.-W., Mook-Jung, I., Choi, W.-S., & Kang, H.-S.
- Affiliations
- Chonnam National University (KR)
- Daegu-Gyeongbuk Medical Innovation Foundation (KR)
- Nambu University (KR)
- Korea Atomic Energy Research Institute (KR)
- Korea Institute of Toxicology (KR)
- Corresponding author
- Choi, Won-Seok
- Kang, Hyung-Sik
- Venue
- Scientific Reports
- Published
- 2017-09-11
- Volume
- 7
- Issue
- 1
- Pages
- 11118-11118
- ISSN
- 2045-2322 (ISSN-L)
- PMC
- PMC5593901
- OpenAlex
- W2751088224
- Cited by
- 143
- References
- 32
- Citations by year
- 2026: 12 · 2025: 13 · 2024: 38 · 2023: 23 · 2022: 18 · 2021: 13 · 2020: 9 · 2019: 13 · 2018: 4
- FWCI
- 3.54
- Type
- journal article
- Language
- en
- Open access
- gold
- doi.org
- Locations
- Scientific Reports (publishedVersion, cc-by)
- PubMed Central (publishedVersion, cc-by)
- PubMed (publishedVersion)
- DOAJ (DOAJ: Directory of Open Access Journals) (submittedVersion)
- Funders
- National Research Foundation
- National Research Foundation of Korea (2016R1D1A3B03931710)
- Topics
- Life Sciences › Neuroscience › Neurology › Neuroinflammation and Neurodegeneration Mechanisms
- Life Sciences › Neuroscience › Cellular and Molecular Neuroscience › Alzheimer's disease research and treatments
- Life Sciences › Immunology and Microbiology › Immunology › Phagocytosis and Immune Regulation
- Keywords
- TREM2, amyloid-beta phagocytosis, microglia, CD36, C/EBPα, Alzheimer's disease, learning and memory, PI3K/Akt signaling, Akt phosphorylation, TREM2 knockout mice
- MeSH terms
- Animals, Immunohistochemistry, Membrane Glycoproteins, Mice, Transgenic, Neurons, Phagocytes, Phagocytosis, Receptors, Immunologic, Biomarkers, Gene Expression Regulation, Neoplastic, Amyloid beta-Peptides, Microglia, Mice, Knockout, CD36 Antigens, CCAAT-Enhancer-Binding Proteins, Mice
About these checks
Registry, retraction, Cites and statistics results are computed, not judged, with one exception: a printed reference that no index lists is read once by a model before it counts as a citation error. Claims are extracted by a model and kept only when their quote appears verbatim in the text; each cited source is then checked, with a model’s help, for whether it says what the claim relies on. Those verdicts can be wrong — read the claim’s quote and the cited source before relying on one.
Statistics and arithmetic are recomputed, not judged.
Confidence bands are shown only for fields calibrated on our annotated test set. None is calibrated yet, so no band is shown.
What counts as a claim ›How we measure confidence ›How we check this ›
Are you an author, or do you see a problem with this page? Request a review
