

The DOI matches its Crossref record; 2 of the 2 references it cites were found in a registry or an index.
Structure based biophysical characterization of the PROPPIN Atg18 shows Atg18 oligomerization upon membrane binding
Abstract
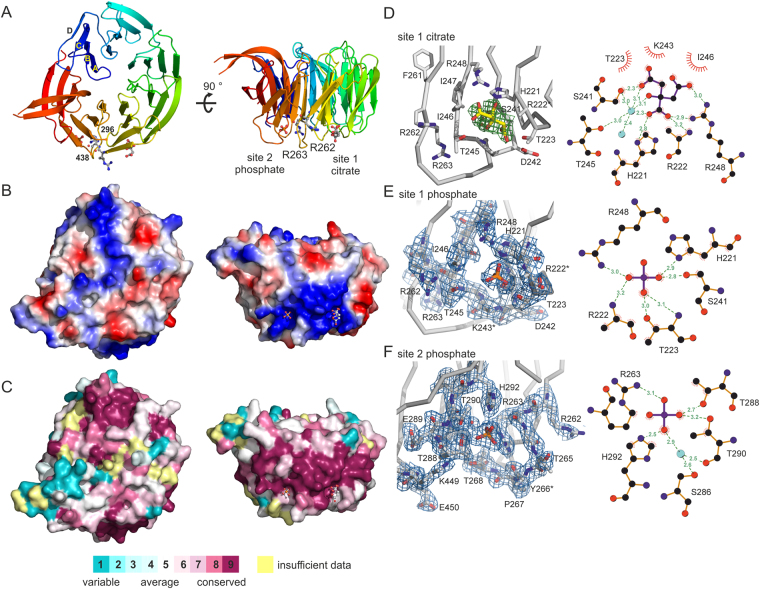
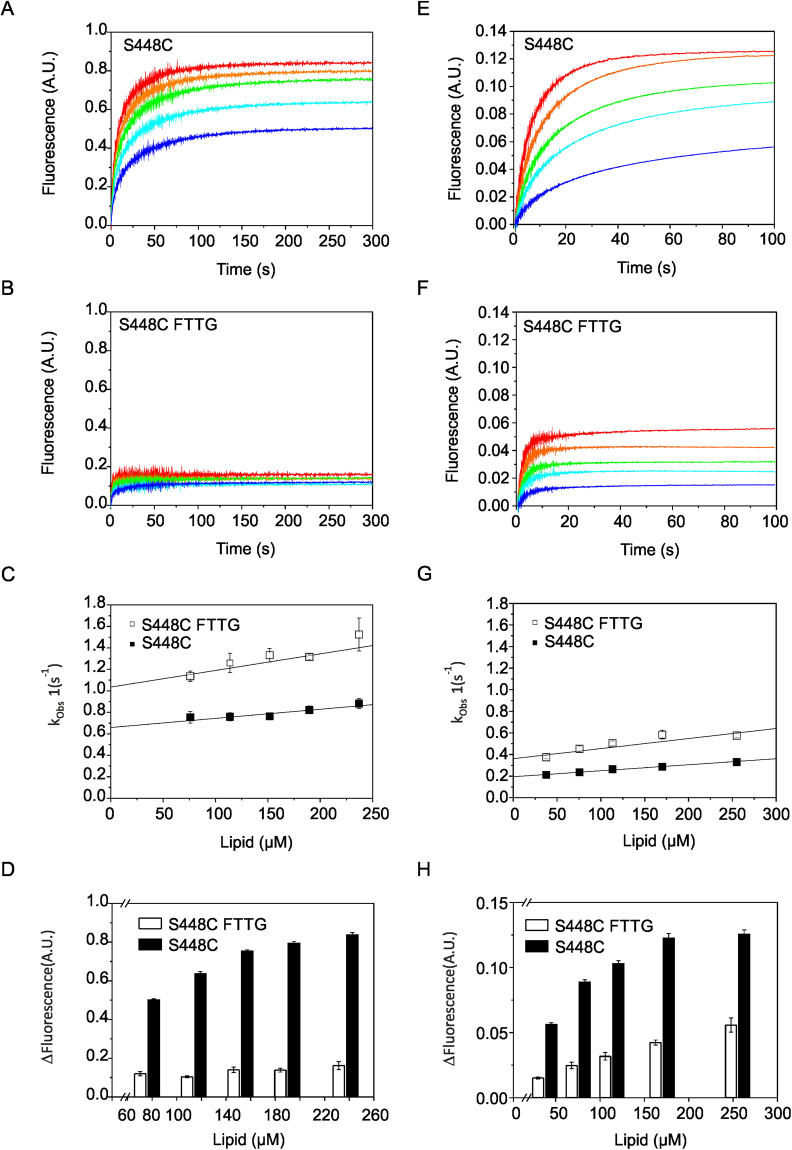
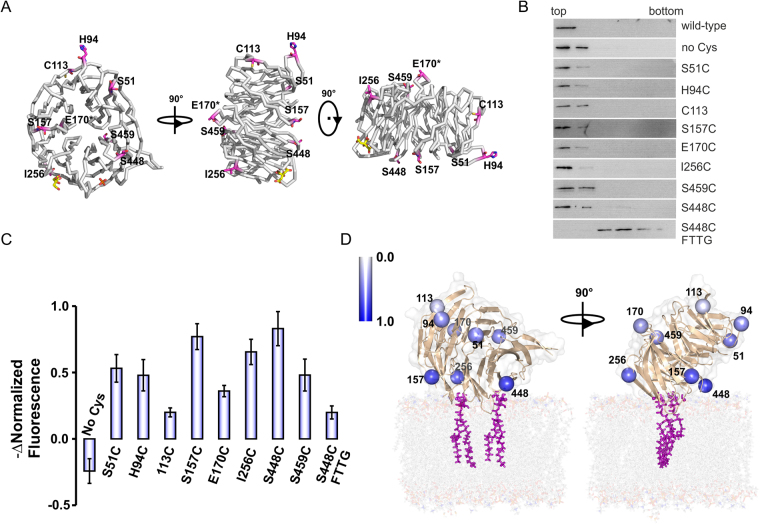
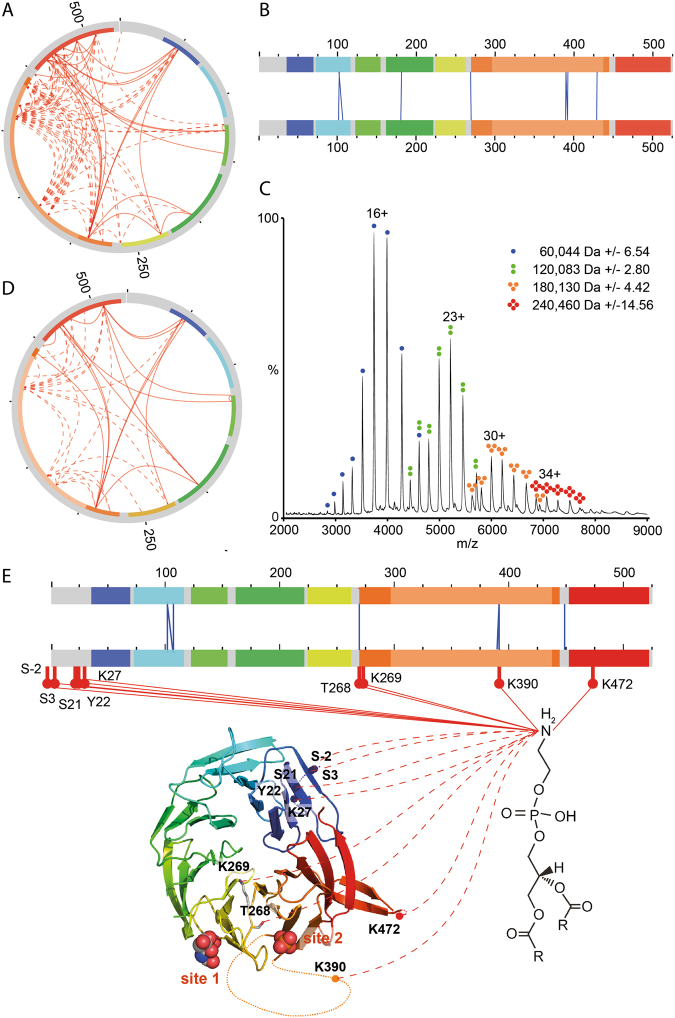
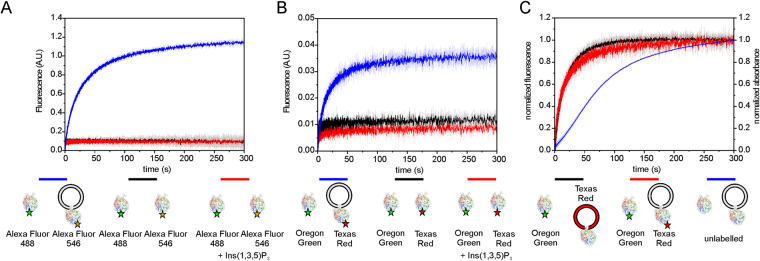
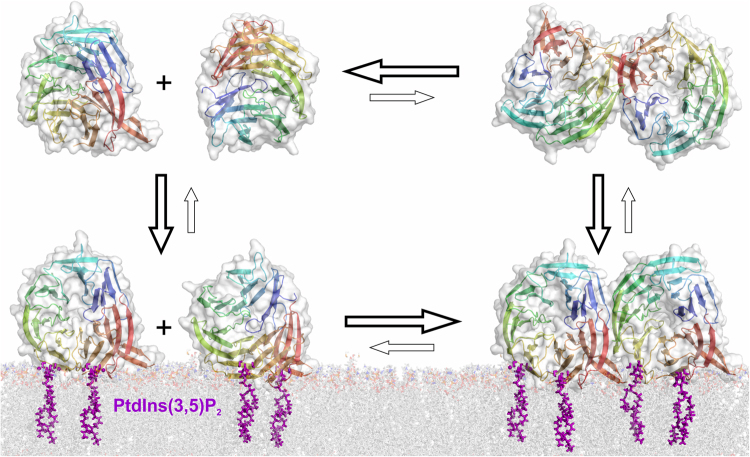
PROPPINs (β-propellers that bind polyphosphoinositides) are PtdIns3P and PtdIns(3,5)P 2 binding autophagy related proteins. They contain two phosphatidylinositolphosphate (PIP) binding sites and a conserved FRRG motif is essential for PIP binding. Here we present the 2.0 Å resolution crystal structure of the PROPPIN Atg18 from Pichia angusta. We designed cysteine mutants for labelling with the fluorescence dyes to probe the distances of the mutants to the membrane. These measurements support a model for PROPPIN-membrane binding, where the PROPPIN sits in a perpendicular or slightly tilted orientation on the membrane. Stopped-flow measurements suggest that initial PROPPIN-membrane binding is driven by non-specific PIP interactions. The FRRG motif then retains the protein in the membrane by binding two PIP molecules as evident by a lower dissociation rate for Atg18 in comparison with its PIP binding deficient FTTG mutant. We demonstrate that the amine-specific cross-linker Bis(sulfosuccinimidyl)suberate (BS3), which is used for protein-protein cross-linking can also be applied for cross-linking proteins and phosphatidylethanolamine (PE). Cross-linking experiments with liposome bound Atg18 yielded several PE cross-linked peptides. We also observed intermolecular cross-linked peptides, which indicated Atg18 oligomerization. FRET-based stopped-flow measurements revealed that Atg18 rapidly oligomerizes upon membrane binding while it is mainly monomeric in solution.
Overview
The claims and statistics of this paper haven’t been checked yet.
Run the check — free, no account needed. It reads the open-access text and checks the sources it cites.
Integrity signals
Registry
Cites
Statistics
Figures
Verification
Claims the paper makes
The claims and statistics of this paper haven’t been checked yet.
Run the check — free, no account needed. It reads the open-access text and checks the sources it cites.
Claims other papers make about this one
Each is checked against this paper’s own text: does it say what the citing paper says it does?
In the citing paper
“and in C. elegans EPG-6/WDR45/WIPI4 has been identified as the WIPI homolog required for autophagy [839].”
From Guidelines for the use and interpretation of assays for monitoring autophagy (4th edition) 1 (2021) · cites this paper as [839]
Self-check
Percentages, sums and reported differences re-computed from the paper’s own numbers.
The self-check needs the paper’s full text.
Citations
Cites
Guan, J., Stromhaug, P. E., George, M. D., Habibzadegah-Tari, P., Bevan, A., Dunn, W. A., & Klionsky, D. J. (2001) · Molecular Biology of the Cell · doi:10.1091/mbc.12.12.3821 · Cited by 204
Grimm, M., Zimniak, T., Kahraman, A., & Herzog, F. (2015) · Nucleic Acids Research · doi:10.1093/nar/gkv463 · Cited by 121
Research works printed but not linked: 47
- Wen, X. & Klionsky, D. J. An overview of macroautophagy in yeast. J Mol Biol 428, 1681–1699 (2016). · DOI
- Dove, S. K., Dong, K., Kobayashi, T., Williams, F. K. & Michell, R. H. Phosphatidylinositol 3,5-bisphosphate and Fab1p/PIKfyve underPPIn endo-lysosome function. Biochem J 419, 1–13 (2009). · DOI
- Proikas-Cezanne, T. et al. WIPI-1alpha (WIPI49), a member of the novel 7-bladed WIPI protein family, is aberrantly expressed in human cancer and is linked to starvation-induced autophagy. Oncogene 23, 9314–9325 (2004). · DOI · Paper page
- Polson, H. E. et al. Mammalian Atg18 (WIPI2) localizes to omegasome-anchored phagophores and positively regulates LC3 lipidation. Autophagy 6 (2010). · DOI · Paper page
- Barth, H., Meiling-Wesse, K., Epple, U. D. & Thumm, M. Autophagy and the cytoplasm to vacuole targeting pathway both require Aut10p. FEBS Lett 508, 23–28 (2001). · DOI · Paper page
- Stromhaug, P. E., Reggiori, F., Guan, J., Wang, C. W. & Klionsky, D. J. Atg21 is a phosphoinositide binding protein required for efficient lipidation and localization of Atg8 during uptake of aminopeptidase I by selective autophagy. Mol Biol Cell 15, 3553–3566 (2004). · DOI
- Krick, R. et al. Piecemeal microautophagy of the nucleus requires the core macroautophagy genes. Mol Biol Cell 19, 4492–4505 (2008). · DOI
- Dove, S. K. et al. Svp1p defines a family of phosphatidylinositol 3,5-bisphosphate effectors. EMBO J 23, 1922–1933 (2004). · DOI
- Krick, R., Tolstrup, J., Appelles, A., Henke, S. & Thumm, M. The relevance of the phosphatidylinositolphosphat-binding motif FRRGT of Atg18 and Atg21 for the Cvt pathway and autophagy. FEBS Lett 580, 4632–4638 (2006). · DOI
- Nair, U., Cao, Y., Xie, Z. & Klionsky, D. J. Roles of the lipid-binding motifs of Atg18 and Atg21 in the cytoplasm to vacuole targeting pathway and autophagy. J Biol Chem 285, 11476–11488 (2010). · DOI
- Jeffries, T. R., Dove, S. K., Michell, R. H. & Parker, P. J. PtdIns-specific MPR pathway association of a novel WD40 repeat protein, WIPI49. Mol Biol Cell 15, 2652–2663 (2004). · DOI
- Krick, R. et al. Structural and functional characterization of the two phosphoinositide binding sites of PROPPINs, a beta-propeller protein family. Proc Natl Acad Sci USA 109, E2042–2049 (2012). · DOI
- Baskaran, S., Ragusa, M. J., Boura, E. & Hurley, J. H. Two-Site Recognition of Phosphatidylinositol 3-Phosphate by PROPPINs in Autophagy. Mol Cell 47, 339–348 (2012). · DOI
- Watanabe, Y. et al. Structure-based Analyses Reveal Distinct Binding Sites for Atg2 and Phosphoinositides in Atg18. J Biol Chem 287, 31681–31690 (2012). · DOI
- Busse, R. A. et al. Characterization of PROPPIN-Phosphoinositide Binding and Role of Loop 6CD in PROPPIN-Membrane Binding. Biophys J 108, 2223–2234 (2015). · DOI
- Tamura, N. et al. Atg18 phosphoregulation controls organellar dynamics by modulating its phosphoinositide-binding activity. J Cell Biol 202, 685–698 (2013). · DOI
- Reggiori, F., Tucker, K. A., Stromhaug, P. E. & Klionsky, D. J. The Atg1-Atg13 complex regulates Atg9 and Atg23 retrieval transport from the pre-autophagosomal structure. Dev Cell 6, 79–90 (2004). · DOI · Paper page
- Obara, K., Sekito, T., Niimi, K. & Ohsumi, Y. The Atg18-Atg2 complex is recruited to autophagic membranes via phosphatidylinositol 3-phosphate and exerts an essential function. J Biol Chem 283, 23972–23980 (2008). · DOI
- Rieter, E. et al. Atg18 function in autophagy is regulated by specific sites within its beta-propeller. J Cell Sci 126, 593–604 (2013). · DOI
- Dooley, H. C. et al. WIPI2 links LC3 conjugation with PI3P, autophagosome formation, and pathogen clearance by recruiting Atg12-5-16L1. Mol Cell 55, 238–252 (2014). · DOI
- Krick, R., Henke, S., Tolstrup, J. & Thumm, M. Dissecting the localization and function of Atg18, Atg21 and Ygr223c. Autophagy 4, 896–910 (2008). · DOI
- Efe, J. A., Botelho, R. J. & Emr, S. D. Atg18 regulates organelle morphology and Fab1 kinase activity independent of its membrane recruitment by phosphatidylinositol 3,5-bisphosphate. Mol Biol Cell 18, 4232–4244 (2007). · DOI
- Jin, N. et al. VAC14 nucleates a protein complex essential for the acute interconversion of PI3P and PI(3,5)P(2) in yeast and mouse. EMBO J 27, 3221–3234 (2008). · DOI
- Scacioc, A. Structural, biochemical and computational studies on PROPPINs, proteins important in autophagy, Doctoral thesis (Göttingen Graduate School for Neurosciences, Biophysics and Molecular Biosciences). http://hdl.handle.net/11858/00-1735-0000-0028-8675-3 (2015).
- Yang, B. et al. Identification of cross-linked peptides from complex samples. Nat Methods 9, 904–906 (2012). · DOI
- Liko, I., Allison, T. M., Hopper, J. T. & Robinson, C. V. Mass spectrometry guided structural biology. Curr Opin Struct Biol 40, 136–144 (2016). · DOI
- Sobott, F., Hernandez, H., McCammon, M. G., Tito, M. A. & Robinson, C. V. A tandem mass spectrometer for improved transmission and analysis of large macromolecular assemblies. Anal Chem 74, 1402–1407 (2002). · DOI · Paper page
- Cox, J. & Mann, M. MaxQuant enables high peptide identification rates, individualized p.p.b.-range mass accuracies and proteome-wide protein quantification. Nat Biotechnol 26, 1367–1372 (2008). · DOI · Paper page
- Kalkhof, S. & Sinz, A. Chances and pitfalls of chemical cross-linking with amine-reactive N-hydroxysuccinimide esters. Anal Bioanal Chem 392, 305–312 (2008). · DOI
- Thomas, C. C., Dowler, S., Deak, M., Alessi, D. R. & van Aalten, D. M. Crystal structure of the phosphatidylinositol 3,4-bisphosphate-binding pleckstrin homology (PH) domain of tandem PH-domain-containing protein 1 (TAPP1): molecular basis of lipid specificity. Biochem J 358, 287–294 (2001). · DOI
- Mao, Y. et al. Crystal structure of the VHS and FYVE tandem domains of Hrs, a protein involved in membrane trafficking and signal transduction. Cell 100, 447–456 (2000). · DOI
- Bernasconi, C. F. Relaxation kinetics. Academic Press, New York. (1976).
- Sinz, A. Chemical cross-linking and mass spectrometry to map three-dimensional protein structures and protein-protein interactions. Mass Spectrom Rev 25, 663–682 (2006). · DOI
- Rappsilber, J. The beginning of a beautiful friendship: cross-linking/mass spectrometry and modelling of proteins and multi-protein complexes. J Struct Biol 173, 530–540 (2011). · DOI
- Suzuki, K., Akioka, M., Kondo-Kakuta, C., Yamamoto, H. & Ohsumi, Y. Fine mapping of autophagy-related proteins during autophagosome formation in Saccharomyces cerevisiae. J Cell Sci 126, 2534–2544 (2013). · DOI
- Van Duyne, G. D., Standaert, R. F., Karplus, P. A., Schreiber, S. L. & Clardy, J. Atomic structures of the human immunophilin FKBP-12 complexes with FK506 and rapamycin. J Mol Biol 229, 105–124 (1993). · DOI
- Kabsch, W. Automatic Processing of Rotation Diffraction Data from Crystals of Initially Unknown Symmetry and Cell Constants. Journal of Applied Crystallography 26, 795–800 (1993). · DOI
- McCoy, A. J. et al. Phaser crystallographic software. J Appl Crystallogr 40, 658–674 (2007). · DOI · Paper page
- Emsley, P. & Cowtan, K. Coot: model-building tools for molecular graphics. Acta Crystallographica Section D-Biological Crystallography 60, 2126–2132 (2004). · DOI · Paper page
- Murshudov, G. N., Vagin, A. A. & Dodson, E. J. Refinement of macromolecular structures by the maximum-likelihood method. Acta Crystallographica Section D-Biological Crystallography 53, 240–255 (1997). · DOI
- Adams, P. D. et al. PHENIX: a comprehensive Python-based system for macromolecular structure solution. Acta Crystallogr D Biol Crystallogr 66, 213–221 (2010). · DOI · Paper page
- Wallace, A. C., Laskowski, R. A. & Thornton, J. M. Ligplot - a Program to Generate Schematic Diagrams of Protein Ligand Interactions. Protein Engineering 8, 127–134 (1995). · DOI
- Sievers, F. et al. Fast, scalable generation of high-quality protein multiple sequence alignments using Clustal Omega. Mol Syst Biol 7, 539 (2011). · DOI
- Landau, M. et al. ConSurf 2005: the projection of evolutionary conservation scores of residues on protein structures. Nucleic Acids Res 33, W299–302 (2005). · DOI
- Busse, R. A. et al. Analyzing Protein-Phosphoinositide Interactions with Liposome Flotation Assays. Methods Mol Biol 1376, 155–162 (2016). · DOI
- Olsen, J. V. et al. Parts per million mass accuracy on an Orbitrap mass spectrometer via lock mass injection into a C-trap. Mol Cell Proteomics 4, 2010–2021 (2005). · DOI
- Hernandez, H. & Robinson, C. V. Determining the stoichiometry and interactions of macromolecular assemblies from mass spectrometry. Nat Protoc 2, 715–726 (2007). · DOI
Cited by
Sorted by citations
Guidelines for the use and interpretation of assays for monitoring autophagy (4th edition) 1
Klionsky, D. J., Abdel-Aziz, A. K., Abdelfatah, S., Abdellatif, M., Abdoli, A., Abel, S., Abeliovich, H., Abildgaard, M. H., Abudu, Y. P., Acevedo-Arozena, A., et al. (2021) · Autophagy · doi:10.1080/15548627.2020.1797280 · Cited by 2,897
Self-citationExpression of WIPI2B counteracts age-related decline in autophagosome biogenesis in neurons
Stavoe, A. K., Gopal, P. P., Gubas, A., Tooze, S. A., & Holzbaur, E. L. (2019) · eLife · doi:10.7554/elife.44219 · Cited by 82
Metadata
- Authors
- Scacioc, A., Schmidt, C., Hofmann, T., Urlaub, H., Kühnel, K., & Pérez-Lara, Á.
- Venue
- Scientific Reports
- Published
- 2017-10-25
- Volume
- 7
- Issue
- 1
- ISSN
- 2045-2322
- PMC
- PMC5656675
- Cited by
- 44
- References
- 2
- Language
- en
About these checks
Registry, retraction, Cites and statistics results are computed, not judged, with one exception: a printed reference that no index lists is read once by a model before it counts as a citation error. Claims are extracted by a model and kept only when their quote appears verbatim in the text; each cited source is then checked, with a model’s help, for whether it says what the claim relies on. Those verdicts can be wrong — read the claim’s quote and the cited source before relying on one.
Statistics and arithmetic are recomputed, not judged.
Confidence bands are shown only for fields calibrated on our annotated test set. None is calibrated yet, so no band is shown.
What counts as a claim ›How we measure confidence ›How we check this ›
Are you an author, or do you see a problem with this page? Request a review
