

The DOI matches its Crossref record; 9 of the 9 references it cites were found in a registry or an index.
Voxel-wise comparisons of cellular microstructure and diffusion-MRI in mouse hippocampus using 3D Bridging of Optically-clear histology with Neuroimaging Data (3D-BOND)
Abstract
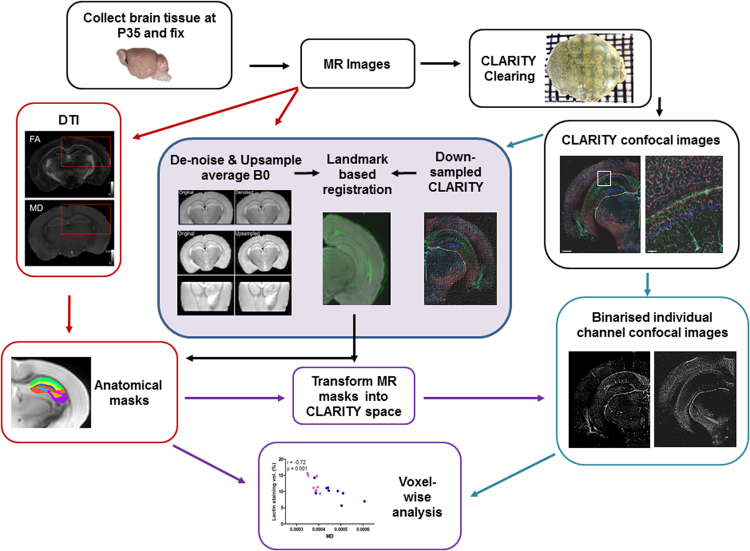
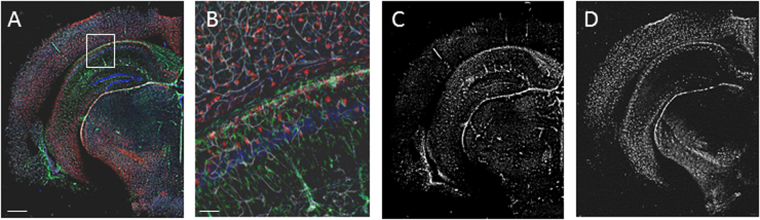
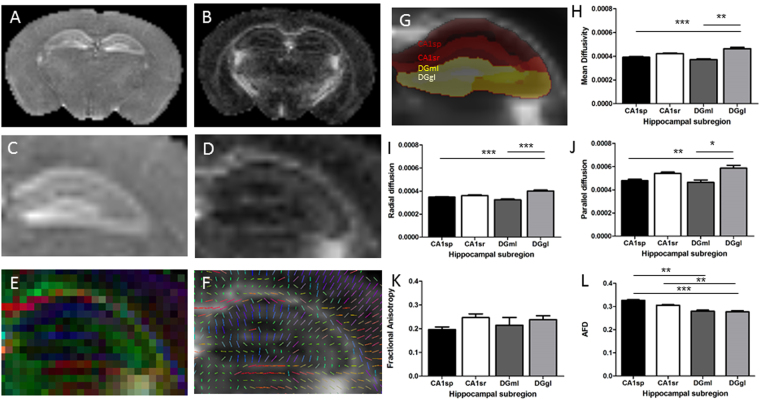
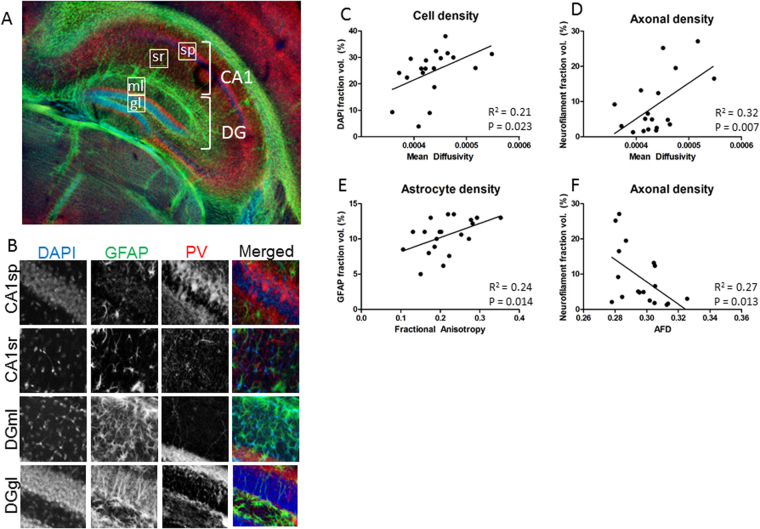
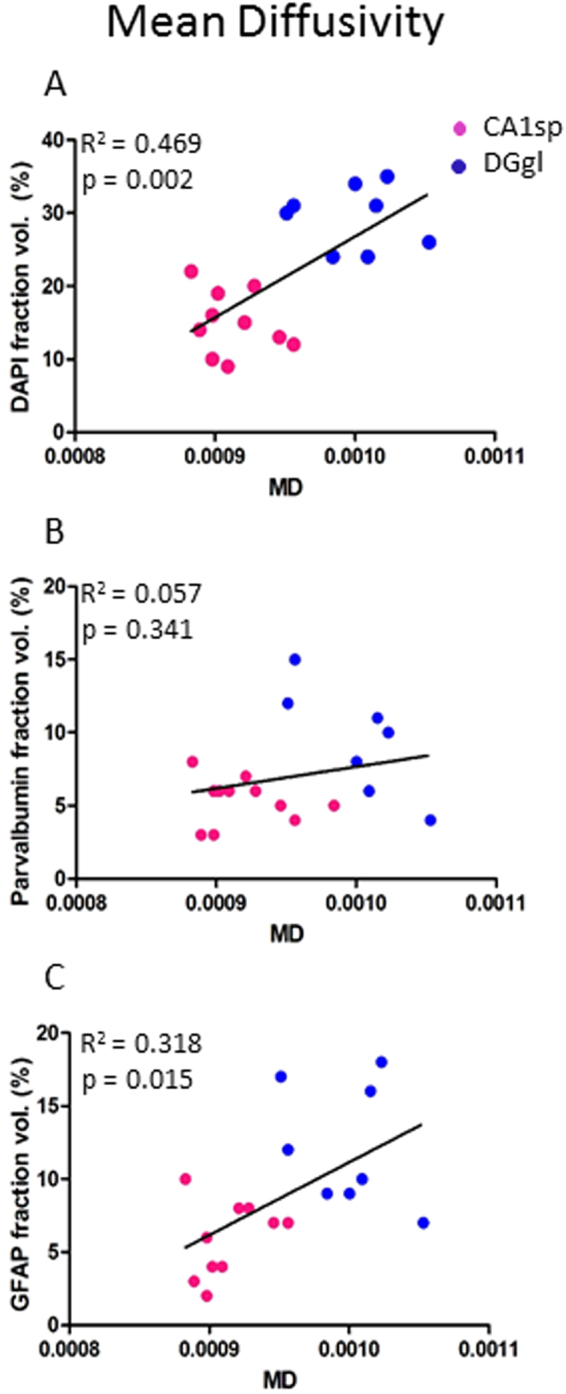
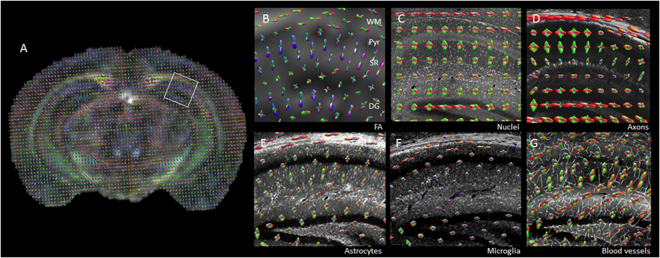
A key challenge in medical imaging is determining a precise correspondence between image properties and tissue microstructure. This comparison is hindered by disparate scales and resolutions between medical imaging and histology. We present a new technique, 3D Bridging of Optically-clear histology with Neuroimaging Data (3D-BOND), for registering medical images with 3D histology to overcome these limitations. Ex vivo 120 × 120 × 200 μm resolution diffusion-MRI (dMRI) data was acquired at 7 T from adult C57Bl/6 mouse hippocampus. Tissue was then optically cleared using CLARITY and stained with cellular markers and confocal microscopy used to produce high-resolution images of the 3D-tissue microstructure. For each sample, a dense array of hippocampal landmarks was used to drive registration between upsampled dMRI data and the corresponding confocal images. The cell population in each MRI voxel was determined within hippocampal subregions and compared to MRI-derived metrics. 3D-BOND provided robust voxel-wise, cellular correlates of dMRI data. CA1 pyramidal and dentate gyrus granular layers had significantly different mean diffusivity (p > 0.001), which was related to microstructural features. Overall, mean and radial diffusivity correlated with cell and axon density and fractional anisotropy with astrocyte density, while apparent fibre density correlated negatively with axon density. Astrocytes, axons and blood vessels correlated to tensor orientation.
Overview
The claims and statistics of this paper haven’t been checked yet.
Run the check — free, no account needed. It reads the open-access text and checks the sources it cites.
Integrity signals
Registry
Cites
Statistics
Figures
Verification
Claims the paper makes
The claims and statistics of this paper haven’t been checked yet.
Run the check — free, no account needed. It reads the open-access text and checks the sources it cites.
Claims other papers make about this one
Each is checked against this paper’s own text: does it say what the citing paper says it does?
The cited source says what the claim attributes to it.
In the citing paper
“A previous DTI study also demonstrated that diffusivity maps can be used to delineate cell-dense regions such as the granule cell layer55”
From A spatial imaging-transcriptomics paradigm for deciphering the molecular basis of microscopic MRI in the normal brain and Alzheimer’s disease (2025) · cites this paper as [37]
Self-check
Percentages, sums and reported differences re-computed from the paper’s own numbers.
The self-check needs the paper’s full text.
Citations
Cites
NODDI: Practical in vivo neurite orientation dispersion and density imaging of the human brain
Zhang, H., Schneider, T., Wheeler-Kingshott, C. A., & Alexander, D. C. (2012) · NeuroImage · doi:10.1016/j.neuroimage.2012.03.072 · Cited by 3,288
White matter integrity, fiber count, and other fallacies: The do's and don'ts of diffusion MRI
Jones, D. K., Knösche, T. R., & Turner, R. (2013) · NeuroImage · doi:10.1016/j.neuroimage.2012.06.081 · Cited by 2,402
Structural and molecular interrogation of intact biological systems
Chung, K., Wallace, J., Kim, S.-Y., Kalyanasundaram, S., Andalman, A. S., Davidson, T. J., Mirzabekov, J. J., Zalocusky, K. A., Mattis, J., Denisin, A. K., et al. (2013) · Nature · doi:10.1038/nature12107 · Cited by 2,008
Budde, M. D., Janes, L., Gold, E., Turtzo, L. C., & Frank, J. A. (2011) · Brain · doi:10.1093/brain/awr161 · Cited by 408
Effectiveness of regional DTI measures in distinguishing Alzheimer’s disease, MCI, and normal aging
Nir, T. M., Jahanshad, N., Villalon-Reina, J. E., Toga, A. W., Jack, C. R., Weiner, M. W., & Thompson, P. M. (2013) · NeuroImage: Clinical · doi:10.1016/j.nicl.2013.07.006 · Cited by 348
Chang, E. H., Argyelan, M., Aggarwal, M., Chandon, T.-S. S., Karlsgodt, K. H., Mori, S., & Malhotra, A. K. (2017) · NeuroImage · doi:10.1016/j.neuroimage.2016.11.068 · Cited by 186
Histological validation of high-resolution DTI in human post mortem tissue
Seehaus, A., Roebroeck, A., Bastiani, M., Fonseca, L., Bratzke, H., Lori, N., Vilanova, A., Goebel, R., & Galuske, R. (2015) · Frontiers in Neuroanatomy · doi:10.3389/fnana.2015.00098 · Cited by 149
In vivo imaging of tau pathology using multi-parametric quantitative MRI
Wells, J. A., O'Callaghan, J. M., Holmes, H. E., Powell, N. M., Johnson, R. A., Siow, B., Torrealdea, F., Ismail, O., Walker-Samuel, S., Golay, X., et al. (2015) · NeuroImage · doi:10.1016/j.neuroimage.2015.02.023 · Cited by 93
Functional diffusion tensor imaging at 3 Tesla
Mandl, R. (2013) · Frontiers in Human Neuroscience · doi:10.3389/fnhum.2013.00817 · Cited by 18
Research works printed but not linked: 37
- Trojsi, F. et al. Microstructural changes across different clinical milestones of disease in amyotrophic lateral sclerosis. PloS one 10, e0119045, https://doi.org/10.1371/journal.pone.0119045 (2015). · DOI
- Labate, A. et al. White matter abnormalities differentiate severe from benign temporal lobe epilepsy. Epilepsia 56, 1109–1116, https://doi.org/10.1111/epi.13027 (2015). · DOI
- Zhang, B., Xu, Y., Zhu, B. & Kantarci, K. The role of diffusion tensor imaging in detecting microstructural changes in prodromal Alzheimer’s disease. CNS neuroscience & therapeutics 20, 3–9, https://doi.org/10.1111/cns.12166 (2014). · DOI
- Mollink, J. et al. Evaluating fibre orientation dispersion in white matter: Comparison of diffusion MRI, histology and polarized light imaging. Neuroimage. https://doi.org/10.1016/j.neuroimage.2017.06.001 (2017). · DOI
- Becker, K., Jahrling, N., Saghafi, S., Weiler, R. & Dodt, H. U. Chemical clearing and dehydration of GFP expressing mouse brains. PLoS One 7, e33916, https://doi.org/10.1371/journal.pone.0033916 (2012). · DOI
- Erturk, A. et al. Three-dimensional imaging of solvent-cleared organs using 3DISCO. Nat Protoc 7, 1983–1995, https://doi.org/10.1038/nprot.2012.119 (2012). · DOI
- Hama, H. et al. Scale: a chemical approach for fluorescence imaging and reconstruction of transparent mouse brain. Nat Neurosci 14, 1481–1488, https://doi.org/10.1038/nn.2928 (2011). · DOI
- Ke, M. T., Fujimoto, S. & Imai, T. SeeDB: a simple and morphology-preserving optical clearing agent for neuronal circuit reconstruction. Nat Neurosci 16, 1154–1161, https://doi.org/10.1038/nn.3447 (2013). · DOI
- Yang, B. et al. Single-cell phenotyping within transparent intact tissue through whole-body clearing. Cell 158, 945–958, https://doi.org/10.1016/j.cell.2014.07.017 (2014). · DOI
- Dodt, H. U. et al. Ultramicroscopy: three-dimensional visualization of neuronal networks in the whole mouse brain. Nature methods 4, 331–336, https://doi.org/10.1038/nmeth1036 (2007). · DOI
- Tomer, R., Ye, L., Hsueh, B. & Deisseroth, K. Advanced CLARITY for rapid and high-resolution imaging of intact tissues. Nat Protoc 9, 1682–1697, https://doi.org/10.1038/nprot.2014.123 (2014). · DOI · Paper page
- Renier, N. et al. iDISCO: a simple, rapid method to immunolabel large tissue samples for volume imaging. Cell 159, 896–910, https://doi.org/10.1016/j.cell.2014.10.010 (2014). · DOI
- Susaki, E. A. et al. Advanced CUBIC protocols for whole-brain and whole-body clearing and imaging. Nat Protoc 10, 1709–1727, https://doi.org/10.1038/nprot.2015.085 (2015). · DOI
- Manjon, J. V. et al. Diffusion weighted image denoising using overcomplete local PCA. PLoS One 8, e73021, https://doi.org/10.1371/journal.pone.0073021 (2013). · DOI
- Jenkinson, M., Beckmann, C. F., Behrens, T. E., Woolrich, M. W. & Smith, S. M. Fsl. Neuroimage 62, 782–790, https://doi.org/10.1016/j.neuroimage.2011.09.015 (2012). · DOI · Paper page
- Manjon, J. V., Coupe, P., Buades, A., Louis Collins, D. & Robles, M. New methods for MRI denoising based on sparseness and self-similarity. Medical image analysis 16, 18–27, https://doi.org/10.1016/j.media.2011.04.003 (2012). · DOI
- Manjon, J. V., Coupe, P., Buades, A., Collins, D. L. & Robles, M. MRI superresolution using self-similarity and image priors. International journal of biomedical imaging 2010, 425891, https://doi.org/10.1155/2010/425891 (2010). · DOI
- Rueckert, D., Frangi, A. F. & Schnabel, J. A. Automatic construction of 3-D statistical deformation models of the brain using nonrigid registration. IEEE transactions on medical imaging 22, 1014–1025, https://doi.org/10.1109/TMI.2003.815865 (2003). · DOI
- Schilling, K. et al. Comparison of 3D orientation distribution functions measured with confocal microscopy and diffusion MRI. Neuroimage 129, 185–197, https://doi.org/10.1016/j.neuroimage.2016.01.022 (2016). · DOI
- Tournier, J. D., Calamante, F. & Connelly, A. Robust determination of the fibre orientation distribution in diffusion MRI: non-negativity constrained super-resolved spherical deconvolution. Neuroimage 35, 1459–1472, https://doi.org/10.1016/j.neuroimage.2007.02.016 (2007). · DOI
- Dyrby, T. B. et al. An ex vivo imaging pipeline for producing high-quality and high-resolution diffusion-weighted imaging datasets. Human brain mapping 32, 544–563, https://doi.org/10.1002/hbm.21043 (2011). · DOI
- Wu, D. & Zhang, J. In vivo mapping of macroscopic neuronal projections in the mouse hippocampus using high-resolution diffusion MRI. Neuroimage 125, 84–93, https://doi.org/10.1016/j.neuroimage.2015.10.051 (2016). · DOI
- Bruce, I. P., Chang, H. C., Petty, C., Chen, N. K. & Song, A. W. 3D-MB-MUSE: A robust 3D multi-slab, multi-band and multi-shot reconstruction approach for ultrahigh resolution diffusion MRI. Neuroimage 159, 46–56, https://doi.org/10.1016/j.neuroimage.2017.07.035 (2017). · DOI
- Feng, L. et al. Population-averaged macaque brain atlas with high-resolution ex vivo DTI integrated into in vivo space. Brain Struct Funct 222, 4131–4147, https://doi.org/10.1007/s00429-017-1463-6 (2017). · DOI
- Sepehrband, F. et al. Brain tissue compartment density estimated using diffusion-weighted MRI yields tissue parameters consistent with histology. Human brain mapping 36, 3687–3702, https://doi.org/10.1002/hbm.22872 (2015). · DOI · Paper page
- Hutchinson, E. B., Schwerin, S. C., Avram, A. V., Juliano, S. L. & Pierpaoli, C. Diffusion MRI and the detection of alterations following traumatic brain injury. J Neurosci Res. https://doi.org/10.1002/jnr.24065 (2017). · DOI
- Jacobs, M. A., Windham, J. P., Soltanian-Zadeh, H., Peck, D. J. & Knight, R. A. Registration and warping of magnetic resonance images to histological sections. Med Phys 26, 1568–1578, https://doi.org/10.1118/1.598671 (1999). · DOI
- Aggarwal, M., Burnsed, J., Martin, L. J., Northington, F. J. & Zhang, J. Imaging neurodegeneration in the mouse hippocampus after neonatal hypoxia-ischemia using oscillating gradient diffusion MRI. Magn Reson Med 72, 829–840, https://doi.org/10.1002/mrm.24956 (2014). · DOI
- Khan, A. R. et al. 3D structure tensor analysis of light microscopy data for validating diffusion MRI. Neuroimage 111, 192–203, https://doi.org/10.1016/j.neuroimage.2015.01.061 (2015). · DOI
- Silva, A. C., Williams, D. S. & Koretsky, A. P. Evidence for the exchange of arterial spin-labeled water with tissue water in rat brain from diffusion-sensitized measurements of perfusion. Magn Reson Med 38, 232–237 (1997). · DOI
- Lee, S. P., Silva, A. C., Ugurbil, K. & Kim, S. G. Diffusion-weighted spin-echo fMRI at 9.4 T: microvascular/tissue contribution to BOLD signal changes. Magn Reson Med 42, 919–928 (1999). · DOI
- Xu, G. et al. Radial coherence of diffusion tractography in the cerebral white matter of the human fetus: neuroanatomic insights. Cerebral cortex 24, 579–592, https://doi.org/10.1093/cercor/bhs330 (2014). · DOI
- Blumenfeld-Katzir, T., Pasternak, O., Dagan, M. & Assaf, Y. Diffusion MRI of structural brain plasticity induced by a learning and memory task. PLoS One 6, e20678, https://doi.org/10.1371/journal.pone.0020678 (2011). · DOI
- Singh, K., Trivedi, R., Devi, M. M., Tripathi, R. P. & Khushu, S. Longitudinal changes in the DTI measures, anti-GFAP expression and levels of serum inflammatory cytokines following mild traumatic brain injury. Exp Neurol 275(Pt 3), 427–435, https://doi.org/10.1016/j.expneurol.2015.07.016 (2016). · DOI
- Goubran, M. et al. In vivo MRI signatures of hippocampal subfield pathology in intractable epilepsy. Human brain mapping 37, 1103–1119, https://doi.org/10.1002/hbm.23090 (2016). · DOI
- Jeurissen, B., Tournier, J. D., Dhollander, T., Connelly, A. & Sijbers, J. Multi-tissue constrained spherical deconvolution for improved analysis of multi-shell diffusion MRI data. Neuroimage 103, 411–426, https://doi.org/10.1016/j.neuroimage.2014.07.061 (2014). · DOI
- Errico, C. et al. Ultrafast ultrasound localization microscopy for deep super-resolution vascular imaging. Nature 527, 499–502, https://doi.org/10.1038/nature16066 (2015). · DOI
Cited by
Sorted by citations
Callow, D. D., Won, J., Pena, G. S., Jordan, L. S., Arnold-Nedimala, N. A., Kommula, Y., Nielson, K. A., & Smith, J. C. (2021) · Frontiers in Aging Neuroscience · doi:10.3389/fnagi.2021.645258 · Cited by 27
Shen, Y., Shen, Y., Wang, M., Jin, K., Yang, P., Cao, Z., Zhu, Q., Zhao, Z., Li, H., Han, L., et al. (2025) · Cell Reports · doi:10.1016/j.celrep.2025.116073 · Cited by 16
Metadata
- Authors
- Stolp, H. B., Ball, G., So, P.-W., Tournier, J.-D., Jones, M., Thornton, C., & Edwards, A. D.
- Venue
- Scientific Reports
- Published
- 2018-03-05
- Volume
- 8
- Issue
- 1
- ISSN
- 2045-2322
- PMC
- PMC5838167
- Cited by
- 59
- References
- 9
- Language
- en
About these checks
Registry, retraction, Cites and statistics results are computed, not judged, with one exception: a printed reference that no index lists is read once by a model before it counts as a citation error. Claims are extracted by a model and kept only when their quote appears verbatim in the text; each cited source is then checked, with a model’s help, for whether it says what the claim relies on. Those verdicts can be wrong — read the claim’s quote and the cited source before relying on one.
Statistics and arithmetic are recomputed, not judged.
Confidence bands are shown only for fields calibrated on our annotated test set. None is calibrated yet, so no band is shown.
What counts as a claim ›How we measure confidence ›How we check this ›
Are you an author, or do you see a problem with this page? Request a review
