

The DOI matches its Crossref record.
Simulating human exposure to indoor airborne microplastics using a Breathing Thermal Manikin
Abstract
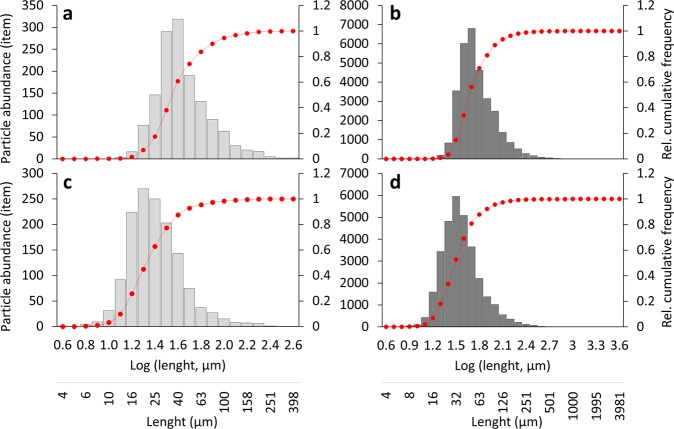
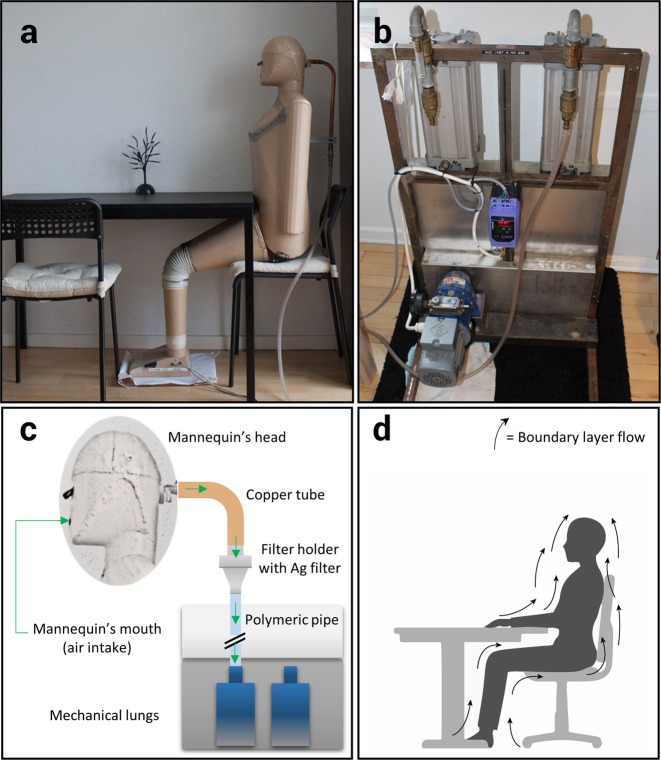
Humans are potentially exposed to microplastics through food, drink, and air. The first two pathways have received quite some scientific attention, while little is known about the latter. We address the exposure of humans to indoor airborne microplastics using a Breathing Thermal Manikin. Three apartments were investigated, and samples analysed through FPA-µFTIR-Imaging spectroscopy followed by automatic analyses down to 11 µm particle size. All samples were contaminated with microplastics, with concentrations between 1.7 and 16.2 particles m −3 . Synthetic fragments and fibres accounted, on average, for 4% of the total identified particles, while nonsynthetic particles of protein and cellulose constituted 91% and 4%, respectively. Polyester was the predominant synthetic polymer in all samples (81%), followed by polyethylene (5%), and nylon (3%). Microplastics were typically of smaller size than nonsynthetic particles. As the identified microplastics can be inhaled, these results highlight the potential direct human exposure to microplastic contamination via indoor air.
Overview
The claims and statistics of this paper haven’t been checked yet.
Run the check — free, no account needed. It reads the open-access text and checks the sources it cites.
Integrity signals
Registry
Cites
Statistics
Figures
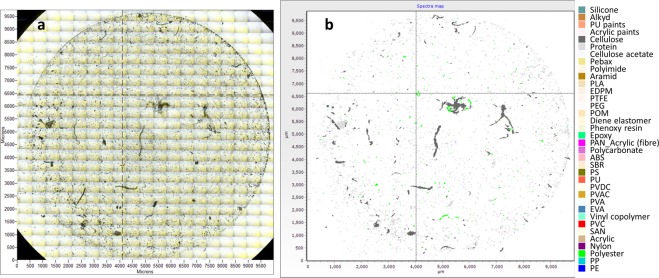
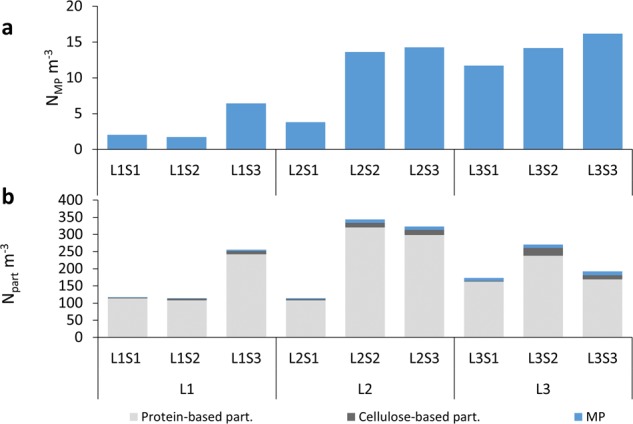
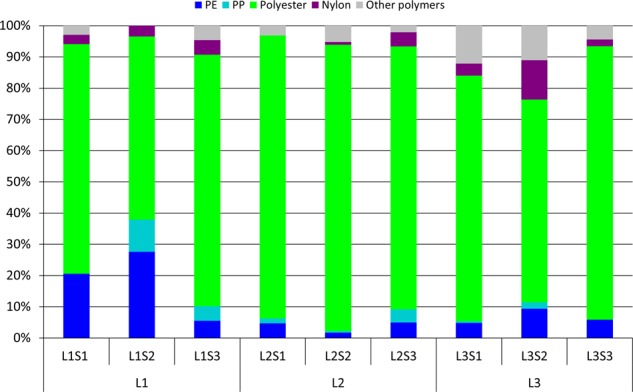
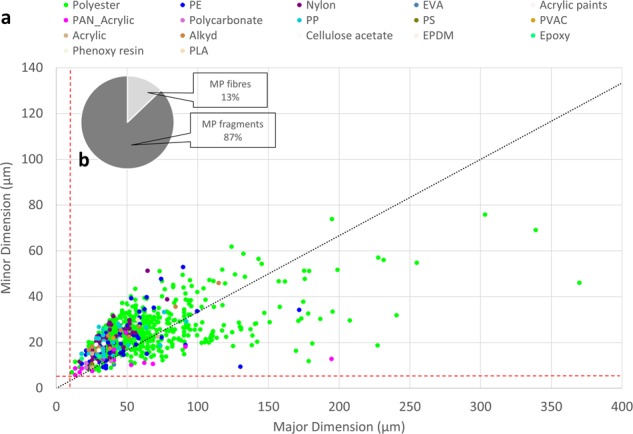
Verification
Claims the paper makes
The claims and statistics of this paper haven’t been checked yet.
Run the check — free, no account needed. It reads the open-access text and checks the sources it cites.
Claims other papers make about this one
Each is checked against this paper’s own text: does it say what the citing paper says it does?
In the citing paper
“Both FPA-FTIR and Raman spectroscopy methods can be used to determine MP composition, size and morphology, with detection limits of 10 mm (Joachim et al. 2015;Vianello et al. 2019) and ! 2 mm (Ballent et al. 2016;Enders et al. 2015;Fr ere et al. 2016;Zada et al. 2018), respectively.”
From Microplastics and nanoplastics science: collecting and characterizing airborne microplastics in fine particulate matter (2021) · cites this paper as Vianello et al. 2019
In the citing paper
“However, very few studies have used FPA-FTIR or mFTIR to detect MP smaller than $10 mm (Vianello et al. 2019).”
From Microplastics and nanoplastics science: collecting and characterizing airborne microplastics in fine particulate matter (2021) · cites this paper as Vianello et al. 2019
In the citing paper
“Studies on the effects of microplastics on the human body are limited, but exposure to high concentrations of plastic particles has been linked to occupational diseases in industrial workers.”
From Exploring Personal Exposure to Airborne Microplastics across Various Work Environments in Pathum Thani Province, Thailand (2023) · cites this paper as [9]
In the citing paper
“Prata (2018) investigated diseases found in workers from three types of industries—synthetic textile, flocking, and polyvinyl chloride industries—and reported symptoms among workers such as throat irritation, shortness of breath, cough, and chest pain. These symptoms, along with signs of chronic inflammation and irritation, may lead to lung fibrosis or even cancer [9,10].”
From Exploring Personal Exposure to Airborne Microplastics across Various Work Environments in Pathum Thani Province, Thailand (2023) · cites this paper as [9]
Self-check
Percentages, sums and reported differences re-computed from the paper’s own numbers.
The self-check needs the paper’s full text.
Citations
Cites
No references could be resolved yet.
Research works printed but not linked: 43
- Thompson, R. C. Lost at Sea: Where Is All the Plastic? Science (80-.). 304, 838–838, https://doi.org/10.1126/science.1094559 (2004). · DOI · Paper page
- Waring, R. H., Harris, R. M. & Mitchell, S. C. Plastic contamination of the food chain: A threat to human health? Maturitas 115, 64–68, https://doi.org/10.1016/j.maturitas.2018.06.010 (2018). · DOI · Paper page
- Barnes, D. Ka, Galgani, F., Thompson, R. C. & Barlaz, M. Accumulation and fragmentation of plastic debris in global environments. Philos. Trans. R. Soc. Lond. B. Biol. Sci. 364, 1985–1998 (2009). · DOI · Paper page
- Villarrubia-Gómez, P., Cornell, S. E. & Fabres, J. Marine plastic pollution as a planetary boundary threat – The drifting piece in the sustainability puzzle. Mar. Policy 0–1, https://doi.org/10.1016/j.marpol.2017.11.035 (2018). · DOI · Paper page
- Browne, M. A. et al. Accumulation of microplastic on shorelines woldwide: Sources and sinks. Environ. Sci. Technol. 45, 9175–9179, https://doi.org/10.1098/rstb.2008.0205 (2011). · DOI · Paper page
- Jan Kole, P., Löhr, A. J., Van Belleghem, F. G. A. J. & Ragas, A. M. J. Wear and tear of tyres: A stealthy source of microplastics in the environment. Int. J. Environ. Res. Public Health 14, https://doi.org/10.3390/ijerph14101265 (2017). · DOI
- Jambeck, J. R. et al. Plastic waste inputs from land into the ocean. Science (80-.). 347, 768–771, https://doi.org/10.1126/science.1260352 (2015). · DOI · Paper page
- Rist, S., Carney Almroth, B., Hartmann, N. B. & Karlsson, T. M. A critical perspective on early communications concerning human health aspects of microplastics. Sci. Total Environ. 626, 720–726, https://doi.org/10.1016/j.marpolbul.2016.01.006 (2018). · DOI
- Dris, R., Gasperi, J., Saad, M., Mirande, C. & Tassin, B. Synthetic fi bers in atmospheric fallout: A source of microplastics in the environment? MPB 104, 290–293, https://doi.org/10.1016/j.marpolbul.2016.01.006 (2016). · DOI
- Dris, R. et al. A fi rst overview of textile fibers, including microplastics, in indoor and outdoor environments*. 221, 453–458, https://doi.org/10.1016/j.envpol.2016.12.013 (2017). · DOI
- Dris, R. et al. Microplastic contamination in an urban area: A case study in Greater Paris. Environ. Chem. 12, 592–599, https://doi.org/10.1071/EN14167 (2015). · DOI · Paper page
- Gasperi, J. et al. Microplastics in air: Are we breathing it in? Curr. Opin. Environ. Sci. Heal. 1, 1–5, https://doi.org/10.1016/j.coesh.2017.10.002 (2018). · DOI · Paper page
- Warheit, D. B. et al. Potential pulmonary effects of man-made organic fiber (MMOF) dusts. Crit. Rev. Toxicol. 31, 697–736, https://doi.org/10.1080/20014091111965 (2001). · DOI
- Law, B. D., Bunn, W. B. & Hesterberg, T. W. Solubility of Polymeric Organic Fibers and Manmade Vitreous Fibers in Gambles Solution. Inhal. Toxicol. 2, 321–339, https://doi.org/10.3109/08958379009145261 (1990). · DOI · Paper page
- Eschenbacher, W. L. et al. Nylon Flock–Associated Interstitial Lung Disease. Am. J. Respir. Crit. Care Med. 159, 2003–2008, https://doi.org/10.1164/ajrccm.159.6.9808002 (1999). · DOI
- Pimentel, J. C., Avila, R. & Lourenco, A. G. Respiratory disease caused by synthetic fibres: a new occupational disease. Thorax 30, 204–219, https://doi.org/10.1136/thx.30.2.204 (1975). · DOI · Paper page
- Greim et al. Toxicity of Fibers and Particles -Report of the Workshop Held in Munich, Germany, 26–27 October 2000. Inhal. Toxicol. 13, 737–754, https://doi.org/10.1080/08958370118273 (2001). · DOI
- Rocha-Santos, T. & Duarte, A. C. A critical overview of the analytical approaches to the occurrence, the fate and the behavior of microplastics in the environment. TrAC Trends Anal. Chem. 65, 47–53, https://doi.org/10.1016/j.trac.2014.10.011 (2014). · DOI
- Loder, M. G. J., Kuczera, M. & Claudia, G. G. M. S. L. Focal plane array detector-based micro-Fourier-transform infrared imaging for the analysis of microplastics in environmental samples. CSIRO Environ. Chem. https://doi.org/10.1071/EN14205 RESEARCH (2015). · DOI
- Primpke, S., Lorenz, C., Rascher-Friesenhausen, R. & Gerdts, G. An automated approach for microplastics analysis using focal plane array (FPA) FTIR microscopy and image analysis. Anal. Methods 9, 1499–1511, https://doi.org/10.1016/j.trac.2014.10.011 (2017). · DOI
- Liu, F., Olesen, K. B., Borregaard, A. R. & Vollertsen, J. Microplastics in urban and highway stormwater retention ponds. Sci. Total Environ. 671, 992–1000, https://doi.org/10.1016/j.scitotenv.2019.03.416 (2019). · DOI
- Sexton, K., Callahan, M. A. & Bryan, E. F. Estimating exposure and dose to characterize health risks: The role of human tissue monitoring in exposure assessment. Environ. Health Perspect. 103, 13–29, https://doi.org/10.1289/ehp.95103s313 (1995). · DOI
- Topp, C., Hesselholt, P., Trier, M. R. & Nielsen, P. V. Influence of geometry of thermal manikins on concentration distribution and personal exposure. 1–6, https://doi.org/10.1080/10810730.2015.1018581 (2003). · DOI
- Clark, R. P. Skin scales among airborne particles. J. Hyg. (Lond). 72, 47–51, https://doi.org/10.1017/S0022172400023196 (1974). · DOI
- Crangle, A. 1-Types of polyolefin fibres. in The Textile Institute Book Series (ed. Ugbolue, S. C. O. B. T.-P. F. (Second E.) 3–32 (Woodhead Publishing, 2017). https://doi.org/10.1016/B978-0-08-101132-4.00001-1. · DOI
- Deitzel, J. M., McDaniel, P. & Gillespie, J. W. 7-High performance polyethylene fibers. in Structure and properties of High-PErformance Fibers. Woodhead Publishing Series in Textiles (ed. Bhat, G. B. T.-S. and P. of H.-P. F.) 167–185 (Woodhead Publishing. https://doi.org/10.1016/B978-0-08-100550-7.00007-3 (2017). · DOI
- U.S. Environmental Protection Agency. Flame Retardants Used in Flexible Polyurethane Foam: An Alternatives Asessment Update. U.S. EPA Des. Environ. EPA 744-R-, 1–441, EPA 742-R-05-002A, https://doi.org/10.1002/ejoc.201200111 (2015). · DOI
- Turner, A. Marine pollution from antifouling paint particles. Mar. Pollut. Bull. 60, 159–171, https://doi.org/10.1016/j.marpolbul.2009.12.004 (2010). · DOI
- Kaegi, R. et al. Synthetic TiO2nanoparticle emission from exterior facades into the aquatic environment. Environ. Pollut. 156, 233–239, https://doi.org/10.1016/j.envpol.2008.08.004 (2008). · DOI
- Simon, M., van Alst, N. & Vollertsen, J. Quantification of microplastic mass and removal rates at wastewater treatment plants applying Focal Plane Array (FPA)-based Fourier Transform Infrared (FT-IR) imaging. Water Res. 142, 1–9, https://doi.org/10.1016/j.watres.2018.05.019 (2018). · DOI
- Prata, J. C. Airborne microplastics: Consequences to human health? Environ. Pollut. 234, 115–126, https://doi.org/10.1016/j.envpol.2017.11.043 (2018). · DOI · Paper page
- Bivolarova, M., Kierat, W., Zavrl, E., Popiolek, Z. & Melikov, A. Effect of airflow interaction in the breathing zone on exposure to bio-effluents. Build. Environ. 125, 216–226, https://doi.org/10.1016/j.buildenv.2017.08.043 (2017). · DOI
- Nielsen, P. V., Jensen, R. L., Litewnicki, M. & Zajas, J. Experiments on the Microenvironment and Breathing of a Person in Isothermal and Stratified Surroundings. 9th Int. Conf. Exhib. 1–4, ISBN: 978-1-62276-997-1 (2009).
- Xu, C., Nielsen, P. V., Liu, L., Jensen, R. L. & Gong, G. Impacts of airflow interactions with thermal boundary layer on performance of personalized ventilation. Build. Environ. 135, 31–41, https://doi.org/10.1111/ina.12135 (2018). · DOI
- Noguchi, M., Mizukoshi, A., Yanagisawa, Y. & Yamasaki, A. Measurements of volatile organic compounds in a newly built daycare center. Int. J. Environ. Res. Public Health 13, 1–14, https://doi.org/10.1016/j.buildenv.2018.02.048 (2016). · DOI
- Ainsworth, B. E. et al. Compendium of Physical Activities: an update of activity codes and MET intensities. Med. Sci. Sport. Exerc. 32, S498–S516, https://doi.org/10.1097/00005768-200009001-00009 (2000). · DOI · Paper page
- Ghiaus, C., Allard, F. & Wilson, M. Buildings and Climate in Natural Ventilation in the Urban Environment Assessment and Design (ed. Ghiaus, C. & Allard, F.) 22–29 (Routledge, 2005), ISBN: 1-84407-129-4.
- Xu, C., Nielsen, P. V., Gong, G., Jensen, R. L. & Liu, L. Influence of air stability and metabolic rate on exhaled flow. Indoor Air 25, 198–209, https://doi.org/10.1111/ina.12135 (2015). · DOI
- Xu, C., Nielsen, P. V., Gong, G., Liu, L. & Jensen, R. L. Measuring the exhaled breath of a manikin and human subjects. Indoor Air 25, 188–197, https://doi.org/10.1111/ina.12129 (2015). · DOI
- Harrison, J. P., Ojeda, J. J. & Romero-González, M. E. The applicability of reflectance micro-Fourier-transform infrared spectroscopy for the detection of synthetic microplastics in marine sediments. Sci. Total Environ. 416, 455–63, https://doi.org/10.1016/j.scitotenv.2011.11.078 (2012). · DOI
- Vianello, A. et al. Microplastic particles in sediments of Lagoon of Venice, Italy: First observations on occurrence, spatial patterns and identification. Estuarine, Coastal. Estuar. Coast. Shelf Sci. 130, 54–61, https://doi.org/10.1016/j.ecss.2013.03.022 (2013). · DOI
- Watson, A., Bates, R. R. & Kennedy, D. Air Pollution, the Automobile, and Public Health. (National Academies Press, 1988), https://doi.org/10.17226/1033. · DOI
- Cózar, A. et al. Plastic Accumulation in the Mediterranean Sea. PLoS One 10, https://doi.org/10.1371/journal.pone.0121762 Academic (2015). · DOI
Cited by
Sorted by citations
Environmental exposure to microplastics: An overview on possible human health effects
Prata, J. C., da Costa, J. P., Lopes, I., Duarte, A. C., & Rocha-Santos, T. (2020) · Science of The Total Environment · doi:10.1016/j.scitotenv.2019.134455 · Cited by 2,690
Detection of microplastics in human lung tissue using μFTIR spectroscopy
Jenner, L. C., Rotchell, J. M., Bennett, R. T., Cowen, M., Tentzeris, V., & Sadofsky, L. R. (2022) · Science of The Total Environment · doi:10.1016/j.scitotenv.2022.154907 · Cited by 1,536
Presence of airborne microplastics in human lung tissue
Amato-Lourenço, L. F., Carvalho-Oliveira, R., Júnior, G. R., dos Santos Galvão, L., Ando, R. A., & Mauad, T. (2021) · Journal of Hazardous Materials · doi:10.1016/j.jhazmat.2021.126124 · Cited by 1,329
Chemical Analysis of Microplastics and Nanoplastics: Challenges, Advanced Methods, and Perspectives
Ivleva, N. P. (2021) · Chemical Reviews · doi:10.1021/acs.chemrev.1c00178 · Cited by 1,172
A review of microplastics in table salt, drinking water, and air: direct human exposure
Zhang, Q., Xu, E. G., Li, J., Chen, Q., Ma, L., Zeng, E. Y., & Shi, H. (2020) · Environmental Science & Technology · doi:10.1021/acs.est.9b04535 · Cited by 1,064
Metadata
- Authors
- Vianello, A., Jensen, R. L., Liu, L., & Vollertsen, J.
- Venue
- Scientific Reports
- Published
- 2019-06-17
- Volume
- 9
- Issue
- 1
- ISSN
- 2045-2322
- PMC
- PMC6573036
- Cited by
- 766
- References
- 0
- Language
- en
About these checks
Registry, retraction, Cites and statistics results are computed, not judged, with one exception: a printed reference that no index lists is read once by a model before it counts as a citation error. Claims are extracted by a model and kept only when their quote appears verbatim in the text; each cited source is then checked, with a model’s help, for whether it says what the claim relies on. Those verdicts can be wrong — read the claim’s quote and the cited source before relying on one.
Statistics and arithmetic are recomputed, not judged.
Confidence bands are shown only for fields calibrated on our annotated test set. None is calibrated yet, so no band is shown.
What counts as a claim ›How we measure confidence ›How we check this ›
Are you an author, or do you see a problem with this page? Request a review
How to cite
Cite CoChat for the checks on this page, and the paper for its own findings.
- This page
- CoChat. (2026). Citation check: Simulating human exposure to indoor airborne microplastics using a Breathing Thermal Manikin. https://app.cochat.ai/papers/10.1038/s41598-019-45054-w
- The paper
- Vianello, A., Jensen, R. L., Liu, L., & Vollertsen, J. (2019). Simulating human exposure to indoor airborne microplastics using a Breathing Thermal Manikin. Scientific Reports. https://doi.org/10.1038/s41598-019-45054-w
