

The DOI matches its Crossref record; 45 of the 46 references it cites were found in a registry or an index.
Early change in circulating tumor DNA as a potential predictor of response to chemotherapy in patients with metastatic colorectal cancer
Open accessAbstract
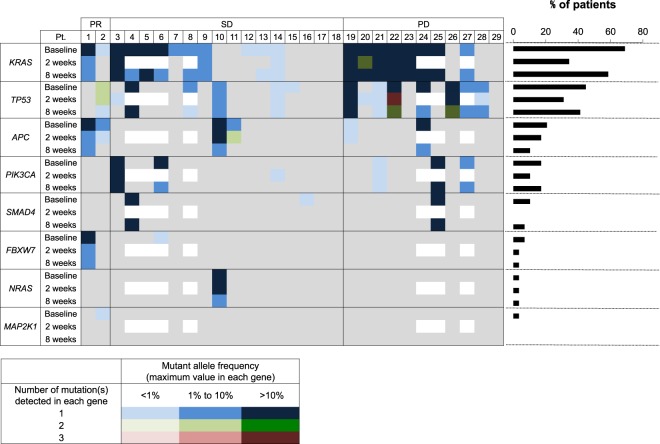
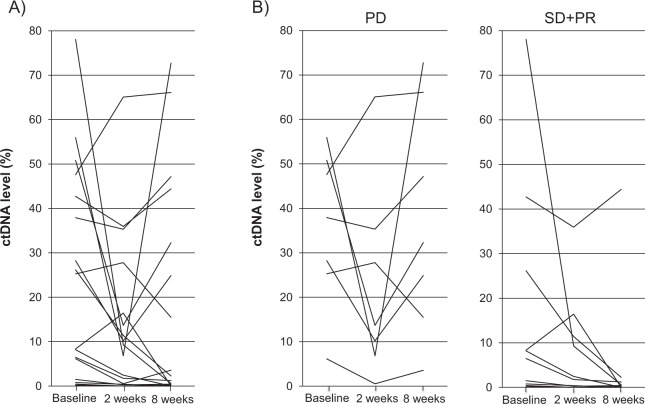
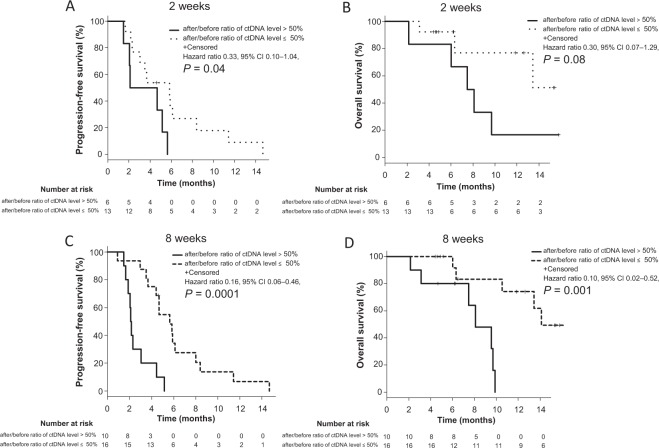
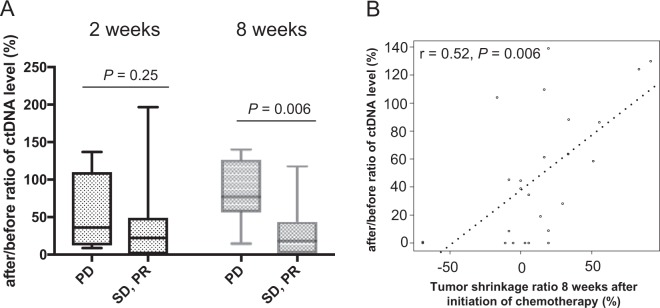
The impact of ctDNA changes after chemotherapy on the clinical outcomes of patients with metastatic colorectal cancer (mCRC) remains unclear. The present study evaluated the clinical implications of the early change in ctDNA levels as a predictor of objective response and clinical outcome in mCRC patients who received chemotherapy. We investigated the effects of after/before ratio of ctDNA levels 2 and 8 weeks after initiation of second-line chemotherapy, on objective response rate (ORR), progression-free survival (PFS), and overall survival (OS). ctDNA was detected using amplicon-based deep sequencing with a molecular barcode encompassing >240 hotspot mutations in 14 colon cancer-related genes. In multivariate analysis, as compared to baseline, patients with lower ctDNA level (≤50%) 8 weeks after initiation of chemotherapy showed significantly longer PFS and OS than the patients with higher (>50%) ctDNA level. In patients achieving a partial response or stable disease, the after/before ratio of ctDNA level 8 weeks after initiation of chemotherapy was significantly lower than those in patients with progressive disease. The present study suggests that an early change in the ctDNA level might serve as a biomarker to predict the chemotherapeutic efficacy and clinical outcomes in patients with mCRC.
Overview
The claims and statistics of this paper haven’t been checked yet.
Run the check — free, no account needed. It reads the open-access text and checks the sources it cites.
Integrity signals
Registry
Cites
Statistics
Figures
Verification
Claims the paper makes
The claims and statistics of this paper haven’t been checked yet.
Run the check — free, no account needed. It reads the open-access text and checks the sources it cites.
Claims other papers make about this one
Each is checked against this paper’s own text: does it say what the citing paper says it does?
In the citing paper
“recent data suggests that serial analyses may have clinical value as clearance of ctDNA among patients undergoing systemic chemo- or immunotherapy correlate with progression-free and overall survival.13–17”
From Early Changes in Circulating Cell-Free KRAS G12C Predict Response to Adagrasib in KRAS Mutant Non–Small Cell Lung Cancer Patients (2023) · cites this paper as [14]
Self-check
Percentages, sums and reported differences re-computed from the paper’s own numbers.
The self-check needs the paper’s full text.
Citations
Cites
Investigation of the freely available easy-to-use software ‘EZR’ for medical statistics
Kanda, Y. (2012) · Bone Marrow Transplantation · doi:10.1038/bmt.2012.244 · Cited by 18,876
Erdogan, D., Heijnen, B. H. M., Bennink, R. J., Kok, M., Dinant, S., Straatsburg, I. H., Gouma, D. J., & van Gulik, T. M. (2004) · Liver International · doi:10.1111/j.1478-3231.2004.00901.x · Cited by 11,656
Comprehensive molecular characterization of human colon and rectal cancer
The Cancer Genome Atlas Network (2012) · Nature · doi:10.1038/nature11252 · Cited by 8,499
ESMO consensus guidelines for the management of patients with metastatic colorectal cancer
Van Cutsem, E., Cervantes, A., Adam, R., Sobrero, A., Van Krieken, J. H., Aderka, D., Aranda Aguilar, E., Bardelli, A., Benson, A., Bodoky, G., et al. (2016) · Annals of Oncology · doi:10.1093/annonc/mdw235 · Cited by 3,421
The Consensus Coding Sequences of Human Breast and Colorectal Cancers
Sjöblom, T., Jones, S., Wood, L. D., Parsons, D. W., Lin, J., Barber, T. D., Mandelker, D. L., Leary, R. J., Ptak, J., Silliman, N., et al. (2006) · Science · doi:10.1126/science.1133427 · Cited by 3,161
Liquid biopsies come of age: Towards implementation of circulating tumour DNA
Wan, J. C. M., Massie, C., Garcia-Corbacho, J., Mouliere, F., Brenton, J. D., Caldas, C., Pacey, S., Baird, R., & Rosenfeld, N. (2017) · Nature Reviews Cancer · doi:10.1038/nrc.2017.7 · Cited by 2,809
Japanese Society for Cancer of the Colon and Rectum, Watanabe, T., Muro, K., Ajioka, Y., Hashiguchi, Y., Ito, Y., Saito, Y., Hamaguchi, T., Ishida, H., Ishiguro, M., et al. (2018) · International Journal of Clinical Oncology · doi:10.1007/s10147-017-1101-6 · Cited by 2,467
Liquid Biopsies: Genotyping Circulating Tumor DNA
Diaz, L. A., & Bardelli, A. (2014) · Journal of Clinical Oncology · doi:10.1200/jco.2012.45.2011 · Cited by 2,210
Integrating liquid biopsies into the management of cancer
Siravegna, G., Marsoni, S., Siena, S., & Bardelli, A. (2017) · Nature Reviews Clinical Oncology · doi:10.1038/nrclinonc.2017.14 · Cited by 1,985
Hashiguchi, Y., Muro, K., Saitō, Y., Ito, Y., Ajioka, Y., Hamaguchi, T., Hasegawa, K., Hotta, K., Ishida, H., Ishiguro, M., et al. (2019) · International Journal of Clinical Oncology · doi:10.1007/s10147-019-01485-z · Cited by 1,950
Emergence of KRAS mutations and acquired resistance to anti-EGFR therapy in colorectal cancer
Misale, S., Yaeger, R., Hobor, S., Scala, E., Janakiraman, M., Liska, D., Valtorta, E., Schiavo, R., Buscarino, M., Siravegna, G., et al. (2012) · Nature · doi:10.1038/nature11156 · Cited by 1,889
Liquid biopsy: monitoring cancer-genetics in the blood
Crowley, E. H., Nicolantonio, F. D., Loupakis, F., & Bardelli, A. (2013) · Nature Reviews Clinical Oncology · doi:10.1038/nrclinonc.2013.110 · Cited by 1,857
Clinical Applications of Circulating Tumor Cells and Circulating Tumor DNA as Liquid Biopsy
Alix-Panabières, C., & Pantel, K. (2016) · Cancer Discovery · doi:10.1158/2159-8290.cd-15-1483 · Cited by 1,394
Colon Cancer, Version 1.2017, NCCN Clinical Practice Guidelines in Oncology
Benson, A. B., Venook, A. P., Cederquist, L., Chan, E., Chen, Y., Cooper, H. S., Deming, D. A., Engstrom, P. F., Enzinger, P. C., Fichera, A., et al. (2017) · Journal of the National Comprehensive Cancer Network · doi:10.6004/jnccn.2017.0036 · Cited by 1,333
Merker, J. D., Oxnard, G. R., Compton, C., Diehn, M., Hurley, P., Lazar, A. J., Lindeman, N., Lockwood, C. M., Rai, A. J., Schilsky, R. L., et al. (2018) · Journal of Clinical Oncology · doi:10.1200/jco.2017.76.8671 · Cited by 959
Clinical Sequencing Defines the Genomic Landscape of Metastatic Colorectal Cancer
Yaeger, R., Chatila, W. K., Lipsyc, M. D., Hechtman, J. F., Cercek, A., Sanchez-Vega, F., Jayakumaran, G., Middha, S., Zehir, A., Donoghue, M. T. A., et al. (2018) · Cancer Cell · doi:10.1016/j.ccell.2017.12.004 · Cited by 858
Wu, Y.-L., Zhou, C., Liam, C.-K., Wu, G., Liu, X., Zhong, Z., Lu, S., Cheng, Y., Han, B., Chen, L., et al. (2015) · Annals of Oncology · doi:10.1093/annonc/mdv270 · Cited by 738
Tie, J., Kinde, I., Wang, Y., Wong, H., Roebert, J. K., Christie, M., TACEY, M. A., Wong, R., Singh, M., Karapetis, C. S., et al. (2015) · Annals of Oncology · doi:10.1093/annonc/mdv177 · Cited by 632
Liquid Biopsies, What We Do Not Know (Yet)
Bardelli, A., & Pantel, K. (2017) · Cancer Cell · doi:10.1016/j.ccell.2017.01.002 · Cited by 482
The Isolation of Nucleic Acids from Fixed, Paraffin-Embedded Tissues–Which Methods Are Useful When?
Gilbert, M. T. P., Haselkorn, T. S., Bunce, M., Sánchez, J. J. M., Lucas, S. B., Jewell, L. D., Marck, E. V., & Worobey, M. (2007) · PLoS ONE · doi:10.1371/journal.pone.0000537 · Cited by 405
Vidal, J., Muinelo, L., Dalmases, A., Jones, F. S., Edelstein, D. L., Iglesias, M., Orrillo, M., Abalo, A., Rodríguez, C., Brozos, E., et al. (2017) · Annals of Oncology · doi:10.1093/annonc/mdx125 · Cited by 345
A review of somatic single nucleotide variant calling algorithms for next-generation sequencing data
Xu, C. (2018) · Computational and Structural Biotechnology Journal · doi:10.1016/j.csbj.2018.01.003 · Cited by 242
Piessevaux, H. H., Buyse, M. E., Schlichting, M., Cutsem, E. V., Bokemeyer, C., Heeger, S., & Tejpar, S. (2013) · Journal of Clinical Oncology · doi:10.1200/jco.2012.42.8532 · Cited by 219
Heinemann, V., Stintzing, S., Modest, D. P., Gießen-Jung, C., Michl, M., & Mansmann, U. (2015) · European Journal of Cancer · doi:10.1016/j.ejca.2015.06.116 · Cited by 190
The Clinical Viewpoint: Definitions, Limitations of RECIST, Practical Considerations of Measurement
Villaruz, L. C., & Socinski, M. A. (2013) · Clinical Cancer Research · doi:10.1158/1078-0432.ccr-12-2935 · Cited by 175
Profile of the Roche cobas® EGFR mutation test v2 for non-small cell lung cancer
Malapelle, U., Sirera, R., Lewintre, E. J., Reclusa, P., Fariñas, S. C., Blasco, A., Pisapia, P., Rolfo, C. D., & Camps, C. (2017) · Expert Review of Molecular Diagnostics · doi:10.1080/14737159.2017.1288568 · Cited by 174
Guibert, N. M., Hu, Y., Feeney, N. B., Kuang, Y., Plagnol, V., Jones, G. R., Howarth, K., Beeler, J. F., Paweletz, C. P., & Oxnard, G. R. (2018) · Annals of Oncology · doi:10.1093/annonc/mdy005 · Cited by 135
Siravegna, G., Bianchi, A. S., Nagy, R. J., Raghav, K. P. S., Odegaard, J. I., Lanman, R. B., Trusolino, L., Marsoni, S., Siena, S., & Bardelli, A. (2019) · Clinical Cancer Research · doi:10.1158/1078-0432.ccr-18-3389 · Cited by 134
Cell-Free DNA in Metastatic Colorectal Cancer: A Systematic Review and Meta-Analysis
Spindler, K. G., Boysen, A. K., Pallisgaard, N., Johansen, J. S., Tabernero, J. M., Mau‐Sørensen, M., Jensen, B. V., Hansen, T. F., Sefrioui, D., Andersen, R. F., et al. (2017) · The Oncologist · doi:10.1634/theoncologist.2016-0178 · Cited by 91
Yamada, T., Iwai, T., Takahashi, G., Kan, H., Koizumi, M., Matsuda, A., Shinji, S., Yamagishi, A., Yokoyama, Y., Tatsuguchi, A., et al. (2016) · Cancer Science · doi:10.1111/cas.12959 · Cited by 85
Osumi, H., Shinozaki, E., Takeda, Y., Wakatsuki, T., Ichimura, T., Saiura, A., Yamaguchi, K., Takahashi, S., Noda, T., & Zembutsu, H. (2018) · Cancer Medicine · doi:10.1002/cam4.1913 · Cited by 81
Self-citationGiessen, C. A., Laubender, R. P., von Weikersthal, L. F., Schalhorn, A., Modest, D. P., Stintzing, S., Haas, M., Mansmann, U., & Heinemann, V. (2013) · Cancer Science · doi:10.1111/cas.12148 · Cited by 64
Yoshino, T., Muro, K., Yamaguchi, K., Nishina, T., Denda, T., Kudo, T., Okamoto, W., Taniguchi, H., Akagi, K., Kajiwara, T., et al. (2015) · EBioMedicine · doi:10.1016/j.ebiom.2015.02.007 · Cited by 62
Self-citationSpindler, K. G., Appelt, A. L., Pallisgaard, N., Andersen, R. F., & Jakobsen, A. K. M. (2013) · British Journal of Cancer · doi:10.1038/bjc.2013.633 · Cited by 49
Taniguchi, H., Yamazaki, K., Yoshino, T., Muro, K., Yatabe, Y., Watanabe, T., Ebi, H., Ochiai, A., Baba, E., & Tsuchihara, K. (2015) · Cancer Science · doi:10.1111/cas.12595 · Cited by 42
Hsu, H., Lapke, N., Wang, C., Lin, P.-Y., You, J. F., Yeh, C. Y., Tsai, W., Hung, H., Chiang, S.-F., Chen, H., et al. (2018) · Molecular Cancer Therapeutics · doi:10.1158/1535-7163.mct-17-1306 · Cited by 38
Michl, M., Stintzing, S., von Weikersthal, L. F., Decker, T. W., Kiani, A., Vehling-Kaiser, U., Al-Batran, S.-E., Heintges, T., Lerchenmueller, C., Kahl, C., et al. (2016) · Annals of Oncology · doi:10.1093/annonc/mdw222 · Cited by 36
Petrioli, R., Licchetta, A., Roviello, G., Pascucci, A., Francini, E., Bargagli, G., Conca, R., Miano, S. T., Marzocca, G., Francini, G., et al. (2012) · Cancer Investigation · doi:10.3109/07357907.2011.629380 · Cited by 33
Shin, S., Kim, Y., Oh, S. C., Yu, N., Lee, S., Choi, J. R., & Lee, K. (2017) · Oncotarget · doi:10.18632/oncotarget.16799 · Cited by 31
Wang, Y., Liu, H., Hou, Y., Zhou, X., Liang, L., Zhang, Z., Shi, H., Xu, S., Hu, P., Zheng, Z., et al. (2018) · Archiv für Pathologische Anatomie und Physiologie und für Klinische Medicin · doi:10.1007/s00428-018-2359-4 · Cited by 24
Modest, D. P., Stintzing, S., von Weikersthal, L. F., Decker, T. W., Kiani, A., Vehling‐Kaiser, U., Al‐Batran, S., Heintges, T., Lerchenmuller, C. A., Kahl, C., et al. (2016) · International Journal of Cancer · doi:10.1002/ijc.30592 · Cited by 20
Fukushima, Y., Yanaka, S., Murakami, K., Abe, Y., Koshizaka, T., Hara, H., Samejima, C., Kishi, Y., Kaneda, M., & Yoshino, T. (2011) · PubMed · Cited by 14
Sunakawa, Y., Tsuji, A., Denda, T., Segawa, Y., Negoro, Y., Shimada, K., Kochi, M., Nakamura, M., Kotaka, M., Tanioka, H., et al. (2017) · Targeted Oncology · doi:10.1007/s11523-017-0527-0 · Cited by 7
Fiala, O., Hošek, P., Šorejs, O., Liška, V., Büchler, T., Poprach, A., Kučera, R., Topolčan, O., Šedivcová, M., & Fínek, J. (2018) · Journal of Cancer · doi:10.7150/jca.26217 · Cited by 4
Taniguchi, H. (2019) · PubMed · Cited by 4
Cited by
Sorted by citations
Liquid biopsy in cancer: current status, challenges and future prospects
Ma, L., Guo, H., Zhao, Y., Liu, Z., Wang, C., Bu, J., Sun, T., & Wei, J. (2024) · Signal Transduction and Targeted Therapy · doi:10.1038/s41392-024-02021-w · Cited by 820
Sanz‐García, E., Stutheit-Zhao, E. Y., Bratman, S. V., & Siu, L. L. (2022) · Science Advances · doi:10.1126/sciadv.abi8618 · Cited by 196
Dynamic liquid biopsy components as predictive and prognostic biomarkers in colorectal cancer
Raza, A., Khan, A. Q., Inchakalody, V. P., Mestiri, S., Yoosuf, Z. S. K. M., Bedhiafi, T., El-Ella, D. M. A., Taib, N., Hydrose, S., Akbar, S., et al. (2022) · Journal of Experimental & Clinical Cancer Research · doi:10.1186/s13046-022-02318-0 · Cited by 160
Assaf, Z. J. F., Zou, W., Fine, A. D., Socinski, M. A., Young, A. G., Lipson, D., Freidin, J. F., Kennedy, M., Polisecki, E. Y., Nishio, M., et al. (2023) · Nature Medicine · doi:10.1038/s41591-023-02226-6 · Cited by 152
Signed in Blood: Circulating Tumor DNA in Cancer Diagnosis, Treatment and Screening
Adashek, J. J., Jankú, F., & Kurzrock, R. (2021) · Cancers · doi:10.3390/cancers13143600 · Cited by 100
Metadata
- Authors
- Osumi, H., Shinozaki, E., Yamaguchi, K., & Zembutsu, H.
- Affiliations
- Japanese Foundation For Cancer Research (JP)
- Corresponding author
- Zembutsu, Hitoshi
- Venue
- Scientific Reports
- Published
- 2019-11-22
- Volume
- 9
- Issue
- 1
- Pages
- 17358-17358
- ISSN
- 2045-2322 (ISSN-L)
- PMC
- PMC6874682
- OpenAlex
- W2991166240
- Cited by
- 114
- References
- 46
- Citations by year
- 2026: 10 · 2025: 13 · 2024: 9 · 2023: 17 · 2022: 21 · 2021: 21 · 2020: 23
- FWCI
- 6.79
- Type
- journal article
- Language
- en
- Open access
- gold
- doi.org
- Locations
- Scientific Reports (publishedVersion, cc-by)
- PubMed Central (publishedVersion, cc-by)
- PubMed (publishedVersion)
- DOAJ (DOAJ: Directory of Open Access Journals) (submittedVersion)
- Funders
- Japan Society for the Promotion of Science (18K07310)
- Topics
- Health Sciences › Medicine › Oncology › Colorectal Cancer Treatments and Studies
- Life Sciences › Biochemistry, Genetics and Molecular Biology › Cancer Research › Cancer Genomics and Diagnostics
- Health Sciences › Medicine › Pathology and Forensic Medicine › Genetic factors in colorectal cancer
- Keywords
- circulating tumor DNA, metastatic colorectal cancer, second-line chemotherapy, objective response rate, predictive biomarkers, progression-free survival, overall survival, mutational hotspots, treatment response prediction
- MeSH terms
- Liquid Biopsy, Circulating Tumor DNA, Adenocarcinoma, Adult, Aged, Antineoplastic Combined Chemotherapy Protocols, DNA Mutational Analysis, Female, Humans, Male, Middle Aged, Neoplasm Metastasis, Predictive Value of Tests, Prognosis, Biomarkers, Tumor, Colorectal Neoplasms, Early Diagnosis, Biomarkers, Pharmacological, High-Throughput Nucleotide Sequencing
About these checks
Registry, retraction, Cites and statistics results are computed, not judged, with one exception: a printed reference that no index lists is read once by a model before it counts as a citation error. Claims are extracted by a model and kept only when their quote appears verbatim in the text; each cited source is then checked, with a model’s help, for whether it says what the claim relies on. Those verdicts can be wrong — read the claim’s quote and the cited source before relying on one.
Statistics and arithmetic are recomputed, not judged.
Confidence bands are shown only for fields calibrated on our annotated test set. None is calibrated yet, so no band is shown.
What counts as a claim ›How we measure confidence ›How we check this ›
Are you an author, or do you see a problem with this page? Request a review
