

The DOI matches its Crossref record; 67 of the 67 references it cites were found in a registry or an index.
Emergence of Visual Center-Periphery Spatial Organization in Deep Convolutional Neural Networks
Open accessPublished version of a preprint
Abstract
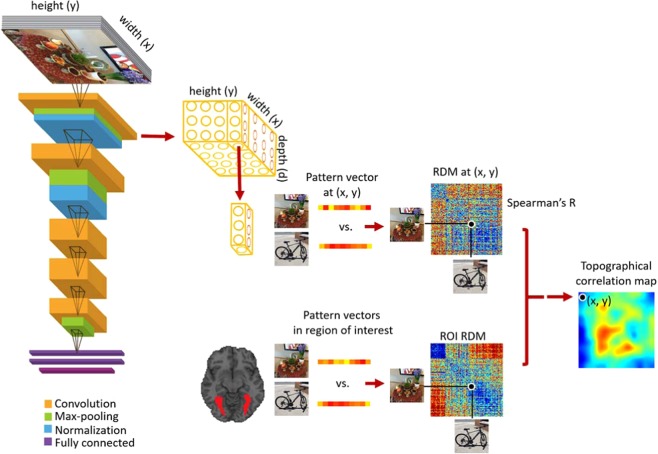
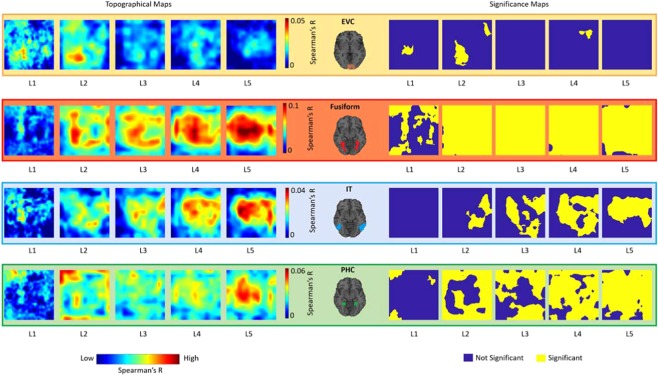
Research at the intersection of computer vision and neuroscience has revealed hierarchical correspondence between layers of deep convolutional neural networks (DCNNs) and cascade of regions along human ventral visual cortex. Recently, studies have uncovered emergence of human interpretable concepts within DCNNs layers trained to identify visual objects and scenes. Here, we asked whether an artificial neural network (with convolutional structure) trained for visual categorization would demonstrate spatial correspondences with human brain regions showing central/peripheral biases. Using representational similarity analysis, we compared activations of convolutional layers of a DCNN trained for object and scene categorization with neural representations in human brain visual regions. Results reveal a brain-like topographical organization in the layers of the DCNN, such that activations of layer-units with central-bias were associated with brain regions with foveal tendencies (e.g. fusiform gyrus), and activations of layer-units with selectivity for image backgrounds were associated with cortical regions showing peripheral preference (e.g. parahippocampal cortex). The emergence of a categorical topographical correspondence between DCNNs and brain regions suggests these models are a good approximation of the perceptual representation generated by biological neural networks.
Overview
The claims and statistics of this paper haven’t been checked yet.
Free: it reads the open-access text and checks the first 5 claims that cite a source we can check. Create a free account to check every claim.
Integrity signals
Registry
Cites
Statistics
Figures

Verification
Claims the paper makes
The claims and statistics of this paper haven’t been checked yet.
Free: it reads the open-access text and checks the first 5 claims that cite a source we can check. Create a free account to check every claim.
Claims other papers make about this one
Each is checked against this paper’s own text: does it say what the citing paper says it does?
The cited source says what the claim attributes to it.
In the citing paper
“Models trained to process images, for example, spontaneously learned how to count (30, 31) and differentially process central and peripheral image areas (32), as well as experience human-like optical illusions (33).”
From Evaluating large language models in theory of mind tasks (2024) · cites this paper as [32]
Self-check
Percentages, sums and reported differences re-computed from the paper’s own numbers.
The self-check needs the paper’s full text.
Citations
Cites
ImageNet classification with deep convolutional neural networks
Krizhevsky, A., Sutskever, I., & Hinton, G. E. (2017) · Communications of the ACM · doi:10.1145/3065386 · Cited by 112,155
ImageNet: A large-scale hierarchical image database
Deng, J., Dong, W., Socher, R., Li, L.-J., Li, K., & Fei-Fei, L. (2009) · 2009 IEEE Conference on Computer Vision and Pattern Recognition · doi:10.1109/cvpr.2009.5206848 · Cited by 65,333
Tzourio-Mazoyer, N., Landeau, B., Papathanassiou, D., Crivello, F., Etard, O., Delcroix, N., Mazoyer, B., & Joliot, M. (2002) · NeuroImage · doi:10.1006/nimg.2001.0978 · Cited by 16,319
Nonparametric statistical testing of EEG- and MEG-data
Maris, E., & Oostenveld, R. (2007) · Journal of Neuroscience Methods · doi:10.1016/j.jneumeth.2007.03.024 · Cited by 8,496 · cited 1×
“For statistical tests we used nonparametric methods with no assumption on the data distributions 59,60 .”
MethodThe fusiform face area: a module in human extrastriate cortex specialized for face perception
Kanwisher, N., McDermott, J., & Chun, M. M. (1997) · The Journal of Neuroscience · doi:10.1523/jneurosci.17-11-04302.1997 · Cited by 7,738
Representational similarity analysis-connecting the branches of systems neuroscience
Kriegeskorte, N. (2008) · Frontiers in Systems Neuroscience · doi:10.3389/neuro.06.004.2008 · Cited by 3,355
IARBUS, A. L. (1967) · Medical Entomology and Zoology · Cited by 3,319
Yarbus, A. L. (1967) · doi:10.1007/978-1-4899-5379-7 · Cited by 3,304
A cortical representation of the local visual environment
Epstein, R., & Kanwisher, N. (1998) · Nature · doi:10.1038/33402 · Cited by 2,984
(2014) · DSpace@MIT (Massachusetts Institute of Technology) · Cited by 2,534
Self-citation
Cited by
Evaluating large language models in theory of mind tasks
Kosinski, M. (2024) · Proceedings of the National Academy of Sciences · doi:10.1073/pnas.2405460121 · Cited by 339
“Models trained to process images, for example, spontaneously learned how to count ( 30 , 31 ) and differentially process central and peripheral image areas ( 32 ), as well as experience human - like optical illusions ( 33 ).”
BackgroundUsing artificial neural networks to ask ‘why’ questions of minds and brains
Kanwisher, N., Khosla, M., & Dobs, K. (2023) · Trends in Neurosciences · doi:10.1016/j.tins.2022.12.008 · Cited by 182
Brain-like functional specialization emerges spontaneously in deep neural networks
Dobs, K., Martinez, J., Kell, A. J. E., & Kanwisher, N. (2022) · Science Advances · doi:10.1126/sciadv.abl8913 · Cited by 129
Evaluating Large Language Models in Theory of Mind Tasks
Kosinski, M. (2023) · arXiv · doi:10.48550/arxiv.2302.02083 · Cited by 339
“Models trained to process images, for example, spontaneously learned how to count (27, 28) and differentially process central and peripheral image areas (29), as well as experience human-like optical illusions (30).”
BackgroundVisuospatial coding as ubiquitous scaffolding for human cognition
Groen, I. I. A., Dekker, T. M., Knapen, T. H. J., & Silson, E. H. (2021) · Trends in Cognitive Sciences · doi:10.1016/j.tics.2021.10.011 · Cited by 101
Metadata
- Authors
- Mohsenzadeh, Y., Mullin, C., Lahner, B., & Oliva, A.
- Affiliations
- Western University (CA)
- York University (CA)
- MIT Computer Science and Artificial Intelligence Laboratory (US)
- Corresponding author
- Mohsenzadeh, Yalda
- Venue
- Scientific Reports
- Published
- 2020-03-13
- Volume
- 10
- Issue
- 1
- Pages
- 4638-4638
- ISSN
- 2045-2322 (ISSN-L)
- PMC
- PMC7070097
- OpenAlex
- W3010846116
- Cited by
- 31
- References
- 66
- Citations by year
- 2026: 1 · 2025: 3 · 2024: 10 · 2023: 6 · 2022: 4 · 2021: 4 · 2020: 3
- FWCI
- 2.28
- Type
- journal article
- Language
- en
- Open access
- gold
- doi.org
- Licence
- cc-by
- creativecommons.org/licenses/by/4.0 (tdm)
- creativecommons.org/licenses/by/4.0 (vor)
- Locations
- Scientific Reports (publishedVersion, cc-by)
- bioRxiv (Cold Spring Harbor Laboratory) (acceptedVersion, cc-by-nd)
- Europe PMC (PubMed Central) (publishedVersion, cc-by)
- PubMed Central (publishedVersion, cc-by)
- PubMed (publishedVersion)
- Scholarship@Western (Western University) (submittedVersion)
- Funders
- United States Department of Defense | United States Navy | Office of Naval Research (N00014-16-1-3116)
- National Science Foundation (1532591)
- United States Department of Defense | United States Navy | ONR | Office of Naval Research Global (N00014-16-1-3116)
- Topics
- Life Sciences › Neuroscience › Cognitive Neuroscience › Visual perception and processing mechanisms
- Life Sciences › Neuroscience › Cognitive Neuroscience › Face Recognition and Perception
- Physical Sciences › Computer Science › Computer Vision and Pattern Recognition › Advanced Neural Network Applications
- Keywords
- deep convolutional neural networks, ventral visual cortex, representational similarity analysis, object classification, scene classification, fusiform gyrus, parahippocampal cortex, hierarchical visual processing
- MeSH terms
- Adult, Female, Humans, Magnetic Resonance Imaging, Male, Models, Neurological, Pattern Recognition, Visual, Photic Stimulation, Visual Cortex, Neural Networks, Computer, Young Adult
About these checks
Registry, retraction, Cites and statistics results are computed, not judged, with one exception: a printed reference that no index lists is read once by a model before it counts as a citation error. Claims are extracted by a model and kept only when their quote appears verbatim in the text; each cited source is then checked, with a model’s help, for whether it says what the claim relies on. Those verdicts can be wrong — read the claim’s quote and the cited source before relying on one.
Statistics and arithmetic are recomputed, not judged.
Confidence bands are shown only for fields calibrated on our annotated test set. None is calibrated yet, so no band is shown.
What counts as a claim ›How we measure confidence ›How we check this ›
Are you an author, or do you see a problem with this page? Request a review
How to cite
Cite CoChat for the checks on this page, and the paper for its own findings.
- This page
- CoChat. (2026). Citation check: Emergence of Visual Center-Periphery Spatial Organization in Deep Convolutional Neural Networks. https://app.cochat.ai/papers/10.1038/s41598-020-61409-0
- The paper
- Mohsenzadeh, Y., Mullin, C., Lahner, B., & Oliva, A. (2020). Emergence of Visual Center-Periphery Spatial Organization in Deep Convolutional Neural Networks. Scientific Reports. https://doi.org/10.1038/s41598-020-61409-0
Data sources
Bibliographic data: Semantic Scholar, OpenAlex, Crossref.
Contains information from the Semantic Scholar Academic Graph Datasets, made available under the ODC Attribution License (ODC-BY 1.0).
Semantic Scholar’s data is described in: Kinney, R., et al. (2023). The Semantic Scholar Open Data Platform. arXiv:2301.10140.
