

The DOI matches its Crossref record; 35 of the 37 references it cites were found in a registry or an index.
BEHRT: Transformer for Electronic Health Records
Open accessAbstract
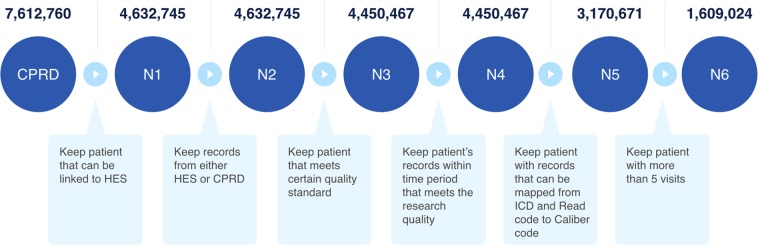
Today, despite decades of developments in medicine and the growing interest in precision healthcare, vast majority of diagnoses happen once patients begin to show noticeable signs of illness. Early indication and detection of diseases, however, can provide patients and carers with the chance of early intervention, better disease management, and efficient allocation of healthcare resources. The latest developments in machine learning (including deep learning) provides a great opportunity to address this unmet need. In this study, we introduce BEHRT: A deep neural sequence transduction model for electronic health records (EHR), capable of simultaneously predicting the likelihood of 301 conditions in one’s future visits. When trained and evaluated on the data from nearly 1.6 million individuals, BEHRT shows a striking improvement of 8.0–13.2% (in terms of average precision scores for different tasks), over the existing state-of-the-art deep EHR models. In addition to its scalability and superior accuracy, BEHRT enables personalised interpretation of its predictions; its flexible architecture enables it to incorporate multiple heterogeneous concepts (e.g., diagnosis, medication, measurements, and more) to further improve the accuracy of its predictions; its (pre-)training results in disease and patient representations can be useful for future studies (i.e., transfer learning).
Overview
The claims and statistics of this paper haven’t been checked yet.
Run the check — free, no account needed. It reads the open-access text and checks the sources it cites.
Integrity signals
Registry
Cites
Statistics
Figures
Verification
Claims the paper makes
The claims and statistics of this paper haven’t been checked yet.
Run the check — free, no account needed. It reads the open-access text and checks the sources it cites.
Claims other papers make about this one
Each is checked against this paper’s own text: does it say what the citing paper says it does?
The source backs part of the claim, not all of it — or backs it for a different population, condition or comparison.
In the citing paper
“BEHRT is limited to forecasts of disorders occurring in the next patient hospital visit or a specific predefined timeframe (eg, 6 or 12 months), consequently requiring that the information is grouped into patient visits.”
From Foresight-a generative pretrained transformer for modelling of patient timelines using electronic health records: a retrospective modelling study (2024) · cites this paper as [4]
Experimental — accuracy not yet measuredThe cited source says what the claim attributes to it.
In the citing paper
“One example is the BERT for EHRs (BEHRT) model, 4 which uses a small subset of disorders (301 in total) that were available in the structured portion of EHRs.”
From Foresight-a generative pretrained transformer for modelling of patient timelines using electronic health records: a retrospective modelling study (2024) · cites this paper as [4]
Self-check
Percentages, sums and reported differences re-computed from the paper’s own numbers.
The self-check needs the paper’s full text.
Citations
Cites
Vaswani, A., Shazeer, N., Parmar, N., Uszkoreit, J., Jones, L., Gomez, A. N., Kaiser, L., & Polosukhin, I. (2017) · arXiv · doi:10.48550/arxiv.1706.03762 · Cited by 120,404
BERT: Pre-training of Deep Bidirectional Transformers for Language Understanding
Devlin, J., Chang, M.-W., Lee, K., & Toutanova, K. (2019) · Proceedings of the 2019 Conference of the North American Chapter of the Association for Computational Linguistics: Human Language Technologies, Volume 1 (Long and Short Papers) · doi:10.18653/v1/n19-1423 · Cited by 54,325
(2008) · Journal of Machine Learning Research · Cited by 33,051
Learning Phrase Representations using RNN Encoder–Decoder for Statistical Machine Translation
Cho, K., van Merrienboer, B., Gulcehre, C., Bahdanau, D., Bougares, F., Schwenk, H., & Bengio, Y. (2014) · Proceedings of the 2014 Conference on Empirical Methods in Natural Language Processing (EMNLP) · doi:10.3115/v1/d14-1179 · Cited by 25,545
Advances in neural information processing systems 7
Cios, K. J., & Shields, M. E. (1997) · Neurocomputing · doi:10.1016/s0925-2312(97)90018-7 · Cited by 22,093
An introduction to ROC analysis
Fawcett, T. (2006) · Pattern Recognition Letters · doi:10.1016/j.patrec.2005.10.010 · Cited by 21,879
Sudlow, C., Gallacher, J., Allen, N., Beral, V., Burton, P., Danesh, J., Downey, P., Elliott, P., Green, J., Landray, M., et al. (2015) · PLOS Medicine · doi:10.1371/journal.pmed.1001779 · Cited by 12,728
High-performance medicine: the convergence of human and artificial intelligence
Topol, E. J. (2019) · Nature Medicine · doi:10.1038/s41591-018-0300-7 · Cited by 10,450
Practical Bayesian Optimization of Machine Learning Algorithms
Snoek, J., Larochelle, H., & Adams, R. P. (2012) · arXiv · doi:10.48550/arxiv.1206.2944 · Cited by 6,691
Evaluation: from precision, recall and F-measure to ROC, informedness, markedness and correlation
Powers, D. M. W. (2020) · arXiv · doi:10.48550/arxiv.2010.16061 · Cited by 5,440
Research works printed but not linked: 3
- Choi, E., Bahadori, M. T., Schuetz, A., Stewart, W. F. & Sun, J. Doctor AI: Predicting Clinical Events via Recurrent Neural Networks. In Machine Learning for Healthcare Conference, 301–318 (2016).
- Zhu, M. Recall, precision and average precision. Dep. Stat. Actuar. Sci. Univ. Waterloo, Waterloo 2, 30 (2004).
- Vig, J. Visualizing Attention in Transformer-Based Language Representation Models. arXiv preprint arXiv:1904.02679 (2019). · arXiv
Cited by
Sorted by citations
On the Opportunities and Risks of Foundation Models
Bommasani, R., Hudson, D. A., Adeli, E., Altman, R., Arora, S., von Arx, S., Bernstein, M. S., Bohg, J., Bosselut, A., Brunskill, E., et al. (2021) · arXiv · doi:10.48550/arxiv.2108.07258 · Cited by 2,676
Rahimi, K., Bidel, Z., Nazarzadeh, M., Copland, E., Canoy, D., Ramakrishnan, R., Pinho-Gomes, A.-C., Woodward, M., Adler, A., Agodoa, L., et al. (2021) · The Lancet · doi:10.1016/s0140-6736(21)00590-0 · Cited by 1,074
Self-citationMultimodal learning with transformers: A survey
Xu, P., Zhu, X., & Clifton, D. A. (2023) · IEEE Transactions on Pattern Analysis and Machine Intelligence · doi:10.1109/tpami.2023.3275156 · Cited by 1,072
A Review of the Role of Artificial Intelligence in Healthcare
Al Kuwaiti, A., Nazer, K., Al-Reedy, A., Al-Shehri, S., Al-Muhanna, A., Subbarayalu, A. V., Al Muhanna, D., & Al-Muhanna, F. A. (2023) · Journal of Personalized Medicine · doi:10.3390/jpm13060951 · Cited by 915
Rasmy, L., Xiang, Y., Xie, Z., Tao, C., & Zhi, D. (2021) · npj Digital Medicine · doi:10.1038/s41746-021-00455-y · Cited by 886
Metadata
- Authors
- Li, Y., Rao, S., Solares, J. R. A., Hassaine, A., Ramakrishnan, R., Canoy, D., Zhu, Y., Rahimi, K., & Salimi-Khorshidi, G.
- Affiliations
- University of Oxford (GB)
- Corresponding author
- Rao, Shishir
- ORCID
- Venue
- Scientific Reports
- Published
- 2020-04-28
- Volume
- 10
- Issue
- 1
- Pages
- 7155-7155
- ISSN
- 2045-2322 (ISSN-L)
- PMC
- PMC7189231
- OpenAlex
- W3017637887
- Cited by
- 595
- References
- 37
- Citations by year
- 2026: 129 · 2025: 128 · 2024: 106 · 2023: 98 · 2022: 60 · 2021: 58 · 2020: 16
- FWCI
- 22.80
- Type
- journal article
- Language
- en
- Open access
- gold
- doi.org
- Locations
- Scientific Reports (publishedVersion, cc-by)
- PubMed Central (publishedVersion, cc-by)
- PubMed (publishedVersion)
- arXiv (Cornell University) (submittedVersion)
- UNSWorks (University of New South Wales, Sydney, Australia) (submittedVersion, cc-by)
- arXiv (Cornell University) (cc-by)
- Funders
- DH | National Institute for Health Research
- Oxford University | Oxford Martin School, University of Oxford
- Topics
- Physical Sciences › Computer Science › Artificial Intelligence › Machine Learning in Healthcare
- Health Sciences › Health Professions › Health Information Management › Artificial Intelligence in Healthcare
- Health Sciences › Health Professions › Health Information Management › Electronic Health Records Systems
- Keywords
- electronic health records, disease prediction, early disease detection, sequence-to-sequence models, transformer models, multi-task prediction, heterogeneous clinical data, interpretable prediction, patient representation learning, transfer learning
- MeSH terms
- Machine Learning, Algorithms, Humans, Electronic Health Records
About these checks
Registry, retraction, Cites and statistics results are computed, not judged, with one exception: a printed reference that no index lists is read once by a model before it counts as a citation error. Claims are extracted by a model and kept only when their quote appears verbatim in the text; each cited source is then checked, with a model’s help, for whether it says what the claim relies on. Those verdicts can be wrong — read the claim’s quote and the cited source before relying on one.
Statistics and arithmetic are recomputed, not judged.
Confidence bands are shown only for fields calibrated on our annotated test set. None is calibrated yet, so no band is shown.
What counts as a claim ›How we measure confidence ›How we check this ›
Are you an author, or do you see a problem with this page? Request a review
