

The DOI matches its Crossref record; 2 of the 2 references it cites were found in a registry or an index.
MicroRNA-128-3p Enhances the Chemosensitivity of Temozolomide in Glioblastoma by Targeting c-Met and EMT
Abstract
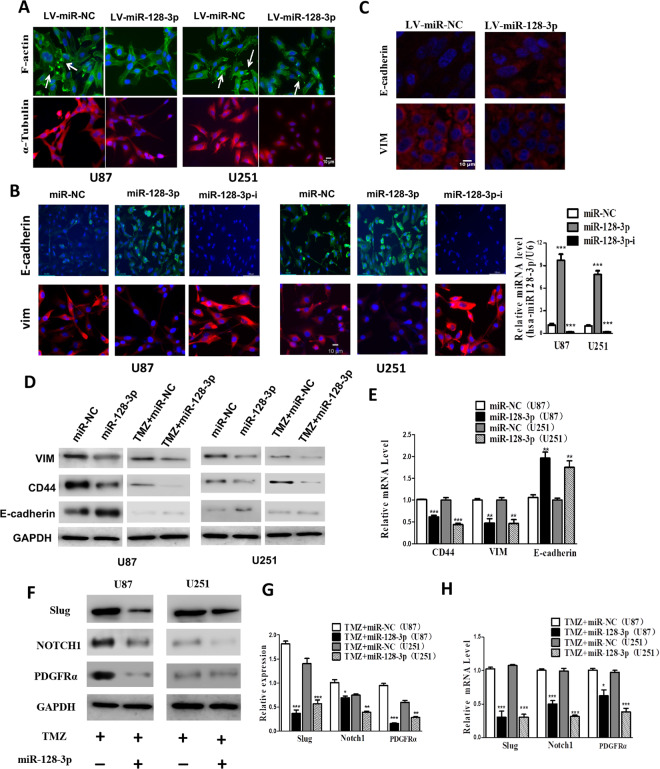
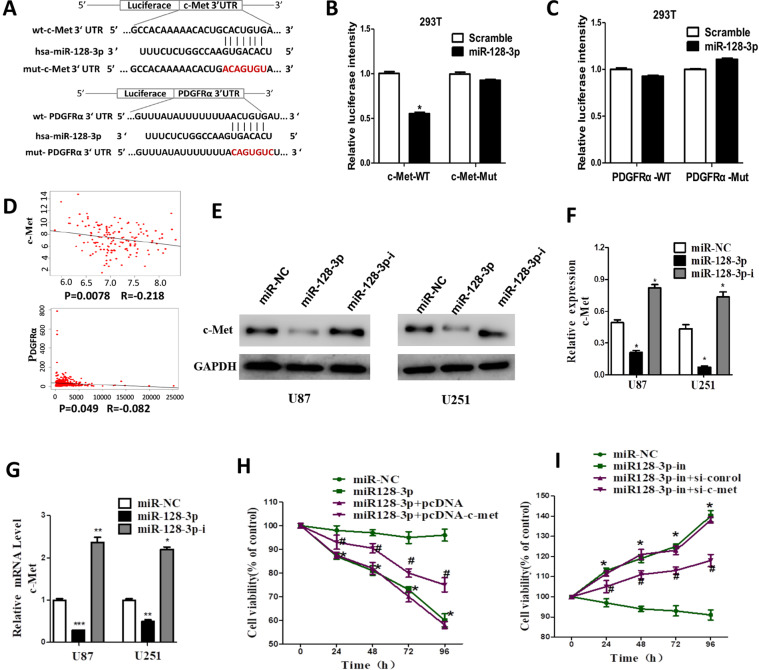
Temozolomide is a first line anti-tumor drug used for the treatment of patients with Glioblastoma multiforme (GBM). However, the drug resistance to temozolomide limits its clinical application. Therefore, novel strategies to overcome chemoresistance are desperately needed for improved treatment of human GBM. Recent studies have demonstrated that miRNAs are closely related to resistance to cancer chemotherapy. This study aimed to further validate the biological role of miR-128-3p and to investigate whether miR-128-3p can enhance the chemosensitivity of glioblastoma to temozolomide (TMZ) and the underlying mechanisms. The effects of miR-128-3p and TMZ on the proliferation of glioblastoma cells were investigated by cell counting kit-8 (cck8). Transwell and intracerebral invasion assays were applied to determine the effects of the combination of miR-128-3p and TMZ on the invasion and migration of glioblastoma in vitro and in vivo. Flow cytometry was used to detect apoptosis in each group, and immunofluorescence was used to determine the expression levels of EMT-related proteins. RT-PCR and Western-blot were applied to detect EMT-transformed proteins (c-Met, PDGFRα, Notch1, and Slug) and EMT phenotype-associated proteins (Vim, CD44, and E-cadherin) at both mRNA and protein levels. Based on the microRNA.org database, we predicted the target genes of miR-128-3p. The target-relationship between miR-128-3p and c-Met and PDGFRα was verified by dual luciferase reporter gene. The tumor volume, weight and the expression levels of the proteins described above were measured in subcutaneously transplanted tumor model in nude mice. We found that the expression of miR-128-3p was down-regulated in glioblastoma tissue samples and cell lines. miR-128-3p suppressed the proliferation, migration, and invasion of GBM both in vitro and in vivo; miR-128-3p enhanced the therapeutic effect of TMZ via inhibition of proliferation, invasion and migration of glioblastoma cells and induction of apoptosis. Overexpression of miR-128-3p down-regulated the expression levels of EMT-transformed proteins (c-Met, PDGFRα, Notch1 and Slug) to enhance the effect of TMZ. In addition, we found that miR-128-3p targeted and bound c-Met. More importantly, the upregulation of c‐Met significantly prompted U87 and U251 cell proliferation. This effect could be abolished when c‐Met was silenced. The investigation in tumor bearing nude mice showed that miR-128-3p in combination with TMZ reduced tumor volume and the invasion extent, and increased the sensitivity of glioblastoma to TMZ. miR-128-3p is capable of enhancing the sensitivity of glioblastoma to TMZ through regulating c-Met/EMT.
Overview
The claims and statistics of this paper haven’t been checked yet.
Run the check — free, no account needed. It reads the open-access text and checks the sources it cites.
Integrity signals
Registry
Cites
Statistics
Figures
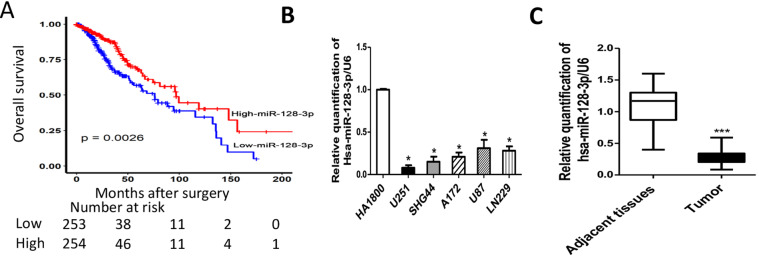
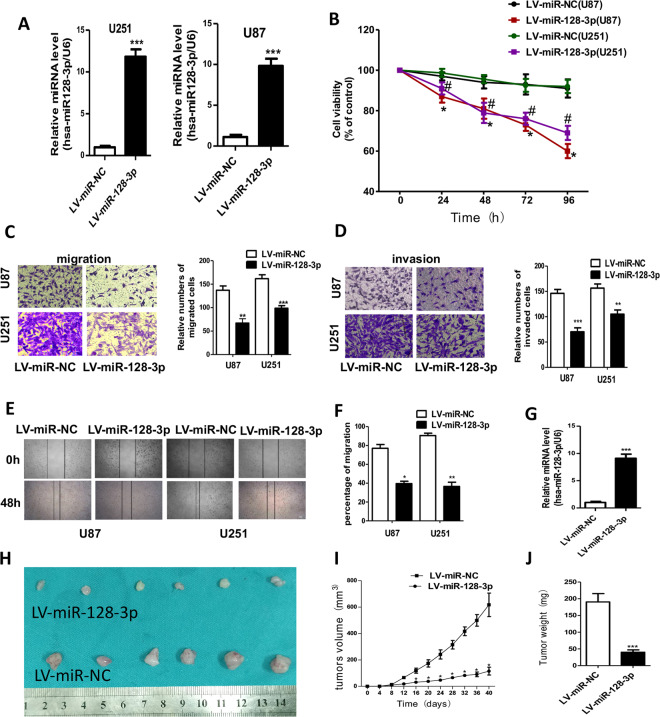
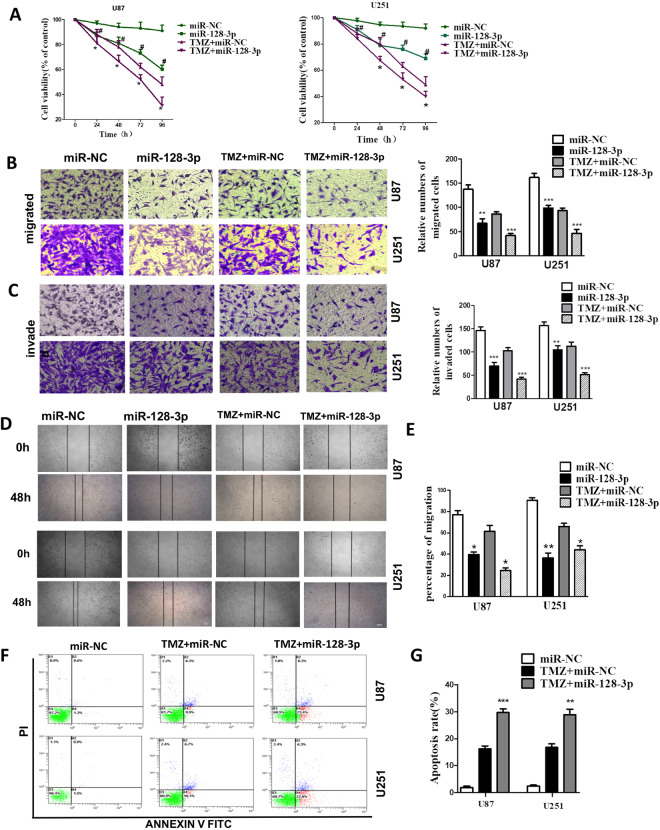
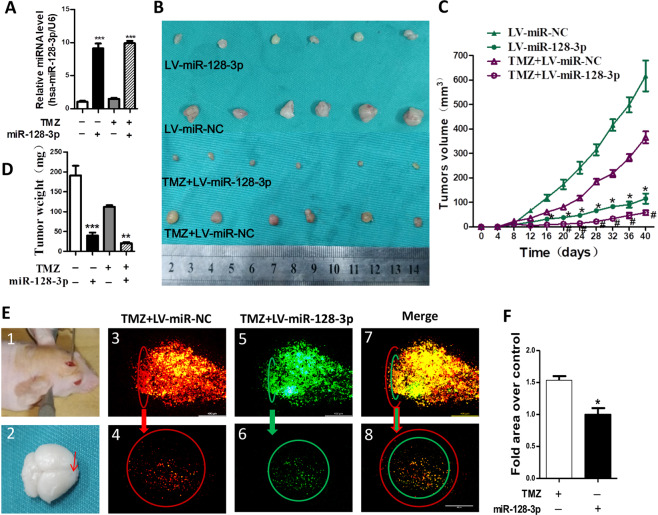
Verification
Claims the paper makes
The claims and statistics of this paper haven’t been checked yet.
Run the check — free, no account needed. It reads the open-access text and checks the sources it cites.
Claims other papers make about this one
Each is checked against this paper’s own text: does it say what the citing paper says it does?
In the citing paper
“where a reduced level of miR-128-3p was correlated with worse patient outcomes.77,78,79”
From MiR-128-3p – a gray eminence of the human central nervous system (2024) · cites this paper as [79]
In the citing paper
“Preclinical studies using miR-128-3p mimics show promise in inhibiting GSC growth.79”
From MiR-128-3p – a gray eminence of the human central nervous system (2024) · cites this paper as [79]
Self-check
Percentages, sums and reported differences re-computed from the paper’s own numbers.
The self-check needs the paper’s full text.
Citations
Cites
MicroRNA therapeutics: towards a new era for the management of cancer and other diseases
Rupaimoole, R., & Slack, F. J. (2017) · Nature Reviews Drug Discovery · doi:10.1038/nrd.2016.246 · Cited by 4,741
Adlakha, Y. K., & Saini, N. (2014) · Molecular Cancer · doi:10.1186/1476-4598-13-33 · Cited by 213
Research works printed but not linked: 37
- Jantas, D. et al. An endogenous and ectopic expression of metabotropic glutamate receptor 8 (mGluR8) inhibits proliferation and increases chemosensitivity of human neuroblastoma and glioma cells. Cancer Lett. 432, 1–16 (2018). · DOI
- Lin, S. B. & Gregory, R. I. MicroRNA biogenesis pathways in cancer. Nat. Rev. Cancer 15, 321–333 (2015). · DOI
- Li, M. L. et al. MiR-128 and its target genes in tumorigenesis and metastasis. Exp. Cell Res. 319, 3059–3064 (2013). · DOI
- Liang, R. F. et al. Circulating miR-128 as a potential diagnostic biomarker for glioma. Clin. Neurol. Neurosur 160, 88–91 (2017). · DOI
- Xiao, M. et al. MiR-128 regulation of glucose metabolism and cell proliferation in triple-negative breast cancer. Brit J. Surg. 105, 75–85 (2018). · DOI
- Zhao, L. et al. Tumor suppressor miR-128-3p inhibits metastasis and epithelial-mesenchymal transition by targeting ZEB1 in esophageal squamous-cell cancer. Acta biochimica et. biophysica Sin. 50, 171–180 (2018). · DOI
- Han, H. C., Wang, L. S., Xu, J. & Wang, A. K. MiR-128 induces pancreas cancer cell apoptosis by targeting MDM4. Exp. Ther. Med. 15, 5017–5022 (2018).
- Frixa, T. et al. MicroRNA-128-3p-mediated depletion of Drosha promotes lung cancer cell migration. Carcinogenesis. 39, 293–304 (2018). · DOI
- Peruzzi, P. et al. MicroRNA-128 coordinately targets Polycomb Repressor Complexes in glioma stem cells. Neuro Oncol. 15, 1212–1224 (2013). · DOI · Paper page
- Zhou, Q. et al. MicroRNAs as potential biomarkers for the diagnosis of glioma: A systematic review and meta-analysis. Cancer Sci. 109, 2651–2659 (2018). · DOI · Paper page
- Shang, C., Hong, Y., Guo, Y., Liu, Y. H. & Xue, Y. X. MiR-128 regulates the apoptosis and proliferation of glioma cells by targeting RhoE. Oncol. Lett. 11, 904–908 (2016). · DOI
- Su, Y. et al. Long non-coding RNA LOC100507600 functions as a competitive endogenous RNA to regulate BMI1 expression by sponging miR128-1-3p in Hirschsprung’s disease. Cell Cycle. 17, 459–467 (2018). · DOI
- Nieto, M. A., Huang, R. Y., Jackson, R. A. & Thiery, J. P. Emt: 2016. Cell. 166, 21–45 (2016). · DOI · Paper page
- Li, H. W. et al. Long Non-Coding RNA MALAT1 Decreases the Sensitivity of Resistant Glioblastoma Cell Lines to Temozolomide. Cell. Physiol. Biochem. 42, 1192–1201 (2017). · DOI
- Li, J. L. et al. Targeting the Notch1 oncogene by miR-139-5p inhibits glioma metastasis and epithelial-mesenchymal transition (EMT). Bmc Neurol. 18, 133–145 (2018). · DOI
- Weidenfeld, K. & Barkan, D. EMT and Stemness in Tumor Dormancy and Outgrowth: Are They Intertwined Processes? Front. Oncol. 8, 381–386 (2018). · DOI
- Diaz-Lopez, A., Moreno-Bueno, G. & Cano, A. Role of microRNA in epithelial to mesenchymal transition and metastasis and clinical perspectives. Cancer Manag. Res. 6, 205–216 (2014).
- Rashed, W. M. C-MET as a potential target therapy toward personalized therapy in some pediatric tumors: An overview. Crit. Rev. Oncol. Hemat 131, 7–15 (2018). · DOI
- Piao, Y. J. et al. Novel MET/TIE2/VEGFR2 inhibitor altiratinib inhibits tumor growth and invasiveness in bevacizumab-resistant glioblastoma mouse models. Neuro-Oncology. 18, 1230–241 (2016). · DOI
- Fornari, F. et al. MiR-199a-3p regulates mTOR and c-Met to influence the doxorubicin sensitivity of human hepatocarcinoma cells. Cancer Res. 70, 5184–5193 (2010). · DOI
- Kong, D. S. et al. Prognostic significance of c-Met expression in glioblastomas. Cancer. 115, 140–148 (2009). · DOI
- Boccaccio, C. & Comoglio, P. M. The MET oncogene in glioblastoma stem cells: implications as a diagnostic marker and a therapeutic target. Cancer Res. 73, 3193–3199 (2013). · DOI
- Modali, S. D., Parekh, V. I., Kebebew, E. & Agarwal, S. K. Epigenetic regulation of the lncRNA MEG3 and its target c-MET in pancreatic neuroendocrine tumors. Mol. Endocrinol. 29, 224–237 (2015). · DOI
- Wen, P. Y. et al. A phase II study evaluating the efficacy and safety of AMG 102 (rilotumumab) in patients with recurrent glioblastoma. Neuro Oncol. 13, 437–446 (2011). · DOI
- Cabanillas, M. E., Brose, M. S., Holland, J., Ferguson, K. C. & Sherman, S. I. A phase I study of cabozantinib (XL184) in patients with differentiated thyroid cancer. Thyroid. 24, 1508–1514 (2014). · DOI
- Choueiri, T. K. et al. A phase I study of cabozantinib (XL184) in patients with renal cell cancer. Ann. Oncol. 25, 1603–1608 (2014). · DOI
- Xie, C. et al. Candidate genes and microRNAs for glioma pathogenesis and prognosis based on gene expression profiles. Mol. Med. Rep. 18, 2715–2723 (2018).
- Li, H. W. et al. KAP regulates ROCK2 and Cdk2 in an RNA-activated glioblastoma invasion pathway. Oncogene. 34, 1432–1441 (2015). · DOI
- Yu, W. W., Jiang, H., Zhang, C. T. & Peng, Y. The SNAIL/miR-128 axis regulated growth, invasion, metastasis, and epithelial-to-mesenchymal transition of gastric cancer. Oncotarget. 8, 39280–39295 (2017). · DOI
- Wakelee, H. A. et al. A phase Ib/II study of cabozantinib (XL184) with or without erlotinib in patients with non-small cell lung cancer. Cancer Chemother. Pharmacol. 79, 923–932 (2017). · DOI
- Pilotto, S. et al. Tracking MET de-addiction in lung cancer: A road towards the oncogenic target. Cancer Treat. Rev. 60, 1–11 (2017). · DOI
- Kouri, F. M. et al. MiR-182 integrates apoptosis, growth, and differentiation programs in glioblastoma. Genes. Dev. 29, 732–745 (2015). · DOI
- Modali, S. D., Parekh, V. I., Kebebew, E. & Agarwal, S. K. Epigenetic Regulation of the lncRNA MEG3 and Its Target c-MET in Pancreatic Neuroendocrine Tumors. Mol. Endocrinology. 29, 224–237 (2015). · DOI
- Giannelli, G., Villa, E. & Lahn, M. Transforming growth factor-beta as a therapeutic target in hepatocellular carcinoma. Cancer Res. 74, 1890–1894 (2014). · DOI
- Rodon, J. et al. First-in-human dose study of the novel transforming growth factor-beta receptor I kinase inhibitor LY2157299 monohydrate in patients with advanced cancer and glioma. Clin. Cancer Res. 21, 553–560 (2015). · DOI
- Shan, T., Xu, Z., Wu, W., Liu, J. & Wang, Y. Roles of Notch1 Signaling in Regulating Satellite Cell Fates Choices and Postnatal Skeletal Myogenesis. J. Cell. Physiol. 232, 2964–2967 (2017). · DOI
- Shih, J. Y. & Yang, P. C. The EMT regulator slug and lung carcinogenesis. Carcinogenesis. 32, 1299–1304 (2011). · DOI
Cited by
Sorted by citations
Wnt/β-catenin-driven EMT regulation in human cancers
Xue, W., Yang, L., Chen, C., Ashrafizadeh, M., Tian, Y., & Sun, R. (2024) · Cellular and Molecular Life Sciences · doi:10.1007/s00018-023-05099-7 · Cited by 321
MiR-128-3p – a gray eminence of the human central nervous system
Kiel, K., Król, S. K., Bronisz, A., & Godlewski, J. (2024) · Molecular Therapy Nucleic Acids · doi:10.1016/j.omtn.2024.102141 · Cited by 15
Metadata
- Authors
- Zhao, C., Guo, R., Guan, F., Ma, S., Li, M., Wu, J., Liu, X., Li, H., & Yang, B.
- ORCID
- Guan, Fangxia
- Venue
- Scientific Reports
- Published
- 2020-06-11
- Volume
- 10
- Issue
- 1
- ISSN
- 2045-2322
- PMC
- PMC7289811
- Cited by
- 51
- References
- 2
- Language
- en
About these checks
Registry, retraction, Cites and statistics results are computed, not judged, with one exception: a printed reference that no index lists is read once by a model before it counts as a citation error. Claims are extracted by a model and kept only when their quote appears verbatim in the text; each cited source is then checked, with a model’s help, for whether it says what the claim relies on. Those verdicts can be wrong — read the claim’s quote and the cited source before relying on one.
Statistics and arithmetic are recomputed, not judged.
Confidence bands are shown only for fields calibrated on our annotated test set. None is calibrated yet, so no band is shown.
What counts as a claim ›How we measure confidence ›How we check this ›
Are you an author, or do you see a problem with this page? Request a review
