

The DOI matches its Crossref record; 92 of the 92 references it cites were found in a registry or an index; 13 of the 52 sources its claims cite were checked for support.
Physiological and Behavioral Synchrony Predict Group Cohesion and Performance
Open accessAbstract
Interpersonal synchrony contributes to social functioning in dyads, but it remains unknown how synchrony shapes group experiences and performance. To this end, we designed a novel group drumming task in which participants matched their drumming to either predictable or unpredictable tempos. Fifty-one three-person groups were randomly assigned to one of two conditions: synchronized or asynchronized drumming. Outcome measures included electrocardiograms and self-reports of group cohesion and synchrony. The drumming task elicited an increase in physiological synchrony between group members (specifically their hearts’ interbeat intervals). We also found that physiological synchronization and behavioral synchronization predicted individuals’ experience of group cohesion. Physiological synchrony also predicted performance in a subsequent group task that involved freely drumming together. The findings suggest that the behavioral and physiological consequences of synchronization contribute to the formation of group bonds and coordination. They also confirm that insights from translational social neuroscience can inform our knowledge of the development of cohesive and efficacious groups.
Overview
CoChat Summary
TL;DR
In a novel group drumming paradigm, physiological synchrony of heart interbeat intervals (IBIs) emerged between group members and, together with behavioral synchronization, predicted group cohesion; IBI synchrony also predicted later coordinated drumming performance. The findings suggest behavioral and physiological synchrony are distinct contributors to group bonding and coordination.
Key findings
- Group IBI synchrony increased significantly from baseline during the drumming task in all groups, regardless of condition: t(47) = −5.37, p = 0.0001, 95% CI = −0.2–0.09. Real interacting dyads had higher IBI correlations than randomly created dyads (M = 0.142, SD = 0.01 vs. M = 0.0498, SD = 0.002; Kolmogorov-Smirnov Sig. = 4.3 × 10⁻¹⁰).
- Group cohesion was higher in the synchronized than asynchronized drumming condition (M = 4.26, SD = 0.98 vs. M = 3.85, SD = 1.08; t(147) = 2.4, p = 0.016). Perceived synchrony (2.75 vs. 2.45, p = 0.03) and drumming together (439.6 vs. 318.3, p = 0.007) also differed by condition.
- In a linear mixed model predicting group cohesion, both task condition (estimate = −0.46, p = 0.044) and group IBI synchrony (estimate = 1.76, p = 0.020) were significant; prior familiarity and musical knowledge were not.
- IBI synchrony during the drumming task predicted coordinated performance in a later free improvisation task: overall model F(2,44) = 3.99, p = 0.025, explaining 15.4% of variance; IBI synchrony B = 942.71, Beta = 0.31, t = 2.25, p = 0.029. The prior drumming condition did not significantly predict improvisation coordination (p = 0.084).
Methods
- 153 participants nested in 51 three-person groups were randomly assigned to synchronized or asynchronized drumming; final analyses used 141 participants in 47 groups after exclusions. Participants were undergraduate psychology students at Bar-Ilan University (32 males, 119 females; average age 22.6 years for males, 22.4 years for females).
- ECGs were recorded continuously across a 5-minute baseline, a 4-minute drumming task, a second 5-minute baseline, and a 4-minute free improvisation session. Group cohesion, perceived synchrony, and affect were self-reported; performance was derived from MIDI files as the number of times all three members hit their drums together within a 30-ms window.
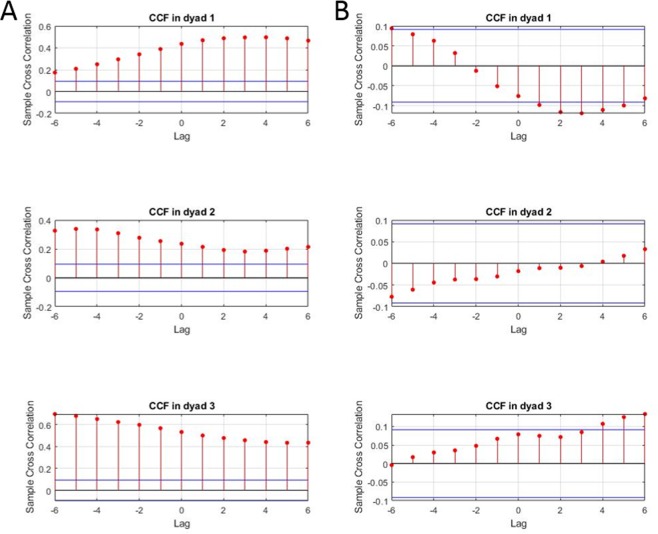
- IBI synchrony was computed using cross-correlation function analyses of dyadic IBI time series, then averaged to the group level. Main analyses included independent-samples t-tests, a linear mixed model predicting group cohesion, and a group-level hierarchical linear regression predicting improvisation coordination.
Limitations
- The paper states that prior familiarity was low and not equally distributed across task conditions; although controlled in analyses, future studies should test groups of strangers. It also states results are primarily relevant to newly formed groups and that gender/gender composition was not controlled.
- The paper states that IBI is influenced by both sympathetic and parasympathetic branches, so the study could not determine their relative balance. It also notes that physiological synchrony was computed dyadically and averaged to the group level, rather than capturing a true group-level biological mechanism.
- The paper states that a mediation model was precluded because the drumming condition was not significantly related to group IBI synchrony.
Model-written summary. Check it against the paper before relying on it.
Integrity signals
Registry
Cites
Statistics
Figures


Verification
Claims the paper makes
11 Valid · 0 Not valid · 22 Not checked · 41 Own results and interpretations
The cited sources support only part of this claim — read each source’s verdict below.
In the paper
“In dyads, it has been shown that increased heart rate synchronization and facial muscle synchronization occur automatically without direct interaction when individuals merely sit side by side and watch movies together58,59.”
§ Physiological and Behavioral Synchrony Predict Group Cohesion and Performance > Discussion
What the sources say
- Partly supportedcites [58] Golland, Y., Arzouan, Y. & Levit-Binnun, N. The mere co-presence: Synchronization of autonomic signals and emotional responses across co-present individuals not engaged in direct interaction. PLoS One 10, e0125804 (2015). sourceExperimental — accuracy not yet measured
The Results section (page not supplied) reports enhanced heart-rate synchronization among people who watched emotional movies together, and the Introduction says they sat side by side without directly interacting. The Methods section (page not supplied) lists ECG and electrodermal activity as the analyzed measures, not facial muscle activity, so this source does not support the facial-muscle synchronization part of the claim. (LLM, conf=0.89)
- Supportedcites [59] Golland, Y., Mevorach, D. & Levit-Binnun, N. Affiliative zygomatic synchrony in co-present strangers. Sci. Rep. 9, 3120 (2019). source
The Methods (Materials and Procedure; page unavailable) say participants sat side by side to watch movies and were asked not to talk. The Results report dyad-specific facial synchrony during both emotional movies and significantly higher heart-rate synchrony in co-viewing dyads during the positive movie; the Discussion characterizes the synchrony as spontaneous and supports automatic processes in the facial response. Heart-rate synchrony during the negative movie was only marginally significant. (LLM, conf=0.91)
plainstates a cause- Asserted: passes — The authors put it forward as true.
- Checkable: passes — It can be checked against evidence.
- Load-bearing: passes — The paper’s conclusions depend on it.
- Based: passes — The paper gives a reason why it holds.
- Partly supported
Every source the paper cites for this claim was checked and supports it.
In the paper
“For example, when people sing in unison, their heartbeats accelerate and decelerate simultaneously38.”
§ Physiological and Behavioral Synchrony Predict Group Cohesion and Performance > Introduction
What the sources say
- Supportedcites [38] Müller, V. & Lindenberger, U. Cardiac and respiratory patterns synchronize between persons during choir singing. PLoS One 6, e24893 (2011). source
The Results section (page unavailable) reports that heart-rate-variability patterns synchronized between choir members during singing and that synchronization was generally higher when they sang in unison. The claim is a plain-language description of that finding, though the paper describes a general pattern rather than every heartbeat changing at precisely the same instant. (LLM, conf=0.87)
plainstates an association- Asserted: passes — The authors put it forward as true.
- Checkable: passes — It can be checked against evidence.
- Load-bearing: unclear — It is unclear whether the paper’s conclusions depend on it.
- Based: passes — The paper gives a reason why it holds.
- Supported
The cited sources support only part of this claim — read each source’s verdict below.
In the paper
“In a separate study, dyadic-level ANS synchrony has been shown to support larger group-level phenomena, including mass participation in cultural rituals52.”
§ Physiological and Behavioral Synchrony Predict Group Cohesion and Performance > Introduction
What the sources say
- Partly supportedcites [52] Konvalinka, I. et al. Synchronized arousal between performers and related spectators in a fire-walking ritual. Proc. Natl Acad. Sci. 108, 8514–8519 (2011). sourceExperimental — accuracy not yet measured
The paper reports synchronized heart-rate dynamics between fire-walkers and related spectators during a collective ritual (p. 1). But the Discussion (p. 5) says it is unclear whether shared arousal drives the collective experience or emerges from it. The study therefore does not show that dyadic synchrony supports mass participation. (LLM, conf=0.86)
plainstates a cause- Asserted: passes — The authors put it forward as true.
- Checkable: passes — It can be checked against evidence.
- Load-bearing: unclear — It is unclear whether the paper’s conclusions depend on it.
- Based: passes — The paper gives a reason why it holds.
- Partly supported
The cited sources support only part of this claim — read each source’s verdict below.
In the paper
“It is an evolutionary-based mechanism that facilitates social bonding, cohesion and exchange (i.e., it is a “social glue”)1–4.”
§ Physiological and Behavioral Synchrony Predict Group Cohesion and Performance > Introduction
What the sources say
- Partly supportedcites [1] Tarr, B., Launay, J. & Dunbar, R. I. Silent disco: dancing in synchrony leads to elevated pain thresholds and social closeness. Evol. Hum. Behav. 37, 343–349, https://doi.org/10.1016/j.evolhumbehav.2016.02.004 (2016). sourceExperimental — accuracy not yet measured
The Introduction (page unavailable) describes synchrony as fostering social bonds, a sense of being on the same team, and prosocial cooperation, while proposing an evolutionary advantage for these effects. But the Discussion (page unavailable) reports that synchronised dancers did not make higher donations than the comparison groups, so the unqualified claim that it facilitates exchange goes beyond this study's findings. (LLM, conf=0.84)
- Not checked — no full text of the sourcecites [2] Miles, L. K., Lumsden, J., Richardson, M. J. & Macrae, C. N. Do birds of a feather move together? Group membership and behavioral synchrony. Exp. brain Res. 211, 495–503 (2011). source
- Not checked — no full text of the sourcecites [3] Sebanz, N., Bekkering, H. & Knoblich, G. Joint action: bodies and minds moving together. Trends Cognit. Sci. 10, 70–76 (2006). source
- Not checked — no full text of the sourcecites [4] Semin, G. R. & Cacioppo, J. T. Grounding social cognition: Synchronization, entrainment, and coordination. Embodied grounding: Social, cognitive, affective, and neuroscientific approaches, 119–147 (2008). source
plainstates a cause- Asserted: passes — The authors put it forward as true.
- Checkable: passes — It can be checked against evidence.
- Load-bearing: passes — The paper’s conclusions depend on it.
- Based: passes — The paper gives a reason why it holds.
- Partly supported
Every source the paper cites for this claim was checked and supports it.
In the paper
“Since the main physiological measure in the current study was IBI, which is influenced dynamically by both the sympathetic (S) and parasympathetic (P) branches of the ANS76”
§ Physiological and Behavioral Synchrony Predict Group Cohesion and Performance > Discussion
What the sources say
- Supportedcites [76] Berntson, G. G., Norman, G. J., Hawkley, L. C. & Cacioppo, J. T. Cardiac autonomic balance versus cardiac regulatory capacity. Psychophysiology 45, 643–652 (2008). source
The Methods describe parasympathetic control of heart-rate variability and sympathetic effects on cardiac chronotropy (heart rate). They also state that both branches contribute to low-frequency heart-rate variability, supporting the paraphrase that interbeat intervals are influenced by both branches. (LLM, conf=0.88)
plainstates a cause- Asserted: passes — The authors put it forward as true.
- Checkable: passes — It can be checked against evidence.
- Load-bearing: passes — The paper’s conclusions depend on it.
- Based: passes — The paper gives a reason why it holds.
- Supported
35 more claims · 1 with their cited sources checked
Create a free account to see all 74 claims and to verify the 1 reference still open.
- Probably not a substantial claim. 25
- It may state two separate claims as one. 14
Claims other papers make about this one
Each is checked against this paper’s own text: does it say what the citing paper says it does?
The cited source says what the claim attributes to it.
In the citing paper
“Yet, to date, much of the existing research on IPS has focused on contexts where individuals are explicitly instructed to perform a social task.”
From Interpersonal Synchronization of Autonomic Physiology via Mere Visual Contact (2026) · cites this paper as [31]
Statistics that don’t add up
Each reported p-value recomputed from its test statistic and degrees of freedom.
Rated minor: it would not touch a result — a value no result rests on, a p-value that stays on the same side of the significance level, or a conflict that is clerical, resolved elsewhere in the paper, or outside its own findings.
In the paper
“t(148) = 1.53, p = 0.12”
§ Physiological and Behavioral Synchrony Predict Group Cohesion and Performance > Method > Participants
Reported p = .12 · recomputed p = .128
Statistics recomputed
Every reported test result, recomputed from its test statistic and degrees of freedom. A result shows as not adding up only once an independent check has confirmed it.
- Doesn’t add upt(148) = 1.53reported p = .12 · recomputed p = .128
“t(148) = 1.53, p = .12”
- Consistentt(47) = -5.37reported p = .0001 · recomputed p < .001
“t(47) = −5.37, p = .0001”
The paper prints p at a floor (such as p < .001)
- ConsistentF(2, 44) = 3.99reported p = .025 · recomputed p = .026
“F(2,44) = 3.99, p = .025”
- Consistentt(147) = 3.9reported p = .0001 · recomputed p < .001
“t(147) = 3.9, p = .0001”
Self-check
Percentages, sums and reported differences re-computed from the paper’s own numbers.
Each contradiction between two passages listed here was confirmed by an independent check.
Rated minor: it would not touch a result — a value no result rests on, a p-value that stays on the same side of the significance level, or a conflict that is clerical, resolved elsewhere in the paper, or outside its own findings.
In the paper
§ Physiological and Behavioral Synchrony Predict Group Cohesion and Performance > Measures > Surveys
“We measured group cohesion with the following 4 items using a 1 to 6 Likert scale:”
§ Physiological and Behavioral Synchrony Predict Group Cohesion and Performance > Measures > Surveys
““If possible, I would be happy to participate in another group experiment with the members of my current work group”; “My group worked together as a team”; “We were cooperative with each other”; and “We knew that we could rely on one another” and “We were supportive”.”
Rated minor: it would not touch a result — a value no result rests on, a p-value that stays on the same side of the significance level, or a conflict that is clerical, resolved elsewhere in the paper, or outside its own findings.
In the paper
§ Physiological and Behavioral Synchrony Predict Group Cohesion and Performance > Method > Participants
“These three items were rated on a Likert scale ranging from 1 to 5 (1 = “not at all”; 5 = “very much so”) and had a mean of 1.90 (SD = 0.93).”
§ Physiological and Behavioral Synchrony Predict Group Cohesion and Performance > Method > Participants
“M = 2.51, SD = 1.12; M = 2.24, SD = 1.07, for the synchronized and asynchronized conditions, respectively”
Rated minor: it would not touch a result — a value no result rests on, a p-value that stays on the same side of the significance level, or a conflict that is clerical, resolved elsewhere in the paper, or outside its own findings.
In the paper
§ Physiological and Behavioral Synchrony Predict Group Cohesion and Performance > Results > IBI synchrony during the drumming task
“t(47) = −5.37, p = 0.0001, 95% CI = −0.2–0.09.”
§ Physiological and Behavioral Synchrony Predict Group Cohesion and Performance > Results > IBI synchrony during the drumming task
“There was a significant increase in IBI synchrony from the baseline in all groups during the drumming task”
Citations
Cites
Development and validation of brief measures of positive and negative affect: The PANAS scales.
Watson, D., Clark, L. A., & Tellegen, A. (1988) · Journal of Personality and Social Psychology · doi:10.1037/0022-3514.54.6.1063 · Cited by 32,433
Heart rate variability: origins, methods, and interpretive caveats
BERNTSON, G. G., THOMAS BIGGER, J., ECKBERG, D. L., GROSSMAN, P., KAUFMANN, P. G., MALIK, M., NAGARAJA, H. N., PORGES, S. W., SAUL, J. P., STONE, P. H., et al. (1997) · Psychophysiology · doi:10.1111/j.1469-8986.1997.tb02140.x · Cited by 3,962
The Analysis of Time Series: An Introduction
Dickey, D. A., & Chatfield, C. (1991) · Technometrics · doi:10.2307/1268794 · Cited by 3,525
Joint action: bodies and minds moving together
SEBANZ, N., BEKKERING, H., & KNOBLICH, G. (2006) · Trends in Cognitive Sciences · doi:10.1016/j.tics.2005.12.009 · Cited by 1,950
Wiltermuth, S. S., & Heath, C. (2009) · Psychological Science · doi:10.1111/j.1467-9280.2008.02253.x · Cited by 1,717
The polyvagal theory: phylogenetic substrates of a social nervous system.
Porges, S. W. (2001) · International Journal of Psychophysiology · doi:10.1016/s0167-8760(01)00162-3 · Cited by 1,582
Dunbar, R. I. M., & Shultz, S. (2007) · Science · doi:10.1126/science.1145463 · Cited by 1,542
Sensorimotor synchronization: A review of the tapping literature
Repp, B. H. (2005) · Psychonomic Bulletin & Review · doi:10.3758/bf03206433 · Cited by 1,462
The relation between group cohesiveness and performance: An integration.
Mullen, B., & Copper, C. (1994) · Psychological Bulletin · doi:10.1037/0033-2909.115.2.210 · Cited by 1,398
It's All in the Timing: Interpersonal Synchrony Increases Affiliation
Hove, M. J., & Risen, J. L. (2009) · Social Cognition · doi:10.1521/soco.2009.27.6.949 · Cited by 1,334
Research works printed but not linked: 2
- Bednar, R. L. & Lawlis, G. F. Empirical research in group psychotherapy. Handb. psychotherapy Behav. change 812, 838 (1971).
- Cartwright, D. The nature of group cohesiveness. Group. dynamics: Res. theory 91, 109 (1968).
Cited by
Dance on the Brain: Enhancing Intra- and Inter-Brain Synchrony
Basso, J. C., Satyal, M. K., & Rugh, R. (2021) · Frontiers in Human Neuroscience · doi:10.3389/fnhum.2020.584312 · Cited by 185
Conscious processing of narrative stimuli synchronizes heart rate between individuals
Pérez, P., Madsen, J., Banellis, L., Türker, B., Raimondo, F., Perlbarg, V., Valente, M., Niérat, M.-C., Puybasset, L., Naccache, L., et al. (2021) · Cell Reports · doi:10.1016/j.celrep.2021.109692 · Cited by 139
Felice, S. D., Hamilton, A. F. D. C., Ponari, M., & Vigliocco, G. (2022) · Philosophical Transactions of the Royal Society B Biological Sciences · doi:10.1098/rstb.2021.0357 · Cited by 178
The social neuroscience of music: Understanding the social brain through human song.
Greenberg, D. M., Decety, J., & Gordon, I. (2021) · American Psychologist · doi:10.1037/amp0000819 · Cited by 110
Self-citationCognitive processing of a common stimulus synchronizes brains, hearts, and eyes
Madsen, J., & Parra, L. C. (2022) · PNAS Nexus · doi:10.1093/pnasnexus/pgac020 · Cited by 91
Metadata
- Authors
- Gordon, I., Gilboa, A., Cohen, S., Milstein, N., Haimovich, N., Pinhasi, S., & Siegman, S.
- Affiliations
- Bar-Ilan University (IL)
- Ruppin Academic Center (IL)
- Corresponding author
- Gordon, Ilanit
- Venue
- Scientific Reports
- Published
- 2020-05-21
- Volume
- 10
- Issue
- 1
- Pages
- 8484-8484
- ISSN
- 2045-2322 (ISSN-L)
- PMC
- PMC7242382
- OpenAlex
- W3026067404
- Cited by
- 146
- References
- 92
- Citations by year
- 2026: 33 · 2025: 25 · 2024: 25 · 2023: 22 · 2022: 19 · 2021: 21 · 2020: 1
- FWCI
- 17.21
- Type
- journal article
- Language
- en
- Open access
- gold
- doi.org
- Licence
- cc-by
- creativecommons.org/licenses/by/4.0 (tdm)
- creativecommons.org/licenses/by/4.0 (vor)
- Locations
- Scientific Reports (publishedVersion, cc-by)
- PubMed Central (publishedVersion, cc-by)
- PubMed (publishedVersion)
- Funders
- Israel Science Foundation (2096/15, 1726/15)
- Funding provided by Negotiation and Team Resources under the NTR-INGroup research grant program
- Topics
- Social Sciences › Psychology › Social Psychology › Action Observation and Synchronization
- Life Sciences › Neuroscience › Cognitive Neuroscience › Neuroscience and Music Perception
- Social Sciences › Psychology › Social Psychology › Team Dynamics and Performance
- Keywords
- interpersonal synchrony, group cohesion, physiological synchrony, heart rate, RR interval, group performance, social coordination, group bonding, social neuroscience
- MeSH terms
- Adult, Cooperative Behavior, Female, Group Processes, Humans, Interpersonal Relations, Male, Motor Activity, Music, Problem Solving, Social Behavior, Task Performance and Analysis, Young Adult
About these checks
Registry, retraction, Cites and statistics results are computed, not judged, with one exception: a printed reference that no index lists is read once by a model before it counts as a citation error. Claims are extracted by a model and kept only when their quote appears verbatim in the text; each cited source is then checked, with a model’s help, for whether it says what the claim relies on. Those verdicts can be wrong — read the claim’s quote and the cited source before relying on one.
The claim verdicts this report counts are experimental: their accuracy is not yet measured.
A language model drew the claims from the paper on 2026-10-10, under version 3 of the claim definition (model deepseek-v4.1-flash, prompt extract-v3).
A second model labelled each claim on 2026-10-10 (model jev-1.13-20260917, definition revision gold-guideline-v0.2).
Cited sources are checked with a language model’s help (gpt-6-sol).
Statistics and arithmetic are recomputed, not judged.
Confidence bands are shown only for fields calibrated on our annotated test set. None is calibrated yet, so no band is shown.
What counts as a claim ›How we measure confidence ›How we check this ›
Are you an author, or do you see a problem with this page? Request a review
How to cite
Cite CoChat for the checks on this page, and the paper for its own findings.
- This page
- CoChat. (2026). Citation check: Physiological and Behavioral Synchrony Predict Group Cohesion and Performance. https://app.cochat.ai/papers/10.1038/s41598-020-65670-1
- The paper
- Gordon, I., Gilboa, A., Cohen, S., Milstein, N., Haimovich, N., Pinhasi, S., & Siegman, S. (2020). Physiological and Behavioral Synchrony Predict Group Cohesion and Performance. Scientific Reports. https://doi.org/10.1038/s41598-020-65670-1
Data sources
Bibliographic data: Semantic Scholar, OpenAlex, Crossref.
Contains information from the Semantic Scholar Academic Graph Datasets, made available under the ODC Attribution License (ODC-BY 1.0).
Semantic Scholar’s data is described in: Kinney, R., et al. (2023). The Semantic Scholar Open Data Platform. arXiv:2301.10140.
