

The DOI matches its Crossref record; 31 of the 31 references it cites were found in a registry or an index.
Feasibility of continuous fever monitoring using wearable devices
Open accessPublished version of a preprint
Abstract
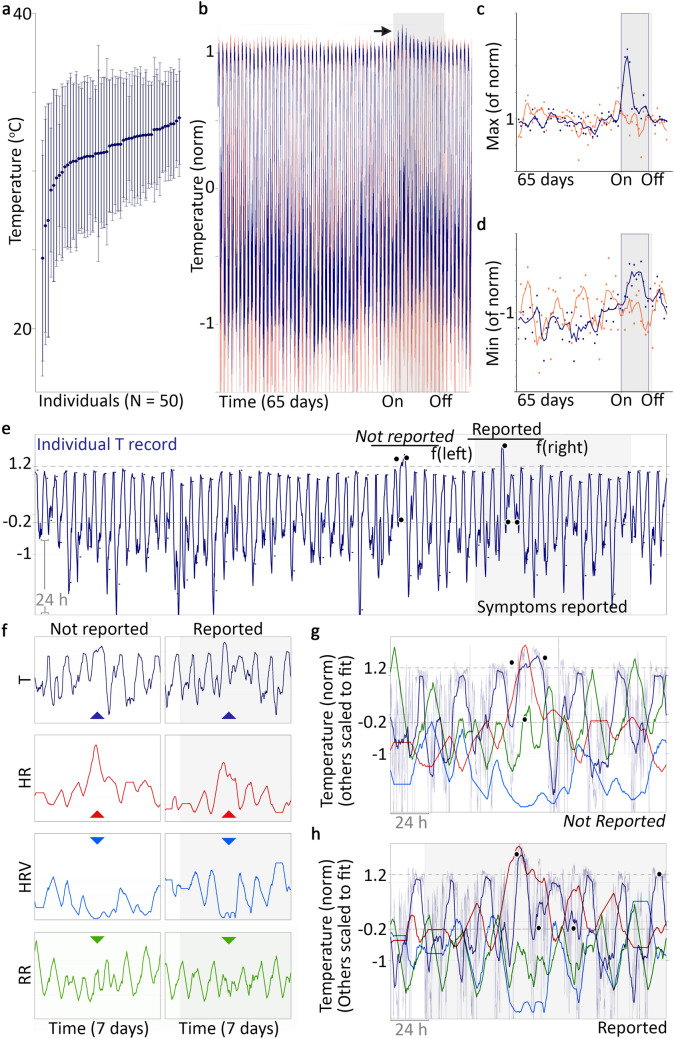
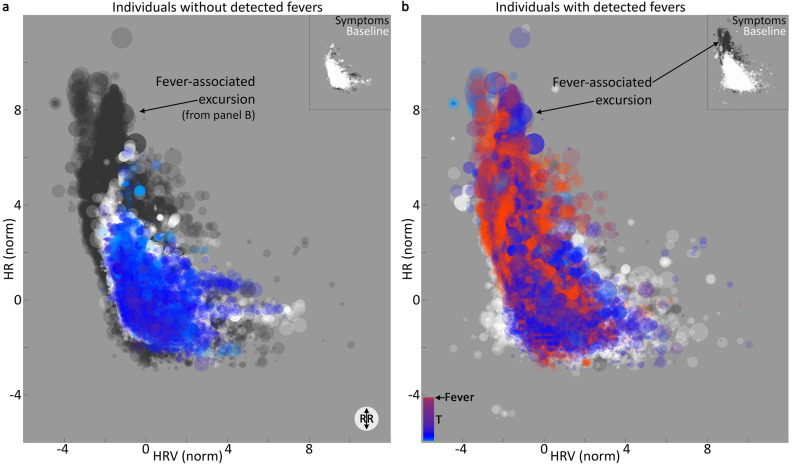
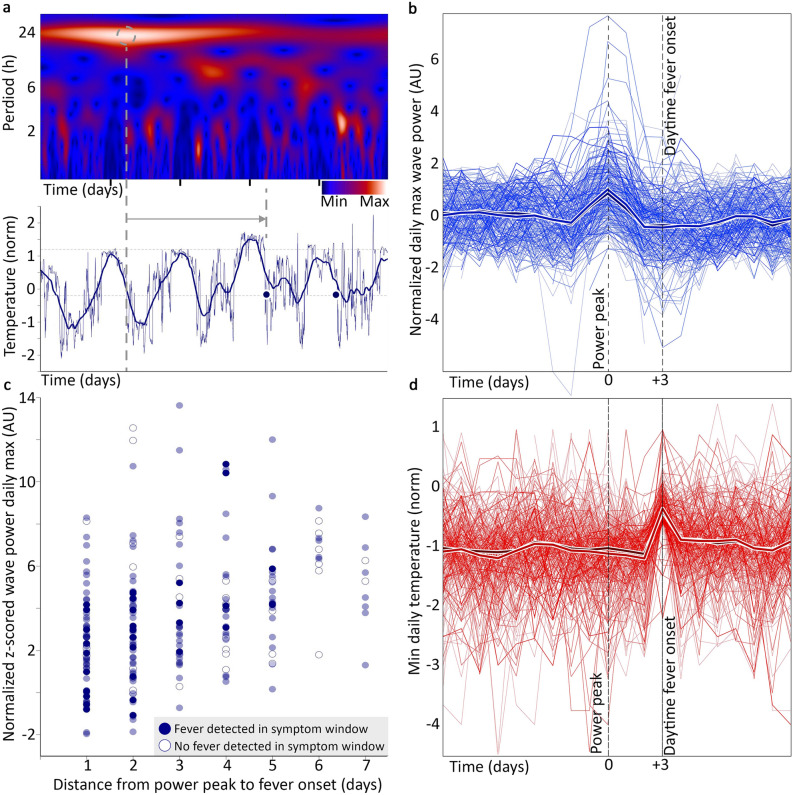
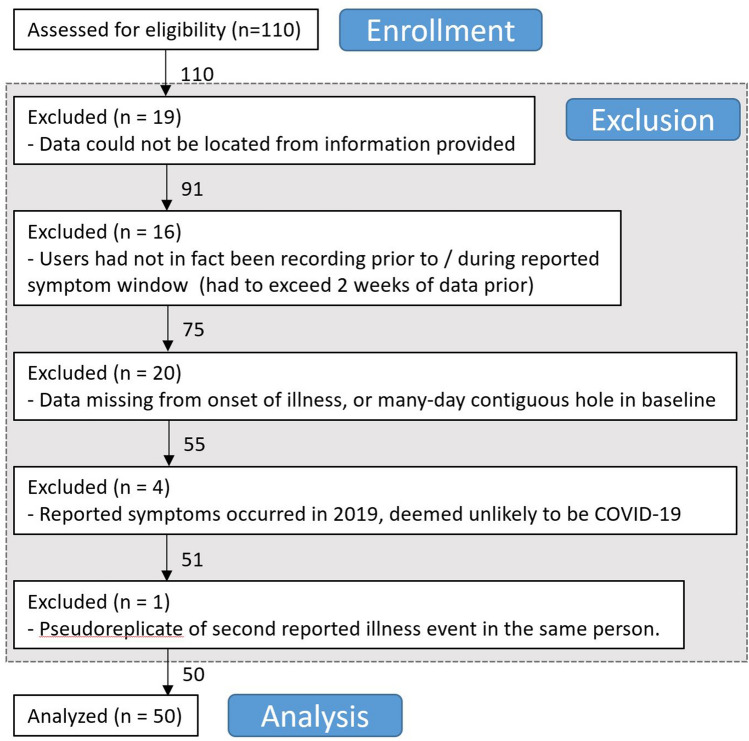
Elevated core temperature constitutes an important biomarker for COVID-19 infection; however, no standards currently exist to monitor fever using wearable peripheral temperature sensors. Evidence that sensors could be used to develop fever monitoring capabilities would enable large-scale health-monitoring research and provide high-temporal resolution data on fever responses across heterogeneous populations. We launched the TemPredict study in March of 2020 to capture continuous physiological data, including peripheral temperature, from a commercially available wearable device during the novel coronavirus pandemic. We coupled these data with symptom reports and COVID-19 diagnosis data. Here we report findings from the first 50 subjects who reported COVID-19 infections. These cases provide the first evidence that illness-associated elevations in peripheral temperature are observable using wearable devices and correlate with self-reported fever. Our analyses support the hypothesis that wearable sensors can detect illnesses in the absence of symptom recognition. Finally, these data support the hypothesis that prediction of illness onset is possible using continuously generated physiological data collected by wearable sensors. Our findings should encourage further research into the role of wearable sensors in public health efforts aimed at illness detection, and underscore the importance of integrating temperature sensors into commercially available wearables.
Overview
The claims and statistics of this paper haven’t been checked yet.
Run the check — free, no account needed. It reads the open-access text and checks the sources it cites.
Integrity signals
Registry
Cites
Statistics
Figures
Verification
Claims the paper makes
The claims and statistics of this paper haven’t been checked yet.
Run the check — free, no account needed. It reads the open-access text and checks the sources it cites.
Claims other papers make about this one
Each is checked against this paper’s own text: does it say what the citing paper says it does?
The source backs part of the claim, not all of it — or backs it for a different population, condition or comparison.
In the citing paper
“For each 24-h period, we discarded wearable sensor-assessed distal body temperature values below the 5th percentile value and above the 95th percentile. This served to exclude periods of non-wear and periods of clinical fever and to minimize influence from non-representative extreme values (e.g., outliers), as done in prior research with wearable sensor-assessed metrics51,52.”
From Sleep and temperature data from wearable devices support noninvasive detection of diabetes mellitus in a large-scale, retrospective analysis (2026) · cites this paper as [52]
Experimental — accuracy not yet measured
Self-check
Percentages, sums and reported differences re-computed from the paper’s own numbers.
The self-check needs the paper’s full text.
Citations
Cites
Zhou, F., Yu, T., Du, R., Fan, G., Liu, Y., Liu, Z., Xiang, J., Wang, Y., Song, B., Gu, X., et al. (2020) · The Lancet · doi:10.1016/s0140-6736(20)30566-3 · Cited by 27,263
Dissecting racial bias in an algorithm used to manage the health of populations
Obermeyer, Z., Powers, B., Vogeli, C., & Mullainathan, S. (2019) · Science · doi:10.1126/science.aax2342 · Cited by 7,137
Heart rate variability: A review
Rajendra Acharya, U., Paul Joseph, K., Kannathal, N., Lim, C. M., & Suri, J. S. (2006) · Medical & Biological Engineering & Computing · doi:10.1007/s11517-006-0119-0 · Cited by 2,820
Potential Biases in Machine Learning Algorithms Using Electronic Health Record Data
Gianfrancesco, M. A., Tamang, S., Yazdany, J., & Schmajuk, G. (2018) · JAMA Internal Medicine · doi:10.1001/jamainternmed.2018.3763 · Cited by 1,395
Circadian rhythms, sleep, and the menstrual cycle
Baker, F. C., & Driver, H. S. (2007) · Sleep Medicine · doi:10.1016/j.sleep.2006.09.011 · Cited by 529
Generalized Morse Wavelets as a Superfamily of Analytic Wavelets
Lilly, J. M., & Olhede, S. C. (2012) · IEEE Transactions on Signal Processing · doi:10.1109/tsp.2012.2210890 · Cited by 510
Estimated effectiveness of symptom and risk screening to prevent the spread of COVID-19
Gostic, K., Gomez, A. C., Mummah, R. O., Kucharski, A. J., & Lloyd-Smith, J. O. (2020) · eLife · doi:10.7554/elife.55570 · Cited by 417
The pathophysiological basis and consequences of fever
Walter, E. J., Hanna-Jumma, S., Carraretto, M., & Forni, L. G. (2016) · Critical Care · doi:10.1186/s13054-016-1375-5 · Cited by 340
Sleep, circadian rhythms and health
Foster, R. G. (2020) · Interface Focus · doi:10.1098/rsfs.2019.0098 · Cited by 286
Kleinberg, J., Ludwig, J., Mullainathan, S., & Rambachan, A. (2018) · AEA Papers and Proceedings · doi:10.1257/pandp.20181018 · Cited by 278
Neural Mechanisms of Inflammation-Induced Fever
Blomqvist, A. G., & Engblom, D. (2018) · The Neuroscientist · doi:10.1177/1073858418760481 · Cited by 197
Fever and hypothermia in systemic inflammation
Garami, A., Steiner, A. A., & Romanovsky, A. A. (2018) · Handbook of clinical neurology · doi:10.1016/b978-0-444-64074-1.00034-3 · Cited by 148
Chen, H.-Y., Chen, A., & Chen, C. (2020) · Sensors · doi:10.3390/s20102885 · Cited by 139
Maijala, A., Kinnunen, H., Koskimäki, H., Jämsä, T., & Kangas, M. (2019) · BMC Women's Health · doi:10.1186/s12905-019-0844-9 · Cited by 107
Do fever and anapyrexia exist? Analysis of set point-based definitions
Romanovsky, A. A. (2004) · American Journal of Physiology-Regulatory, Integrative and Comparative Physiology · doi:10.1152/ajpregu.00068.2004 · Cited by 99
Mouchtouri, V. Α., Christoforidou, E. P., der Heiden, M. A., Lemos, Fanos, M., Rexroth, U., Grote, U., Belfroid, E., Swaan, C. M., & Hadjichristodoulou, C. S. (2019) · International Journal of Environmental Research and Public Health · doi:10.3390/ijerph16234638 · Cited by 98
Sleep quality and circadian rhythm disruption in the intensive care unit: a review
Boyko, Y., Jennum, P., & Toft, P. (2017) · Nature and Science of Sleep · doi:10.2147/nss.s151525 · Cited by 96
Wavelet analysis of circadian and ultradian behavioral rhythms
Leise, T. (2013) · Journal of Circadian Rhythms · doi:10.1186/1740-3391-11-5 · Cited by 84
Sex differences in variability across timescales in BALB/c mice
Smarr, B. L., Grant, A. D., Zucker, I., Prendergast, B. J., & Kriegsfeld, L. J. (2017) · Biology of Sex Differences · doi:10.1186/s13293-016-0125-3 · Cited by 78
Self-citationThe Effect of Population and "Structural" Biases on Social Media-based Algorithms
Johnson, I. L., McMahon, C., Schöning, J., & Hecht, B. J. (2017) · CHI Conference on Human Factors in Computing Systems · doi:10.1145/3025453.3026015 · Cited by 62
The Circadian Clock as an Essential Molecular Link Between Host Physiology and Microorganisms
Murakami, M., & Tognini, P. (2020) · Frontiers in Cellular and Infection Microbiology · doi:10.3389/fcimb.2019.00469 · Cited by 58
Smarr, B. L., Zucker, I., & Kriegsfeld, L. J. (2016) · PLOS ONE · doi:10.1371/journal.pone.0160127 · Cited by 54
Self-citationGlymour, B., & Herington, J. (2019) · Proceedings of the Conference on Fairness, Accountability, and Transparency · doi:10.1145/3287560.3287573 · Cited by 50
Agreement between self-report and medical records on signs and symptoms of respiratory illness
Barbara, A. M., Loeb, M. B., Dolovich, L. R., Brazil, K., & Russell, M. L. (2012) · Primary Care Respiratory Journal · doi:10.4104/pcrj.2011.00098 · Cited by 46
Evidence for a Coupled Oscillator Model of Endocrine Ultradian Rhythms
Grant, A. D., Wilsterman, K., Smarr, B. L., & Kriegsfeld, L. J. (2018) · Journal of Biological Rhythms · doi:10.1177/0748730418791423 · Cited by 39
Self-citationSmarr, B. L., Burnett, D. C., Mesri, S. M., Pister, K. S. J., & Kriegsfeld, L. J. (2015) · IEEE Transactions on Affective Computing · doi:10.1109/taffc.2015.2511762 · Cited by 32
Self-citationWavelet-Based Analysis of Circadian Behavioral Rhythms
Leise, T. (2014) · Methods in enzymology on CD-ROM/Methods in enzymology · doi:10.1016/bs.mie.2014.10.011 · Cited by 29
Accuracy of Self-Reported Health Histories: A Study
Bradford, V. P., Graham, B. P., & Reinert, K. G. (1993) · Military Medicine · doi:10.1093/milmed/158.4.263 · Cited by 19
Wearable Digital Thermometer Improves Fever Detection
Abbasi, J. (2017) · JAMA · doi:10.1001/jama.2017.10248 · Cited by 16
Kim, Y.-Y., Park, J. H., Kang, H.-J., Lee, E.-J., Ha, S., & Shin, S. (2017) · Journal of Preventive Medicine and Public Health · doi:10.3961/jpmph.17.024 · Cited by 15
Mouchtouri, V. A., Christoforidou, E. P., An Der Heiden, M., et al. (2019) · Robert-Koch-Institut (RKI) · doi:10.25646/6623 · Cited by 12
Cited by
Sorted by citations
Inflammasome activation in infected macrophages drives COVID-19 pathology
Sefik, E., Qu, R., Junqueira, C., Kaffe, E., Mirza, H., Zhao, J., Brewer, J. R., Han, A., Steach, H. R., Israelow, B., et al. (2022) · Nature · doi:10.1038/s41586-022-04802-1 · Cited by 543
The Rise of Wearable Devices during the COVID-19 Pandemic: A Systematic Review
Channa, A., Popescu, N., Skibinska, J., & Burget, R. (2021) · Sensors · doi:10.3390/s21175787 · Cited by 209
E-Tattoos: Toward Functional but Imperceptible Interfacing with Human Skin
Li, H., Tan, P., Rao, Y., Bhattacharya, S., Wang, Z., Kim, S., Gangopadhyay, S., Shi, H., Jankovic, M., Huh, H., et al. (2024) · Chemical Reviews · doi:10.1021/acs.chemrev.3c00626 · Cited by 144
Roos, L. G., & Slavich, G. M. (2023) · Brain Behavior and Immunity · doi:10.1016/j.bbi.2023.08.008 · Cited by 111
Passive detection of COVID-19 with wearable sensors and explainable machine learning algorithms
Gadaleta, M., Radin, J. M., Baca-Motes, K., Ramos, E., Kheterpal, V., Topol, E. J., Steinhubl, S. R., & Quer, G. (2021) · npj Digital Medicine · doi:10.1038/s41746-021-00533-1 · Cited by 94
Metadata
- Authors
- Smarr, B. L., Aschbacher, K., Fisher, S. M., Chowdhary, A., Dilchert, S., Puldon, K., Rao, A., Hecht, F. M., & Mason, A. E.
- Affiliations
- University of California San Diego (US)
- University of California, San Francisco (US)
- Baruch College (US)
- Corresponding author
- Smarr, Benjamin L.
- ORCID
- Venue
- Scientific Reports
- Published
- 2020-12-14
- Volume
- 10
- Issue
- 1
- Pages
- 21640-21640
- ISSN
- 2045-2322 (ISSN-L)
- PMC
- PMC7736301
- OpenAlex
- W3112300562
- Cited by
- 133
- References
- 30
- Citations by year
- 2026: 7 · 2025: 12 · 2024: 19 · 2023: 20 · 2022: 44 · 2021: 31
- FWCI
- 7.46
- Type
- journal article
- Language
- en
- Update notices
- correction (2022-03-15)
- Open access
- gold
- doi.org
- Locations
- Scientific Reports (publishedVersion, cc-by)
- Research Square (acceptedVersion, cc-by)
- PubMed Central (publishedVersion, cc-by)
- PubMed (publishedVersion)
- CUNY Academic Works (City University of New York) (submittedVersion, cc-by)
- DOAJ (DOAJ: Directory of Open Access Journals) (submittedVersion, cc-by-sa)
- eScholarship (California Digital Library) (submittedVersion)
- eScholarship (California Digital Library) (submittedVersion, cc-by)
- Funders
- Oura Health Oy
- Topics
- Physical Sciences › Engineering › Biomedical Engineering › Non-Invasive Vital Sign Monitoring
- Health Sciences › Medicine › Radiology, Nuclear Medicine and Imaging › Infrared Thermography in Medicine
- Health Sciences › Medicine › Epidemiology › Data-Driven Disease Surveillance
- Keywords
- COVID-19 pandemic, fever monitoring, wearable devices, peripheral temperature, core body temperature, symptom reporting, health monitoring
- MeSH terms
- Wearable Electronic Devices, COVID-19, Adult, Aged, Feasibility Studies, Female, Fever, Humans, Male, Middle Aged, Monitoring, Physiologic, Telemedicine, Young Adult, Self Report, Thermometry
About these checks
Registry, retraction, Cites and statistics results are computed, not judged, with one exception: a printed reference that no index lists is read once by a model before it counts as a citation error. Claims are extracted by a model and kept only when their quote appears verbatim in the text; each cited source is then checked, with a model’s help, for whether it says what the claim relies on. Those verdicts can be wrong — read the claim’s quote and the cited source before relying on one.
Statistics and arithmetic are recomputed, not judged.
Confidence bands are shown only for fields calibrated on our annotated test set. None is calibrated yet, so no band is shown.
What counts as a claim ›How we measure confidence ›How we check this ›
Are you an author, or do you see a problem with this page? Request a review
