

The DOI matches its Crossref record; 71 of the 71 references it cites were found in a registry or an index.
Coupling machine learning and crop modeling improves crop yield prediction in the US Corn Belt
Open accessAbstract
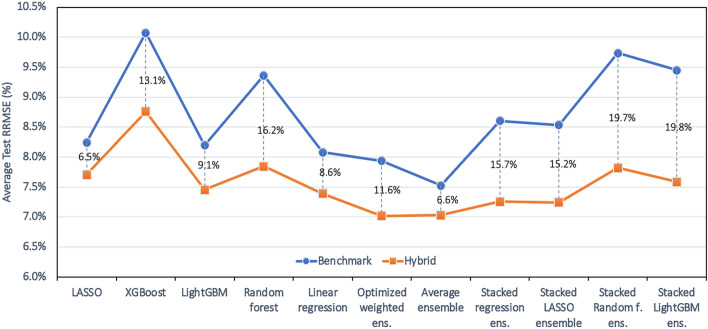
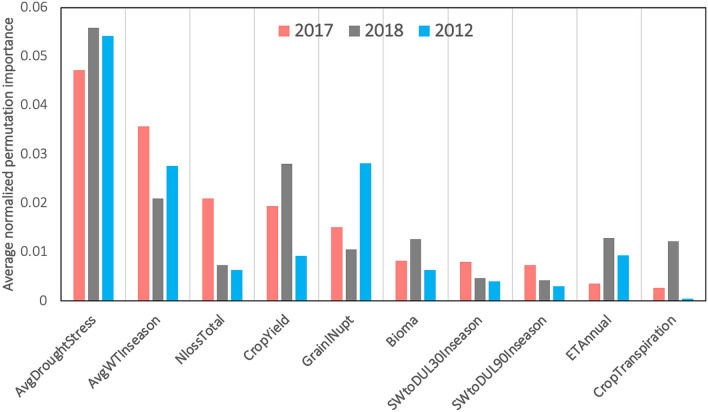
This study investigates whether coupling crop modeling and machine learning (ML) improves corn yield predictions in the US Corn Belt. The main objectives are to explore whether a hybrid approach (crop modeling + ML) would result in better predictions, investigate which combinations of hybrid models provide the most accurate predictions, and determine the features from the crop modeling that are most effective to be integrated with ML for corn yield prediction. Five ML models (linear regression, LASSO, LightGBM, random forest, and XGBoost) and six ensemble models have been designed to address the research question. The results suggest that adding simulation crop model variables (APSIM) as input features to ML models can decrease yield prediction root mean squared error (RMSE) from 7 to 20%. Furthermore, we investigated partial inclusion of APSIM features in the ML prediction models and we found soil moisture related APSIM variables are most influential on the ML predictions followed by crop-related and phenology-related variables. Finally, based on feature importance measure, it has been observed that simulated APSIM average drought stress and average water table depth during the growing season are the most important APSIM inputs to ML. This result indicates that weather information alone is not sufficient and ML models need more hydrological inputs to make improved yield predictions.
Overview
The claims and statistics of this paper haven’t been checked yet.
Free: it reads the open-access text and checks the first 5 claims that cite a source we can check. Create a free account to check every claim.
Integrity signals
Registry
Cites
Statistics
Figures




Verification
Claims the paper makes
The claims and statistics of this paper haven’t been checked yet.
Free: it reads the open-access text and checks the first 5 claims that cite a source we can check. Create a free account to check every claim.
Claims other papers make about this one
Each is checked against this paper’s own text: does it say what the citing paper says it does?
The cited source says what the claim attributes to it.
In the citing paper
“Additionally, in a recent study using a hybrid machine learning and crop growth model prediction system, the authors found that water-related features (e.g.average drought stress, average water table in season) were important, although not as important as the trend in genetic and management improvements over time (Shahhosseini et al. 2021).”
From Yield Prediction Through Integration of Genetic, Environment, and Management Data Through Deep Learning (2023) · cites this paper as Shahhosseini et al. 2021
Self-check
Percentages, sums and reported differences re-computed from the paper’s own numbers.
The self-check needs the paper’s full text.
Citations
Cites
Breiman, L. (2001) · Machine Learning · doi:10.1023/a:1010933404324 · Cited by 133,538
XGBoost: A Scalable Tree Boosting System
Chen, T., & Guestrin, C. (2016) · Proceedings of the 22nd ACM SIGKDD International Conference on Knowledge Discovery and Data Mining · doi:10.1145/2939672.2939785 · Cited by 54,569
Regression shrinkage and selection via the lasso
Tibshirani, R. (1996) · Journal of the Royal Statistical Society Series B: Statistical Methodology · doi:10.1111/j.2517-6161.1996.tb02080.x · Cited by 51,482
Breiman, L. (1996) · Machine Learning · doi:10.1007/bf00058655 · Cited by 16,325
An Introduction to Statistical Learning
James, G., Witten, D., Hastie, T., & Tibshirani, R. (2013) · Springer Texts in Statistics · doi:10.1007/978-1-4614-7138-7 · Cited by 12,106
Wolpert, D. H. (1992) · Neural Networks · doi:10.1016/s0893-6080(05)80023-1 · Cited by 7,951
Random forests for classification in ecology
Cutler, D. R., Edwards, T. C., Beard, K. H., Cutler, A., Hess, K. T., Gibson, J., & Lawler, J. J. (2007) · Ecology · doi:10.1890/07-0539.1 · Cited by 4,950
Bias in random forest variable importance measures: Illustrations, sources and a solution
Strobl, C., Boulesteix, A.-L., Zeileis, A., & Hothorn, T. (2007) · BMC Bioinformatics · doi:10.1186/1471-2105-8-25 · Cited by 3,688
SWAT: Model Use, Calibration, and Validation
Arnold, J. G., Moriasi, D. N., Gassman, P. W., Abbaspour, K. C., White, M. J., Srinivasan, R., Santhi, C., Harmel, R. D., van Griensven, A., Liew, M. W. V., et al. (2012) · Transactions of the ASABE · doi:10.13031/2013.42256 · Cited by 3,450
An overview of APSIM, a model designed for farming systems simulation
Keating, B. A., Carberry, P. S., Hammer, G. L., Probert, M. E., Robertson, M. J., Holzworth, D., Huth, N. I., Hargreaves, J. N. G., Meinke, H., Hochman, Z., et al. (2003) · European Journal of Agronomy · doi:10.1016/s1161-0301(02)00108-9 · Cited by 2,878
Research works printed but not linked: 7
- Basso, B. & Liu, L. Chapter four—Seasonal crop yield forecast: Methods, applications, and accuracies. In Advances in Agronomy Vol. 154 (ed. Sparks, D. L.) 201–255 (Academic Press, Cambridge, 2019).
- Nain, A. S., Dadhwal, V. K. & Singh, T. P. Real time wheat yield assessment using technology trend and crop simulation model with minimal data set. Curr. Sci. 82, 1255–1258 (2002).
- Campbell, G. S. Soil Physics with BASIC: Transport Models for Soil–Plant Systems (Elsevier, Amsterdam, 1985).
- Snoek, J., Larochelle, H. & Adams, R. P. Practical Bayesian optimization of machine learning algorithms. Adv. Neural Inf. Process. Syst. 25, 2951–2959 (2012).
- Ke, G., Meng, Q., Finley, T., Wang, T., Chen, W., Ma, W., Ye, Q. and Liu, T.Y. LightGBM: A highly efficient gradient boosting decision tree. in Advances in neural information processing systems 3146–3154 (2017).
- Zheng, A. Evaluating Machine Learning Models: A Beginner’s Guide to Key Concepts and Pitfalls (O’Reilly Media, Sebastopol, 2015).
- Kuwata, K. & Shibasaki, R. Estimating corn yield in the United States with MODIS EVI and machine learning methods. PISRN Photogramm. Remote Sens. Spat. Inf. Sci 3, 131–136 (2016).
Cited by
Forecasting wholesale prices of yellow corn through the Gaussian process regression
Jin, B., & Xu, X. (2024) · Neural Computing and Applications · doi:10.1007/s00521-024-09531-2 · Cited by 277
Jabed, M. A., & Azmi Murad, M. A. (2024) · Heliyon · doi:10.1016/j.heliyon.2024.e40836 · Cited by 250
Wholesale price forecasts of green grams using the neural network
Jin, B., & Xu, X. (2025) · Asian Journal of Economics and Banking · doi:10.1108/ajeb-01-2024-0007 · Cited by 241
Peanut oil price change forecasts through the neural network
Jin, B., Xu, X., & Zhang, Y. (2025) · foresight · doi:10.1108/fs-01-2023-0016 · Cited by 212
Thermal coal futures trading volume predictions through the neural network
Jin, B., Xu, X., & Zhang, Y. (2025) · Journal of Modelling in Management · doi:10.1108/jm2-09-2023-0207 · Cited by 215
Metadata
- Authors
- Shahhosseini, M., Hu, G., Huber, I., & Archontoulis, S. V.
- Affiliations
- Iowa State University (US)
- Corresponding author
- Hu, Guiping
- Venue
- Scientific Reports
- Published
- 2021-01-15
- Volume
- 11
- Issue
- 1
- Pages
- 1606-1606
- ISSN
- 2045-2322 (ISSN-L)
- PMC
- PMC7810832
- OpenAlex
- W3048168082
- Cited by
- 452
- References
- 68
- Citations by year
- 2026: 100 · 2025: 118 · 2024: 87 · 2023: 69 · 2022: 49 · 2021: 29
- FWCI
- 35.71
- Type
- journal article
- Language
- en
- Open access
- gold
- doi.org
- Licence
- cc-by
- creativecommons.org/licenses/by/4.0 (tdm)
- creativecommons.org/licenses/by/4.0 (vor)
- Locations
- Scientific Reports (publishedVersion, cc-by)
- Europe PMC (PubMed Central) (publishedVersion, other-oa)
- PubMed Central (publishedVersion, cc-by)
- PubMed (publishedVersion)
- arXiv (Cornell University) (submittedVersion)
- DOAJ (DOAJ: Directory of Open Access Journals) (submittedVersion, cc-by-sa)
- arXiv (Cornell University) (public-domain)
- Funders
- National Science Foundation (1830478)
- Topics
- Life Sciences › Agricultural and Biological Sciences › Plant Science › Smart Agriculture and AI
- Life Sciences › Agricultural and Biological Sciences › Agronomy and Crop Science › Climate change impacts on agriculture
- Physical Sciences › Environmental Science › Ecology › Remote Sensing in Agriculture
- Keywords
- corn yield prediction, crop growth simulation, machine learning, hybrid modeling, APSIM, Corn Belt, soil moisture, drought stress, water table depth, crop phenology, feature importance, ensemble learning
- MeSH terms
- Machine Learning, Crop Production, Climate, Zea mays, United States
About these checks
Registry, retraction, Cites and statistics results are computed, not judged, with one exception: a printed reference that no index lists is read once by a model before it counts as a citation error. Claims are extracted by a model and kept only when their quote appears verbatim in the text; each cited source is then checked, with a model’s help, for whether it says what the claim relies on. Those verdicts can be wrong — read the claim’s quote and the cited source before relying on one.
Statistics and arithmetic are recomputed, not judged.
Confidence bands are shown only for fields calibrated on our annotated test set. None is calibrated yet, so no band is shown.
What counts as a claim ›How we measure confidence ›How we check this ›
Are you an author, or do you see a problem with this page? Request a review
How to cite
Cite CoChat for the checks on this page, and the paper for its own findings.
- This page
- CoChat. (2026). Citation check: Coupling machine learning and crop modeling improves crop yield prediction in the US Corn Belt. https://app.cochat.ai/papers/10.1038/s41598-020-80820-1
- The paper
- Shahhosseini, M., Hu, G., Huber, I., & Archontoulis, S. V. (2021). Coupling machine learning and crop modeling improves crop yield prediction in the US Corn Belt. Scientific Reports. https://doi.org/10.1038/s41598-020-80820-1
Data sources
Bibliographic data: Semantic Scholar, OpenAlex, Crossref.
Contains information from the Semantic Scholar Academic Graph Datasets, made available under the ODC Attribution License (ODC-BY 1.0).
Semantic Scholar’s data is described in: Kinney, R., et al. (2023). The Semantic Scholar Open Data Platform. arXiv:2301.10140.
