

Single-cell transcriptome and cell type-specific molecular pathways of human non-alcoholic steatohepatitis
Open accessThe DOI matches its Crossref record; 40 of the 41 references it cites were found in a registry or an index.
Abstract
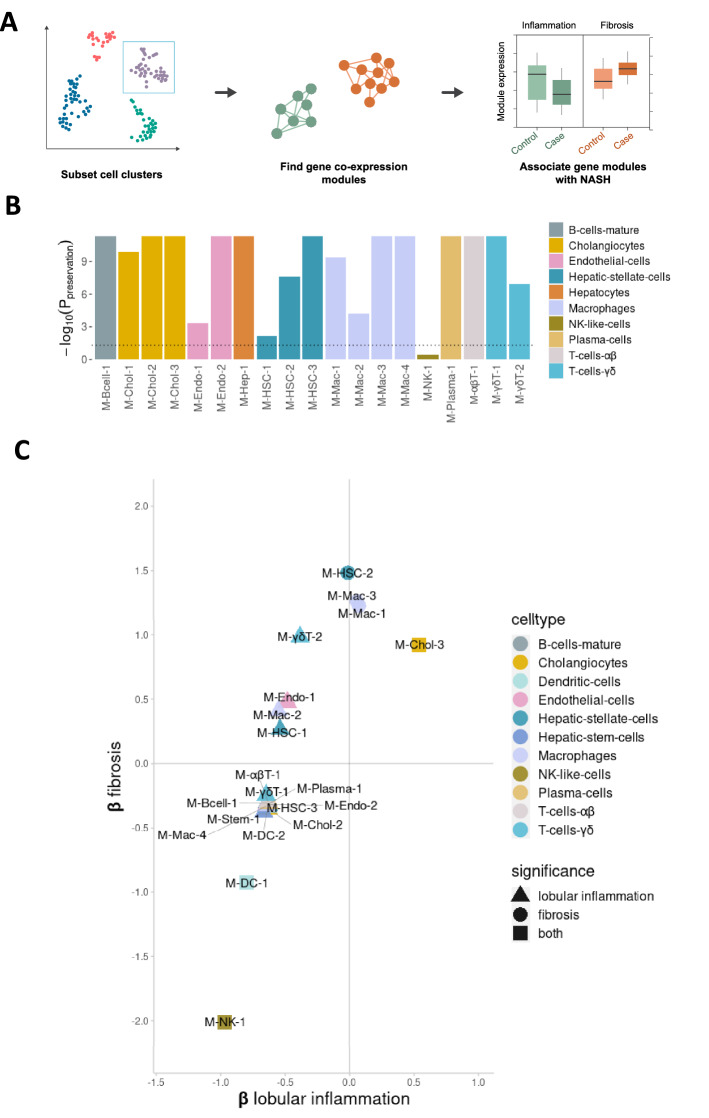
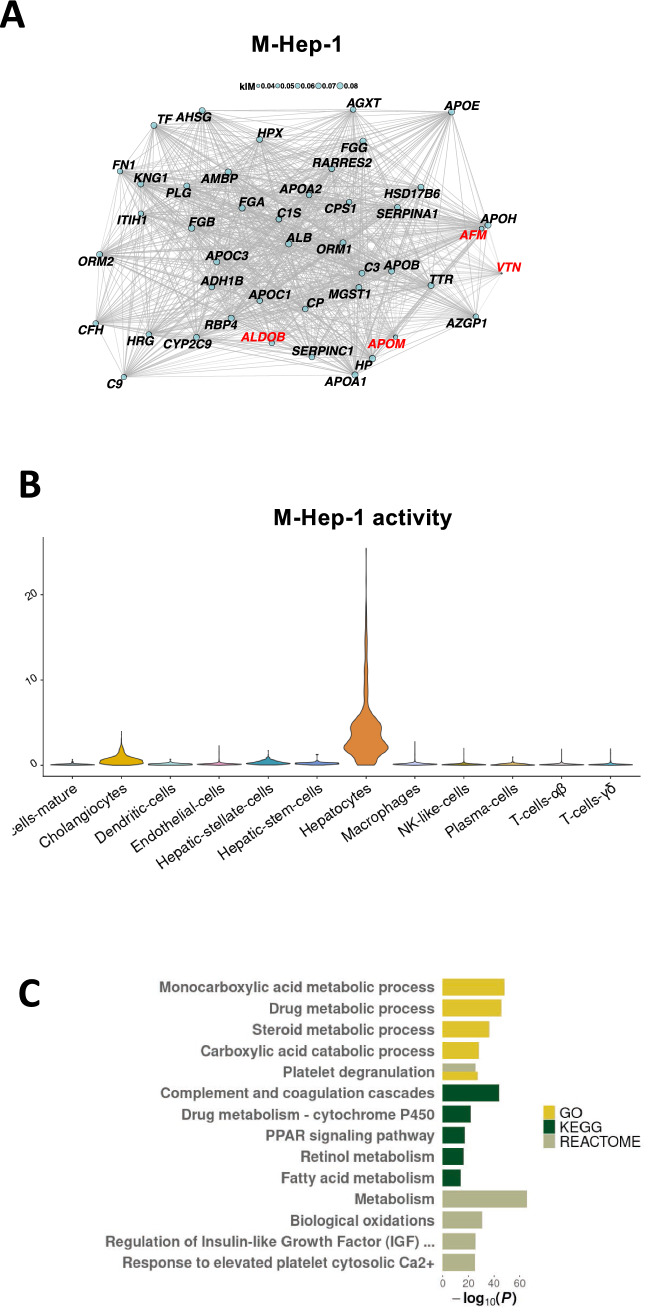
The aim of this study is to characterize cell type-specific transcriptional signatures in non-alcoholic steatohepatitis (NASH) to improve our understanding of the disease. We performed single-cell RNA sequencing on liver biopsies from 10 patients with NASH. We applied weighted gene co-expression network analysis and validated our findings using a publicly available RNA sequencing data set derived from 160 patients with non-alcoholic fatty liver disease (NAFLD) and 24 controls with normal liver histology. Our study provides a comprehensive single-cell analysis of NASH pathology in humans, describing 19,627 single-cell transcriptomes from biopsy-proven NASH patients. Our data suggest that the previous notion of ”NASH-associated macrophages” can be explained by an up-regulation of normally existing subpopulations of liver macrophages. Similarly, we describe two distinct populations of activated hepatic stellate cells, associated with the level of fibrosis. Finally, we find that the expression of several circulating markers of NAFLD are co-regulated in hepatocytes together with predicted effector genes from NAFLD genome-wide association studies (GWAS), coupled to abnormalities in the complement system. In sum, our single-cell transcriptomic data set provides insights into novel cell type-specific and general biological processes associated with inflammation and fibrosis, emphasizing the importance of studying cell type-specific biological processes in human NASH.
Overview
The claims and statistics of this paper haven’t been checked yet.
Free: it reads the open-access text and checks the first 5 claims that cite a source we can check. Create a free account to check every claim.
Integrity signals
Registry
Cites
Statistics
Figures



Verification
Claims the paper makes
The claims and statistics of this paper haven’t been checked yet.
Free: it reads the open-access text and checks the first 5 claims that cite a source we can check. Create a free account to check every claim.
Claims other papers make about this one
Each is checked against this paper’s own text: does it say what the citing paper says it does?
In the citing paper
“Although activated HSCs are the primary fibrogenic cells in MASH, these methods have identified an expanded list of fibrogenic drivers expressed by activated HSCs that could represent antifibrotic drug targets (42, 48, 49, 125).”
From Found in translation—Fibrosis in metabolic dysfunction–associated steatohepatitis (MASH) (2023) · cites this paper as [125]
Self-check
Percentages, sums and reported differences re-computed from the paper’s own numbers.
The self-check needs the paper’s full text.
Citations
Cites
KEGG: Kyoto Encyclopedia of Genes and Genomes
Kanehisa, M. (2000) · Nucleic Acids Research · doi:10.1093/nar/28.1.27 · Cited by 37,077
KEGG: Kyoto Encyclopedia of Genes and Genomes
Ogata, H., Goto, S., Sato, K., Fujibuchi, W., Bono, H., & Kanehisa, M. (1999) · Nucleic Acids Research · doi:10.1093/nar/27.1.29 · Cited by 31,232
The Reactome pathway Knowledgebase
Fabregat, A., Sidiropoulos, K., Garapati, P., Gillespie, M., Hausmann, K., Haw, R., Jassal, B., Jupe, S., Korninger, F., McKay, S., et al. (2016) · Nucleic Acids Research · doi:10.1093/nar/gkv1351 · Cited by 5,605
Global burden of NAFLD and NASH: trends, predictions, risk factors and prevention
Younossi, Z., Anstee, Q. M., Marietti, M., Hardy, T., Henry, L., Eslam, M., George, J., & Bugianesi, E. (2018) · Nature Reviews Gastroenterology & Hepatology · doi:10.1038/nrgastro.2017.109 · Cited by 5,249
Vernon, G., Baranova, A., & Younossi, Z. M. (2011) · Alimentary Pharmacology & Therapeutics · doi:10.1111/j.1365-2036.2011.04724.x · Cited by 3,074
Angulo, P., Kleiner, D. E., Dam-Larsen, S., Adams, L. A., Bjornsson, E. S., Charatcharoenwitthaya, P., Mills, P. R., Keach, J. C., Lafferty, H. D., Stahler, A., et al. (2015) · Gastroenterology · doi:10.1053/j.gastro.2015.04.043 · Cited by 2,987
Self-citationMechanisms of hepatic stellate cell activation
Tsuchida, T., & Friedman, S. L. (2017) · Nature Reviews Gastroenterology & Hepatology · doi:10.1038/nrgastro.2017.38 · Cited by 2,909
Vilar-Gomez, E., Martinez-Perez, Y., Calzadilla-Bertot, L., Torres-Gonzalez, A., Gra-Oramas, B., Gonzalez-Fabian, L., Friedman, S. L., Diago, M., & Romero-Gomez, M. (2015) · Gastroenterology · doi:10.1053/j.gastro.2015.04.005 · Cited by 2,492
The reactome pathway knowledgebase
Jassal, B., Matthews, L., Viteri, G., Gong, C., Lorente, P., Fabregat, A., Sidiropoulos, K., Cook, J., Gillespie, M., Haw, R., et al. (2019) · Nucleic Acids Research · doi:10.1093/nar/gkz1031 · Cited by 2,159
Resolving the fibrotic niche of human liver cirrhosis at single-cell level
Ramachandran, P., Dobie, R., Wilson-Kanamori, J. R., Dora, E. F., Henderson, B. E. P., Luu, N. T., Portman, J. R., Matchett, K. P., Brice, M., Marwick, J. A., et al. (2019) · Nature · doi:10.1038/s41586-019-1631-3 · Cited by 1,784
Research works printed but not linked: 1
- Vujkovic, M. et al. A genome-wide association study for nonalcoholic fatty liver disease 1 identifies novel genetic loci and trait-relevant candidate genes in the 2 Million Veteran Program. 3 Themistocles L 12 Assimes. 36, 49 (2021).
Cited by
Found in translation—Fibrosis in metabolic dysfunction–associated steatohepatitis (MASH)
Wang, S., & Friedman, S. L. (2023) · Science Translational Medicine · doi:10.1126/scitranslmed.adi0759 · Cited by 158
“Although activated HSCs are the primary fibrogenic cells in MASH, these methods have identified an expanded list of fibrogenic drivers expressed by activated HSCs that could represent antifibrotic drug targets (42, 48, 49, 124).”
BackgroundFriend or foe? The elusive role of hepatic stellate cells in liver cancer
Cogliati, B., Yashaswini, C. N., Wang, S., Sia, D., & Friedman, S. L. (2023) · Nature Reviews Gastroenterology & Hepatology · doi:10.1038/s41575-023-00821-z · Cited by 148
Acquisition of epithelial plasticity in human chronic liver disease
Gribben, C., Galanakis, V., Calderwood, A., Williams, E. C., Chazarra-Gil, R., Larraz, M., Frau, C., Puengel, T., Guillot, A., Rouhani, F. J., et al. (2024) · Nature · doi:10.1038/s41586-024-07465-2 · Cited by 142
“However, we quickly abandoned using cells isolated from fresh biopsy because many hepatocytes and chol-angiocytes were lost using this method, as shown by previous studies 38,39 .”
MethodRegulation of Hepatic Stellate Cell Phenotypes in Metabolic Dysfunction–Associated Steatohepatitis
Kisseleva, T., Ganguly, S., Murad, R., Wang, A., & Brenner, D. A. (2025) · Gastroenterology · doi:10.1053/j.gastro.2025.03.010 · Cited by 86
The spatial and temporal activation of macrophages during fibrosis
Behmoaras, J. V., Mulder, K., Ginhoux, F., & Petretto, E. G. (2025) · Nature reviews. Immunology · doi:10.1038/s41577-025-01186-x · Cited by 86
Metadata
- Authors
- Fred, R. G., Steen Pedersen, J., Thompson, J. J., Lee, J., Timshel, P. N., Stender, S., Opseth Rygg, M., Gluud, L. L., Bjerregaard Kristiansen, V., Bendtsen, F., Hansen, T., & Pers, T. H.
- Affiliations
- University of Copenhagen (DK)
- Frederiksberg Hospital (DK)
- Hvidovre Hospital (DK)
- Corresponding author
- Bendtsen, Flemming
- Hansen, Torben
- Pers, Tune H.
- ORCID
- Venue
- Scientific Reports
- Published
- 2022-08-05
- Volume
- 12
- Issue
- 1
- Pages
- 13484-13484
- ISSN
- 2045-2322 (ISSN-L)
- PMC
- PMC9355943
- OpenAlex
- W4289885671
- Cited by
- 44
- References
- 41
- Citations by year
- 2026: 11 · 2025: 14 · 2024: 8 · 2023: 11
- FWCI
- 6.32
- Type
- journal article
- Language
- en
- Open access
- gold
- doi.org
- Licence
- cc-by
- creativecommons.org/licenses/by/4.0 (tdm)
- creativecommons.org/licenses/by/4.0 (vor)
- Locations
- Scientific Reports (publishedVersion, cc-by)
- PubMed Central (publishedVersion, cc-by)
- PubMed (publishedVersion)
- Research at the University of Copenhagen (University of Copenhagen) (publishedVersion, cc-by)
- DOAJ (DOAJ: Directory of Open Access Journals) (submittedVersion, cc-by-sa)
- Funders
- Novo Nordisk Fonden (NNF18CC0034900)
- Lundbeckfonden (R19020143904)
- Topics
- Health Sciences › Medicine › Hepatology › Liver Disease Diagnosis and Treatment
- Health Sciences › Medicine › Hepatology › Liver physiology and pathology
- Life Sciences › Biochemistry, Genetics and Molecular Biology › Molecular Biology › Single-cell and spatial transcriptomics
- Keywords
- nonalcoholic steatohepatitis, non-alcoholic fatty liver disease, hepatic macrophages, hepatic stellate cells, liver fibrosis, complement system, inflammation, cell type-specific gene expression
- MeSH terms
- Fibrosis, Humans, Liver, Biomarkers, Genome-Wide Association Study, Transcriptome, Non-alcoholic Fatty Liver Disease
About these checks
Registry, retraction, Cites and statistics results are computed, not judged, with one exception: a printed reference that no index lists is read once by a model before it counts as a citation error. Claims are extracted by a model and kept only when their quote appears verbatim in the text; each cited source is then checked, with a model’s help, for whether it says what the claim relies on. Those verdicts can be wrong — read the claim’s quote and the cited source before relying on one.
Statistics and arithmetic are recomputed, not judged.
Confidence bands are shown only for fields calibrated on our annotated test set. None is calibrated yet, so no band is shown.
What counts as a claim ›How we measure confidence ›How we check this ›
Are you an author, or do you see a problem with this page? Request a review
How to cite
Cite CoChat for the checks on this page, and the paper for its own findings.
- This page
- CoChat. (2026). Citation check: Single-cell transcriptome and cell type-specific molecular pathways of human non-alcoholic steatohepatitis. https://app.cochat.ai/papers/10.1038/s41598-022-16754-7
- The paper
- Fred, R. G., Steen Pedersen, J., Thompson, J. J., Lee, J., Timshel, P. N., Stender, S., Opseth Rygg, M., Gluud, L. L., Bjerregaard Kristiansen, V., Bendtsen, F., Hansen, T., & Pers, T. H. (2022). Single-cell transcriptome and cell type-specific molecular pathways of human non-alcoholic steatohepatitis. Scientific Reports. https://doi.org/10.1038/s41598-022-16754-7
Data sources
Bibliographic data: Semantic Scholar, OpenAlex, Crossref.
Contains information from the Semantic Scholar Academic Graph Datasets, made available under the ODC Attribution License (ODC-BY 1.0).
Semantic Scholar’s data is described in: Kinney, R., et al. (2023). The Semantic Scholar Open Data Platform. arXiv:2301.10140.
