Cited by 12

The DOI matches its Crossref record; 4 of the 4 references it cites were found in a registry or an index.

Syntaxin-1a and SNAP-25 expression level is increased in the blood samples of ischemic stroke patients

Cappelletti, Pamela, Filareti, Melania, Masuelli, Laura, Bei, Roberto, Hassanzadeh, Kambiz, Corbo, Massimo, Feligioni, Marco·2022·Scientific Reports

Abstract

The interest for the discovery of blood biomarkers for several neurological disorders, including Ischemic Stroke (IS), is growing and their identification in blood samples would be revolutionary allowing a fast and better pathology prediction or outcome and to collect information on patient recovery. The increased permeability of the blood–brain barrier, following a brain infarct, allows the detection of brain proteins in the blood flow. In this work, we analyzed the expression levels of two synaptic proteins Syntaxin (STX)-1a and Synaptosomal Associated Protein, 25 kDa (SNAP-25), in Peripheral Blood Mononuclear Cell (PBMC), serum and in Neuronal Derived Extracellular vesicles (NDEs) of IS patients, age and sex matched healthy control (HC) and younger HC (Y-HC). Interestingly, we identified STX-1a protein in the cytoplasm of PBMC and both STX-1a and SNAP-25 expression levels were significantly augmented in all IS patient’s blood fractions compared to control subjects. In addition, STX-1a blood levels correlated with the IS clinical scales National Institutes of Health Stroke Scale (NIH-SS) and the modified Barthel Index (BI). These results prompted us to speculate that STX-1a and SNAP-25 hematic fluctuations depict the brain damage after an ischemic attack and that their hematic detection could represent a novel and accessible IS biomarkers.

Overview

The claims and statistics of this paper haven’t been checked yet.

Run the check — free, no account needed. It reads the open-access text and checks the sources it cites.

A few free checks a day · papers already verified open instantly · results are public

Integrity signals

Registry

Crossref · 10.1038/s41598-022-18719-2

Cites

4 of 4 references verified0 citation errors · 0 not checkable

Statistics

Figures

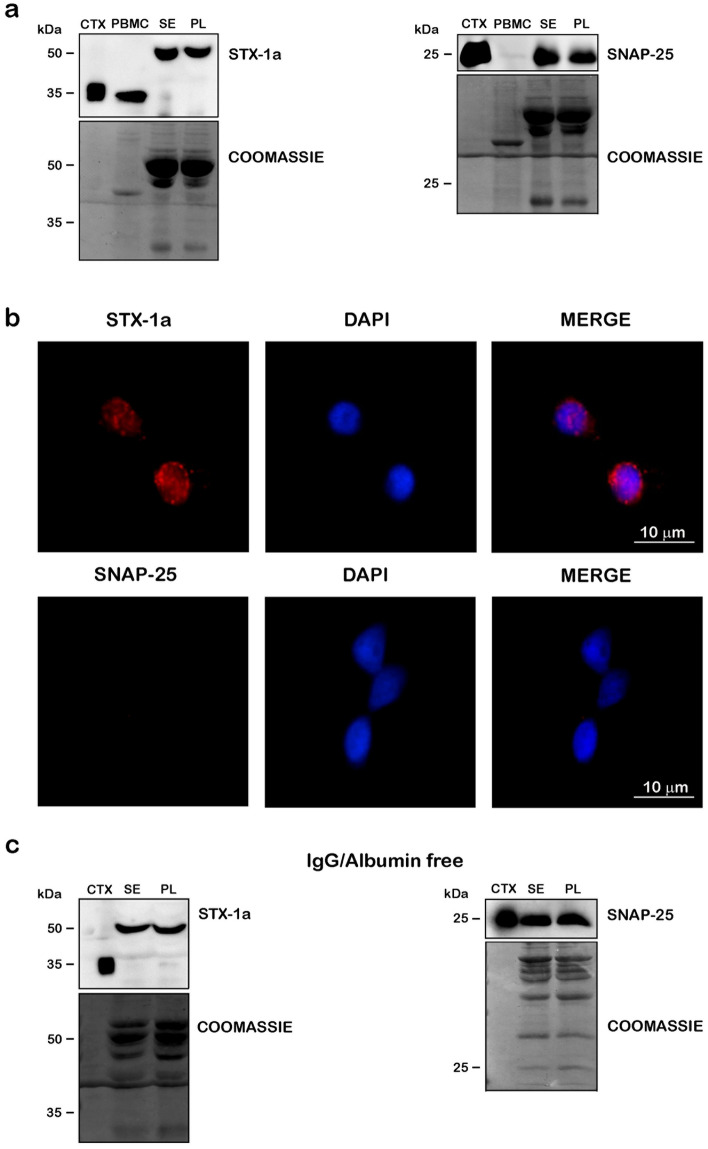
Figure 1 Detection of STX-1a and SNAP-25 in peripheral blood of healthy donors. (a) WB analysis of the SNARE proteins in blood components. PBMCs, serum (SE), plasma (PL) and mouse brain cortex lysate (CTX, loaded as positive control) have been immunostained with STX-1a and SNAP-25 antibodies. STX-1a was detected in all blood components, but only in PBMCs at the predicted M.W., while SNAP-25 was observed in serum and plasma but not in blood cells. (b) Immunofluorescence analysis of STX-1a and SNAP-25 in PBMCs. Fluorescence analysis of PBMCs confirms the presence of STX-1a but not that of SNAP-25 (red channels). Nuclei have been labeled with the marker DAPI (blue channels). Original magnification: 60×. Bars correspond to 10 µm. (c) WB analysis of STX-1a and SNAP-25 in serum and plasma depleted from IgG and albumin. After the stripping of IgG and albumin from serum and plasma (as shown by Coomassie Blue staining) both STX-1a (at the shifted M.W) and SNAP-25 immune-recognition signals persist. For WB analysis 100 µg of blood components, 0.5 µg of mouse brain cortex lysate and 10 µL of flow through have been loaded in each lane. Uncropped WB and coomassie staining in (a) and (c) have been reported in Fig. S4 online.
Figure 1 Detection of STX-1a and SNAP-25 in peripheral blood of healthy donors. (a) WB analysis of the SNARE proteins in blood components. PBMCs, serum (SE), plasma (PL) and mouse brain cortex lysate (CTX, loaded as positive control) have been immunostained with STX-1a and SNAP-25 antibodies. STX-1a was detected in all blood components, but only in PBMCs at the predicted M.W., while SNAP-25 was observed in serum and plasma but not in blood cells. (b) Immunofluorescence analysis of STX-1a and SNAP-25 in PBMCs. Fluorescence analysis of PBMCs confirms the presence of STX-1a but not that of SNAP-25 (red channels). Nuclei have been labeled with the marker DAPI (blue channels). Original magnification: 60×. Bars correspond to 10 µm. (c) WB analysis of STX-1a and SNAP-25 in serum and plasma depleted from IgG and albumin. After the stripping of IgG and albumin from serum and plasma (as shown by Coomassie Blue staining) both STX-1a (at the shifted M.W) and SNAP-25 immune-recognition signals persist. For WB analysis 100 µg of blood components, 0.5 µg of mouse brain cortex lysate and 10 µL of flow through have been loaded in each lane. Uncropped WB and coomassie staining in (a) and (c) have been reported in Fig. S4 online.CC BY · PubMed Central
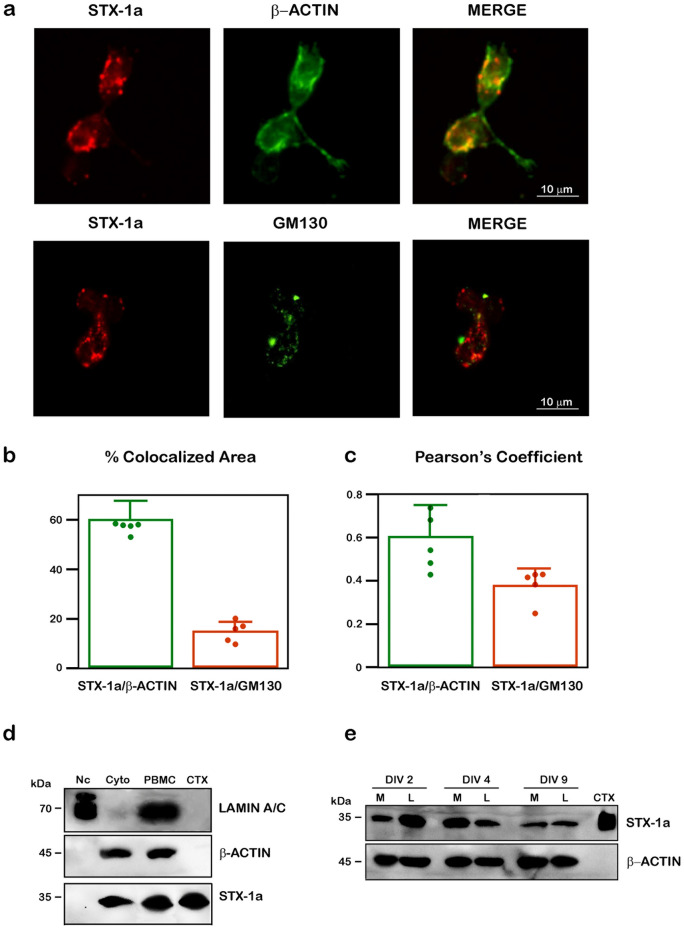
Figure 2 Analysis of the subcellular and cellular localization of STX-1a in PBMCs of healthy donors. (a) IF analysis of the cellular distribution of STX-1a in PBMCs. PBMCs have been immunostained with the cytoplasmic marker β-actin (upper panel) or the Golgi apparatus marker GM130 (lower panel) (green channels) and STX-1a (red channels). In the merge images, a clear colocalization of STX-1a with β-actin is evident thus indicating a cytoplasmic localization of the SNARE protein in PBMCs. A partial colocalization of STX-1a and GM130 is also shown. Original magnification: 60×. Bars correspond to 10 µm. (b) Colocalization analysis. Histogram showing the percentage of colocalized area compared to the total fluorescent area. (c) Pearson’s Coefficient. Histogram showing Pearson’s Coefficient. Green points and histograms represents the % of colocalization area (b) and the Pearson’s Coefficient (c) of STX-1a compared to β-actin, orange points and histograms represents the % of colocalization area (b) and the Pearson’s Coefficient (c) of STX-1a compared to GM130. (d) PBMC’s subcellular fractions analysis. WB analysis confirmed the cytoplasmic localization of STX-1a in PBMCs. The successful separation of the nuclear (Nc) and the cytoplasmic fractions (Cyto) of PBMCs is demonstrated by the presence of the nuclear marker lamin A/C only in the nuclear fraction and that of β-actin only in the cytoplasmic one. (e) STX-1a is expressed in both major PBMCs subtypes in cultures. WB analysis reveals that STX-1a is expressed in both monocytes (M) and lymphocytes (L) and that its expression is maintained over time in cultured cells. For IF analysis at least 15 cells for each subject (n = 5) have been analyzed. For WB analysis 4 µL of PBMCs subcellular fractions (i.e. Nc and Cyto), 100 µg of whole PBMCs, 0.5 µg of mouse brain cortex lysate and 2 × 10⁵ of cultured PBMCs have been loaded in each lane. Bars represent the median value ± SD. Uncropped WB in (d) and (e) have been reported in Fig. S5 online.
Figure 2 Analysis of the subcellular and cellular localization of STX-1a in PBMCs of healthy donors. (a) IF analysis of the cellular distribution of STX-1a in PBMCs. PBMCs have been immunostained with the cytoplasmic marker β-actin (upper panel) or the Golgi apparatus marker GM130 (lower panel) (green channels) and STX-1a (red channels). In the merge images, a clear colocalization of STX-1a with β-actin is evident thus indicating a cytoplasmic localization of the SNARE protein in PBMCs. A partial colocalization of STX-1a and GM130 is also shown. Original magnification: 60×. Bars correspond to 10 µm. (b) Colocalization analysis. Histogram showing the percentage of colocalized area compared to the total fluorescent area. (c) Pearson’s Coefficient. Histogram showing Pearson’s Coefficient. Green points and histograms represents the % of colocalization area (b) and the Pearson’s Coefficient (c) of STX-1a compared to β-actin, orange points and histograms represents the % of colocalization area (b) and the Pearson’s Coefficient (c) of STX-1a compared to GM130. (d) PBMC’s subcellular fractions analysis. WB analysis confirmed the cytoplasmic localization of STX-1a in PBMCs. The successful separation of the nuclear (Nc) and the cytoplasmic fractions (Cyto) of PBMCs is demonstrated by the presence of the nuclear marker lamin A/C only in the nuclear fraction and that of β-actin only in the cytoplasmic one. (e) STX-1a is expressed in both major PBMCs subtypes in cultures. WB analysis reveals that STX-1a is expressed in both monocytes (M) and lymphocytes (L) and that its expression is maintained over time in cultured cells. For IF analysis at least 15 cells for each subject (n = 5) have been analyzed. For WB analysis 4 µL of PBMCs subcellular fractions (i.e. Nc and Cyto), 100 µg of whole PBMCs, 0.5 µg of mouse brain cortex lysate and 2 × 10⁵ of cultured PBMCs have been loaded in each lane. Bars represent the median value ± SD. Uncropped WB in (d) and (e) have been reported in Fig. S5 online.CC BY · PubMed Central
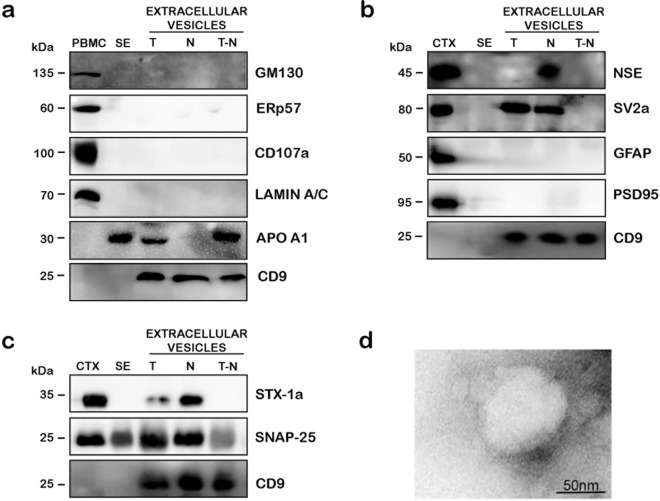
Figure 3 WB analysis of a representative NDE purification from the serum of healthy donors. (a) Quality analysis of extracellular vesicle preparation. Extracellular vesicles samples are not contaminated by Golgi apparatus (GM130), endoplasmic reticulum (Erp57), lysosomes (CD107) and nucleus (lamin A/C). The presence of the HDL marker APO A1 is detectable in both total extracellular vesicles (T) and total extracellular vesicles depleted to NDE (T-N), but disappear in NDEs fractions (N). CD9 is a common exosome marker. (b) NDE characterization. WB analysis show an enrichment of neuronal markers (NSE and SV-2a) in NDEs with respect to the other two extracellular vesicles fractions. Moreover, NDE samples are negative to the astrocytes and the post synaptic markers GFAP and PSD95, respectively. (c) STX-1a and SNAP-25 are enriched in NDE fractions. The levels of both SNARE proteins are increased in NDE with respect to the two other extracellular vesicles fractions. (d) Representative EM analysis of NDE. The ultrastructural analysis of NDE shows the presence of rounded-shaped vesicles with a diameter range of 70–100 nm. Bars correspond to 50 nm. For WB analysis 100 µg of whole PBMCs, 50 µg of serum (SE), extracellular vesicles fractions (T, N, T-N) and 0.5 µg of mouse brain cortex lysate have been loaded in each lane. Uncropped WB in (a)–(c) have been reported in Fig. S6 online.
Figure 3 WB analysis of a representative NDE purification from the serum of healthy donors. (a) Quality analysis of extracellular vesicle preparation. Extracellular vesicles samples are not contaminated by Golgi apparatus (GM130), endoplasmic reticulum (Erp57), lysosomes (CD107) and nucleus (lamin A/C). The presence of the HDL marker APO A1 is detectable in both total extracellular vesicles (T) and total extracellular vesicles depleted to NDE (T-N), but disappear in NDEs fractions (N). CD9 is a common exosome marker. (b) NDE characterization. WB analysis show an enrichment of neuronal markers (NSE and SV-2a) in NDEs with respect to the other two extracellular vesicles fractions. Moreover, NDE samples are negative to the astrocytes and the post synaptic markers GFAP and PSD95, respectively. (c) STX-1a and SNAP-25 are enriched in NDE fractions. The levels of both SNARE proteins are increased in NDE with respect to the two other extracellular vesicles fractions. (d) Representative EM analysis of NDE. The ultrastructural analysis of NDE shows the presence of rounded-shaped vesicles with a diameter range of 70–100 nm. Bars correspond to 50 nm. For WB analysis 100 µg of whole PBMCs, 50 µg of serum (SE), extracellular vesicles fractions (T, N, T-N) and 0.5 µg of mouse brain cortex lysate have been loaded in each lane. Uncropped WB in (a)–(c) have been reported in Fig. S6 online.CC BY · PubMed Central
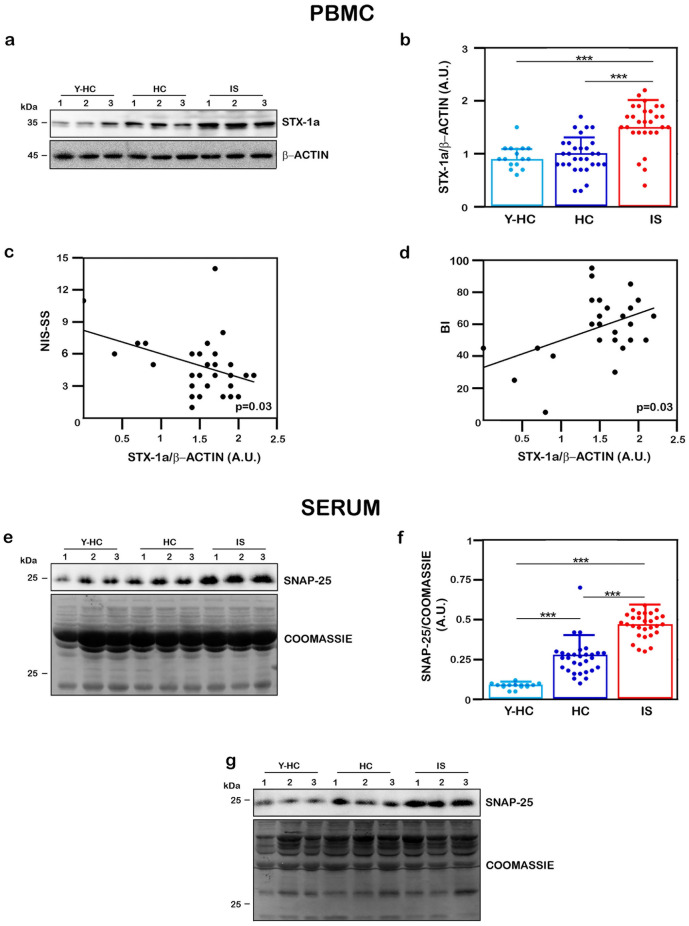
Figure 4 Quantitative analysis of STX-1a in PBMCs and of SNAP-25 in sera in all population analyzed. (a, e) Representative WB analysis of STX-1a in PBMCs (a) and of SNAP-25 in serum (e) in IS and HC subjects. PBMCs are immunostained for STX-1a (a) and serum for SNAP-25 (e). For each sample, the STX-1a densitometric value is normalized to that of β-actin, while the SNAP-25 densitometric values is normalized to that of total blood proteins content revealed by Coomassie Blue staining. (b) Densitometric analysis STX-1a expression levels in PBMCs. STX-1a expression levels have been analyzed by using One-way ANOVA with post-hoc Tukey test: STX-1a significantly increase in PBMCs of IS patients with respect to HC and Y-HC subjects (p ≤ 0.0001), while no differences are observed between control groups (p = 0.97). (c, d) Pearson’s correlation analysis between expression of STX-1a in IS PBMC and the clinical stroke scales. STX-1a levels in PBMCs of IS patients present a moderate negative correlation with NIH-SS (p = 0.03) (c) and a moderate positive correlation with BI (d) (p = 0.03). (f) Densitometric analysis SNAP-25 expression levels in sera. SNAP-25 expression levels have been analyzed by using One-way ANOVA with post-hoc Tukey test: SNAP-25 levels are significantly increased in serum of IS patients with respect to HC and Y-HC subjects (p ≤ 0.0001). A significant increase of SNAP-25 expression is also observed in HC with respect to Y-HC subjects (p ≤ 0.0001). (g) WB analysis of SNAP-25 in sera depleted of IgG and albumin. The increased SNAP-25 levels in IS patient are not influenced by the presence of serum proteins. For WB analysis 100 µg of whole PBMCs and of serum (SE) have been loaded in each lane. In quantitative graphs (panels b and f) each point in a frame depicts the value for a single subject (n = 30 IS patients, 30 HC subjects and 15 young HC subjects) while bars represent the median value ± SD. ***p ≤ 0.001. In panels (b) and (f) light blue points and histograms correspond to Y-HC subjects, blue points and histograms correspond to HC subjects, red points and histograms correspond to IS patients. Uncropped WB and coomassie staining in (a), (e) and (g) have been reported in Fig. S7 online.
Figure 4 Quantitative analysis of STX-1a in PBMCs and of SNAP-25 in sera in all population analyzed. (a, e) Representative WB analysis of STX-1a in PBMCs (a) and of SNAP-25 in serum (e) in IS and HC subjects. PBMCs are immunostained for STX-1a (a) and serum for SNAP-25 (e). For each sample, the STX-1a densitometric value is normalized to that of β-actin, while the SNAP-25 densitometric values is normalized to that of total blood proteins content revealed by Coomassie Blue staining. (b) Densitometric analysis STX-1a expression levels in PBMCs. STX-1a expression levels have been analyzed by using One-way ANOVA with post-hoc Tukey test: STX-1a significantly increase in PBMCs of IS patients with respect to HC and Y-HC subjects (p ≤ 0.0001), while no differences are observed between control groups (p = 0.97). (c, d) Pearson’s correlation analysis between expression of STX-1a in IS PBMC and the clinical stroke scales. STX-1a levels in PBMCs of IS patients present a moderate negative correlation with NIH-SS (p = 0.03) (c) and a moderate positive correlation with BI (d) (p = 0.03). (f) Densitometric analysis SNAP-25 expression levels in sera. SNAP-25 expression levels have been analyzed by using One-way ANOVA with post-hoc Tukey test: SNAP-25 levels are significantly increased in serum of IS patients with respect to HC and Y-HC subjects (p ≤ 0.0001). A significant increase of SNAP-25 expression is also observed in HC with respect to Y-HC subjects (p ≤ 0.0001). (g) WB analysis of SNAP-25 in sera depleted of IgG and albumin. The increased SNAP-25 levels in IS patient are not influenced by the presence of serum proteins. For WB analysis 100 µg of whole PBMCs and of serum (SE) have been loaded in each lane. In quantitative graphs (panels b and f) each point in a frame depicts the value for a single subject (n = 30 IS patients, 30 HC subjects and 15 young HC subjects) while bars represent the median value ± SD. ***p ≤ 0.001. In panels (b) and (f) light blue points and histograms correspond to Y-HC subjects, blue points and histograms correspond to HC subjects, red points and histograms correspond to IS patients. Uncropped WB and coomassie staining in (a), (e) and (g) have been reported in Fig. S7 online.CC BY · PubMed Central
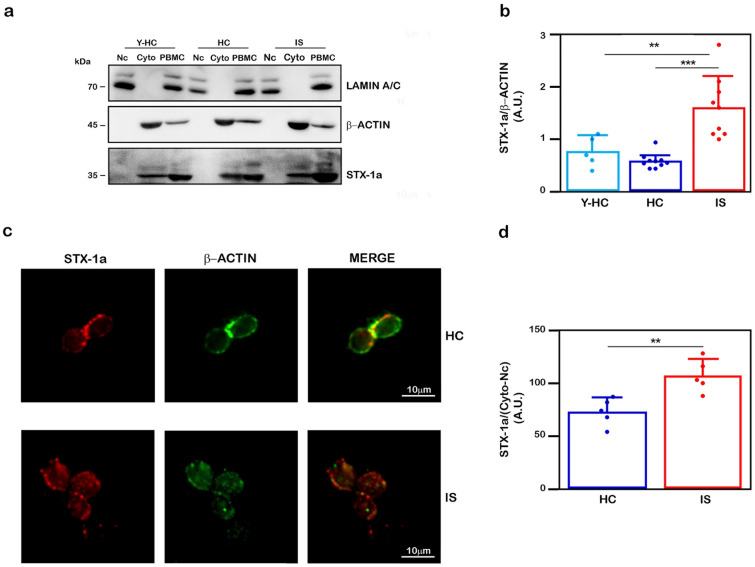
Figure 5 Confirmation of increased STX-1a levels in PBMCs of IS patients with respect to HC subjects. (a) Representative WB of STX-1a expression levels in PBMC cytoplasmic fractions. Representative WB analysis of cytoplasmic and nuclear fractions of PBMCs. For each sample, the STX-1a densitometric values have been normalized to that of β-actin. The successful separation of the nuclear (Nc) and the cytoplasmic fractions (Cyto) of PBMCs is demonstrated by the presence of the nuclear marker lamin A/C in the nuclear fraction and that of β-actin in the cytoplasmic one. (b) Quantitative analysis of cytoplasmic STX-1a. STX-1a expression levels have been analyzed by using One-way ANOVA with post-hoc Tukey test: STX-1a significantly increase in PBMCs of IS patients with respect to HC (p ≤ 0.0001) and Y-HC (p ≤ 0.003) subjects, while no difference is observed between the two control groups (p = 0.7). (c) Representative Immunofluorescence analysis of STX-1a in PBMCs of IS patients and HC subjects. PBMCs have been labeled with β-actin (green) and STX-1a (red). The STX-1a fluorescence intensity has been normalized by dividing the measure of its intensity by that of the β-actin subtracted from that measured for the nucleus (DAPI immunostaining). (d) Quantitative analysis STX-1a levels in PBMCs. The normalized STX-1a expression levels have been analyzed by using One-way ANOVA with post-hoc Tukey test: STX-1a levels are significantly increased in PBMCs of IS patients with respect to HC subjects (p = 0.005). Original magnification: 60X. Bars correspond to 10 µm. For WB analysis 4 µL of each fraction (Nc and Cyto) and 100 µg of whole PBMCs have been loaded in each lane. For IF analysis at least 15 cells for each subject have been analyzed. In quantitative graphs (panels b and d) each point in a frame depicts the value for a single subject (n = 5–10 IS patients, 5–10 HC subjects and 0–5 young HC subjects, respectively in (b) and (d) while bars represent the median value ± SD. **p ≤ 0.005; ***p ≤ 0.001. Uncropped WB in a) have been reported in Fig. S8 online.
Figure 5 Confirmation of increased STX-1a levels in PBMCs of IS patients with respect to HC subjects. (a) Representative WB of STX-1a expression levels in PBMC cytoplasmic fractions. Representative WB analysis of cytoplasmic and nuclear fractions of PBMCs. For each sample, the STX-1a densitometric values have been normalized to that of β-actin. The successful separation of the nuclear (Nc) and the cytoplasmic fractions (Cyto) of PBMCs is demonstrated by the presence of the nuclear marker lamin A/C in the nuclear fraction and that of β-actin in the cytoplasmic one. (b) Quantitative analysis of cytoplasmic STX-1a. STX-1a expression levels have been analyzed by using One-way ANOVA with post-hoc Tukey test: STX-1a significantly increase in PBMCs of IS patients with respect to HC (p ≤ 0.0001) and Y-HC (p ≤ 0.003) subjects, while no difference is observed between the two control groups (p = 0.7). (c) Representative Immunofluorescence analysis of STX-1a in PBMCs of IS patients and HC subjects. PBMCs have been labeled with β-actin (green) and STX-1a (red). The STX-1a fluorescence intensity has been normalized by dividing the measure of its intensity by that of the β-actin subtracted from that measured for the nucleus (DAPI immunostaining). (d) Quantitative analysis STX-1a levels in PBMCs. The normalized STX-1a expression levels have been analyzed by using One-way ANOVA with post-hoc Tukey test: STX-1a levels are significantly increased in PBMCs of IS patients with respect to HC subjects (p = 0.005). Original magnification: 60X. Bars correspond to 10 µm. For WB analysis 4 µL of each fraction (Nc and Cyto) and 100 µg of whole PBMCs have been loaded in each lane. For IF analysis at least 15 cells for each subject have been analyzed. In quantitative graphs (panels b and d) each point in a frame depicts the value for a single subject (n = 5–10 IS patients, 5–10 HC subjects and 0–5 young HC subjects, respectively in (b) and (d) while bars represent the median value ± SD. **p ≤ 0.005; ***p ≤ 0.001. Uncropped WB in a) have been reported in Fig. S8 online.CC BY · PubMed Central
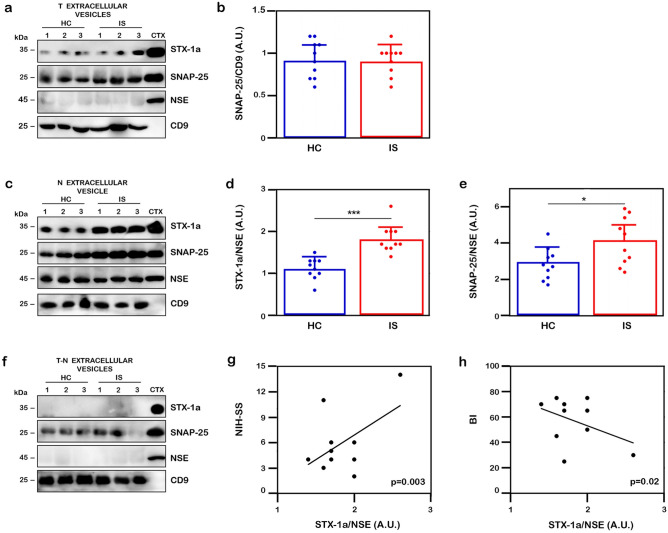
Figure 6 Analysis of SNARE in extracellular vesicles of IS and HC subjects. (a, c, f) Representative WB analysis of the expression levels of STX-1a and of SNAP-25 in extracellular vesicles derived from sera. Representative WB analysis of total (T) extracellular vesicles (a), NDE (N) (c) and total extracellular vesicles depleted of NDE (T-N) (f) fractions. Each sample has been tested against CD9 (total exosomes marker), NSE (NDE marker), STX-1a and SNAP-25. The SNAP-25 densitometric values in total extracellular vesicles fraction have been normalized to that of CD9 (a), while the STX-1a and SNAP-25 densitometric values in NDE have been normalized to that of NSE (c). (b, d, e) Densitometric analysis of STX-1a and SNAP-25 in extracellular vesicles The normalized SNAP-25 levels in T extracellular vesicles (b) and those of both STX-1a (d) and SNAP-25 (e) in NDE have been analyzed by using One-way ANOVA with post-hoc Tukey test. Both STX-1a and SNAP-25 expression levels are significantly increased in NDE of IS patients with respect to HC subjects (p ≤ 0.0001 and p ≤ 0.02 for STX-1a (d) and SNAP-25 (e) respectively), while no differences is observed for SNAP-25 in the T fraction (p = 0.91) (b). (g, h) Pearson’s correlation analysis between expression of STX-1a in IS NDEs and the clinical stroke. STX-1a levels in NDE of IS patients present a moderate positive correlation with NIH-SS (p = 0.003) (g) and a moderate negative correlation with BI (p = 0.02) (h). For WB analysis 50 µg of each extracellular vesicles fraction and 0.5 µg of mouse brain cortex lysate have been loaded in each lane. In quantitative graphs (panels b, d and e) each point in a frame depicts the value for a single subject (n = 10 IS patients and 10 HC subjects) while bars represent the median value ± SD. *p ≤ 0.05; ***p ≤ 0.001. In panels (b), (d) and (e) blue points and histograms correspond to HC subjects, red points and histograms correspond to IS patients. Uncropped WB in (a), (c) and (f) have been reported in Fig. S9 online.
Figure 6 Analysis of SNARE in extracellular vesicles of IS and HC subjects. (a, c, f) Representative WB analysis of the expression levels of STX-1a and of SNAP-25 in extracellular vesicles derived from sera. Representative WB analysis of total (T) extracellular vesicles (a), NDE (N) (c) and total extracellular vesicles depleted of NDE (T-N) (f) fractions. Each sample has been tested against CD9 (total exosomes marker), NSE (NDE marker), STX-1a and SNAP-25. The SNAP-25 densitometric values in total extracellular vesicles fraction have been normalized to that of CD9 (a), while the STX-1a and SNAP-25 densitometric values in NDE have been normalized to that of NSE (c). (b, d, e) Densitometric analysis of STX-1a and SNAP-25 in extracellular vesicles The normalized SNAP-25 levels in T extracellular vesicles (b) and those of both STX-1a (d) and SNAP-25 (e) in NDE have been analyzed by using One-way ANOVA with post-hoc Tukey test. Both STX-1a and SNAP-25 expression levels are significantly increased in NDE of IS patients with respect to HC subjects (p ≤ 0.0001 and p ≤ 0.02 for STX-1a (d) and SNAP-25 (e) respectively), while no differences is observed for SNAP-25 in the T fraction (p = 0.91) (b). (g, h) Pearson’s correlation analysis between expression of STX-1a in IS NDEs and the clinical stroke. STX-1a levels in NDE of IS patients present a moderate positive correlation with NIH-SS (p = 0.003) (g) and a moderate negative correlation with BI (p = 0.02) (h). For WB analysis 50 µg of each extracellular vesicles fraction and 0.5 µg of mouse brain cortex lysate have been loaded in each lane. In quantitative graphs (panels b, d and e) each point in a frame depicts the value for a single subject (n = 10 IS patients and 10 HC subjects) while bars represent the median value ± SD. *p ≤ 0.05; ***p ≤ 0.001. In panels (b), (d) and (e) blue points and histograms correspond to HC subjects, red points and histograms correspond to IS patients. Uncropped WB in (a), (c) and (f) have been reported in Fig. S9 online.CC BY · PubMed Central

Verification

Claims the paper makes

The claims and statistics of this paper haven’t been checked yet.

Run the check — free, no account needed. It reads the open-access text and checks the sources it cites.

A few free checks a day · papers already verified open instantly · results are public

Claims other papers make about this one

Each is checked against this paper’s own text: does it say what the citing paper says it does?

Self-check

Percentages, sums and reported differences re-computed from the paper’s own numbers.

The self-check needs the paper’s full text.

Citations

Cites

Research works printed but not linked: 60

  1. Deb, P., Sharma, S. & Hassan, K. M. Pathophysiologic mechanisms of acute ischemic stroke: an overview with emphasis on therapeutic significance beyond thrombolysis. Pathophysiology 17(3), 197–218. https://doi.org/10.1016/j.pathophys.2009.12.001 (2010). · DOI
  2. Bakhai, A. The burden of coronary, cerebrovascular and peripheral arterial disease. Pharmacoeconomics 22(Suppl 4), 11–18. https://doi.org/10.2165/00019053-200422004-00004 (2004). · DOI
  3. Romain, G. et al. Long-term relative survival after stroke: The dijon stroke registry. Neuroepidemiology 54(6), 498–505. https://doi.org/10.1159/000505160 (2019). · DOI
  4. Katzan, I. L. et al. Utilization of intravenous tissue plasminogen activator for acute ischemic stroke. Arch Neurol. 61(3), 346–350. https://doi.org/10.1001/archneur.61.3.346 (2004). · DOI
  5. Wang, D. Z., Rose, J. A., Honings, D. S., Garwacki, D. J. & Milbrandt, J. C. Treating acute stroke patients with intravenous tPA the OSF stroke network experience. Stroke 31(1), 77–81. https://doi.org/10.1161/01.str.31.1.77 (2000). · DOI
  6. Lin, Y., Li, Z., Liu, C. & Wang, Y. Towards precision medicine in ischemic stroke and transient ischemic attack. Front. Biosci. 23(7), 1338–1359. https://doi.org/10.2741/4647 (2018). · DOI
  7. Astrup, J., Siesjo, B. K. & Symon, L. Thresholds in cerebral ischemia—the ischemic penumbra. Stroke 12(6), 723–725. https://doi.org/10.1161/01.str.12.6.723 (1981). · DOI · Paper page
  8. Sims, N. R. & Muyderman, H. Mitochondria, oxidative metabolism and cell death in stroke. Biochim. Biophys. Acta. 1802(1), 80–91. https://doi.org/10.1016/j.bbadis.2009.09.003 (2010). · DOI
  9. Belov-Kirdajova, D., Kriska, J., Tureckova, J. & Anderova, M. Ischemia-triggered glutamate excitotoxicity from the perspective of glial cells. Front. Cell Neurosci. 14, 1–27. https://doi.org/10.3389/fncel.2020.00051 (2020). · DOI
  10. Kustanovich, V. et al. Biased paternal transmission of SNAP-25 risk alleles in attention-deficit hyperactivity disorder. Mol. Psychiatry. 8(3), 309–315. https://doi.org/10.1038/sj.mp.4001247 (2003). · DOI
  11. Nakamura, K. et al. Genetic and expression analyses reveal elevated expression of syntaxin 1A (STX1A) in high functioning autism. Int. J. Neuropsychopharmacol. 11(8), 1073–1084. https://doi.org/10.1017/S1461145708009036 (2008). · DOI
  12. Etain, B. et al. A SNAP25 promoter variant is associated with early-onset bipolar disorder and a high expression level in brain. Mol. Psychiatry 15(7), 748–755. https://doi.org/10.1038/mp.2008.148 (2010). · DOI
  13. Wang, C. et al. Inhibition of calpains protects Mn-induced neurotransmitter release disorders in synaptosomes from mice: involvement of SNARE complex and synaptic vesicle fusion. Sci. Rep. 7(1), 1–11. https://doi.org/10.1038/s41598-017-04017-9 (2017). · DOI
  14. Acuna, C. et al. Microsecond dissection of neurotransmitter release: SNARE-complex assembly dictates speed and Ca2+ sensitivity. Neuron 82(5), 1088–1100. https://doi.org/10.1016/j.neuron.2014.04.020 (2014). · DOI
  15. Cao, F., Hata, R., Zhu, P., Niinobe, M. & Sakanaka, M. Up-regulation of syntaxin1 in ischemic cortex after permanent focal ischemia in rats. Brain Res. 1272, 52–61. https://doi.org/10.1016/j.brainres.2009.03.047 (2009). · DOI
  16. Martí, E., Ferrer, I., Ballabriga, J. & Blasi, J. Increase in SNAP-25 immunoreactivity in the messy fibers following transient forebrain ischemia in the gerbil. Acta Neuropathol. 95(3), 254–260. https://doi.org/10.1007/s004010050795 (1998). · DOI
  17. Chen, H. Y. et al. Melatonin improves presynaptic protein, SNAP-25, expression and dendritic spine density and enhances functional and electrophysiological recovery following transient focal cerebral ischemia in rats. J. Pineal Res. 47(3), 260–270. https://doi.org/10.1111/j.1600-079X.2009.00709.x (2009). · DOI
  18. Maestrini, I. et al. Blood biomarkers in the early stage of cerebral ischemia. Rev. Neurol. (Paris) 172(3), 198–219. https://doi.org/10.1016/j.neurol.2016.02.003 (2016). · DOI
  19. Choi, J. I. L., Ha, S. K., Lim, D. J., Kim, S. D. & Kim, S. H. S100ß, matrix metalloproteinase-9, D-dimer, and heat shock protein 70 are serologic biomarkers of acute cerebral infarction in a mouse model of transient MCA occlusion. J. Korean Neurosurg. Soc. 61(5), 548–558. https://doi.org/10.3340/jkns.2017.0200 (2018). · DOI
  20. Kvartsberg, H. et al. Characterization of the postsynaptic protein neurogranin in paired cerebrospinal fluid and plasma samples from Alzheimer’s disease patients and healthy controls. Alzheimers Res. Ther. 7(1), 40. https://doi.org/10.1186/s13195-015-0124-3 (2015). · DOI
  21. Matsumoto, A. et al. Role of phosphatidylserine-derived negative surface charges in the recognition and uptake of intravenously injected B16BL6-derived exosomes by macrophages. J. Pharm. Sci. 106(1), 168–175. https://doi.org/10.1016/j.xphs.2016.07.022 (2017). · DOI
  22. Lai, C. P. K. & Breakefield, X. O. Role of exosomes/microvesicles in the nervous system and use in emerging therapies. Front. Physiol. 3, 1–14. https://doi.org/10.3389/fphys.2012.00228 (2012). · DOI
  23. Colombo, M., Raposo, G. & Théry, C. Biogenesis, secretion, and intercellular interactions of exosomes and other extracellular vesicles. Annu. Rev. Cell Dev. Biol. 30(1), 255–289. https://doi.org/10.1146/annurev-cellbio-101512-122326 (2014). · DOI · Paper page
  24. Colombo, E., Borgiani, B., Verderio, C. & Furlan, R. Microvesicles: Novel biomarkers for neurological disorders. Front. Physiol. 3, 1–6. https://doi.org/10.3389/fphys.2012.00063 (2012). · DOI
  25. Chen, K. H. et al. Intravenous administration of xenogenic adipose-derived mesenchymal stem cells (ADMSC) and ADMSC-derived exosomes markedly reduced brain infarct volume and preserved neurological function in rat after acute ischemic stroke. Oncotarget 7(46), 74537–74556. https://doi.org/10.18632/oncotarget.12902 (2016). · DOI
  26. Martín-Martín, B., Nabokina, S. M., Lazo, P. A. & Mollinedo, F. Co-expression of several human syntaxin genes in neutrophils and differentiating HL-60 cells: variant isoforms and detection of syntaxin 1. J. Leukoc. Biol. 65(3), 397–406. https://doi.org/10.1002/jlb.65.3.397 (1999). · DOI
  27. Pattu, V. et al. SNARE protein expression and localization in human cytotoxic T lymphocytes. Eur. J. Immunol. 42(2), 470–475. https://doi.org/10.1002/eji.201141915 (2012). · DOI
  28. Agliardi, C. et al. SNAP-25 in serum is carried by exosomes of neuronal origin and is a potential biomarker of alzheimer’s disease. Mol. Neurobiol. 56(8), 5792–5798. https://doi.org/10.1007/s12035-019-1501-x (2019). · DOI
  29. Spessott, W. A., Sanmillan, M. L., McCormick, M. E., Kulkarni, V. V. & Giraudo, C. G. SM protein Munc18-2 facilitates transition of Syntaxin 11-mediated lipid mixing to complete fusion for T-lymphocyte cytotoxicity. Proc. Natl. Acad Sci. USA 114(11), E2176–E2185. https://doi.org/10.1073/pnas.1617981114 (2017). · DOI
  30. Agliardi, C. et al. Oligomeric α-Syn and SNARE complex proteins in peripheral extracellular vesicles of neural origin are biomarkers for Parkinson’s disease. Neurobiol. Dis. 148, 105185. https://doi.org/10.1016/j.nbd.2020.105185 (2021). · DOI
  31. Adams, H. P. Jr. et al. Baseline NIH Stroke Scale score strongly predicts outcome after stroke: A report of the Trial of Org 10172 in Acute Stroke Treatment (TOAST). Neurology 53(1), 126–131. https://doi.org/10.1212/wnl.53.1.126 (1999). · DOI · Paper page
  32. Ohura, T., Hase, K., Nakajima, Y. & Nakayama, T. Validity and reliability of a performance evaluation tool based on the modified Barthel Index for stroke patients. BMC Med. Res. Methodol. 17(1), 1–8. https://doi.org/10.1186/s12874-017-0409-2 (2017). · DOI
  33. Linn, B. S., Linn, M. W. & Gurel, L. Cumulative illness rating scale. J. Am. Geriatr. Soc. 16(5), 622–626. https://doi.org/10.1111/j.1532-5415.1968.tb02103.x (1968). · DOI
  34. Folstein, M. F., Folstein, S. E. & McHugh, P. R. “Mini-mental state”. A practical method for grading the cognitive state of patients for the clinician. J. Psychiatr. Res. 12(3), 189–198. https://doi.org/10.1016/0022-3956(75)90026-6 (1975). · DOI · Paper page
  35. Larry-Sparks, D. et al. Tau is reduced in AD plasma and validation of employed ELISA methods. Am. J. Neurodegener. Dis. 1(1), 99–106 (2012).
  36. Panda, S. K. & Ravindran, B. Isolation of human PBMCs. Bio-Protoc. 3(3), e323. https://doi.org/10.21769/BioProtoc.323 (2013). · DOI
  37. Gundacker, N. et al. Knowledge-based proteome profiling: Considering identified proteins to evaluate separation efficiency by 2-D PAGE. Electrophoresis 27(13), 2712–2721. https://doi.org/10.1002/elps.200500964 (2006). · DOI
  38. Mohr, T. et al. Proteome profiling in IL-1β and VEGF-activated human umbilical vein endothelial cells delineates the interlink between inflammation and angiogenesis. PLoS ONE 12(6), 1–23. https://doi.org/10.1371/journal.pone.0179065 (2017). · DOI
  39. Mustapic, M. et al. Plasma extracellular vesicles enriched for neuronal origin: A potential window into brain pathologic processes. Front. Neurosci. 11, 1–12. https://doi.org/10.3389/fnins.2017.00278 (2017). · DOI · Paper page
  40. Borrelli, C. et al. Drug-induced senescent multiple myeloma cells elicit nk cell proliferation by direct or exosome-mediated IL15 trans-presentation. Cancer Immunol. Res. 6(7), 860–869. https://doi.org/10.1158/2326-6066.CIR-17-0604 (2018). · DOI
  41. (2022) https://www.thebmj.www.bmj.com/about-bmj/resources-readers/publications/statistics-square-one/11-correlation-and-regression.
  42. Karimi, N. et al. Detailed analysis of the plasma extracellular vesicle proteome after separation from lipoproteins. Cell Mol. Life Sci. 75(15), 2873–2886. https://doi.org/10.1007/s00018-018-2773-4 (2018). · DOI
  43. Zhang, Z. G. & Chopp, M. Exosomes in stroke pathogenesis and therapy. J. Clin. Invest. 126(4), 1190–1197. https://doi.org/10.1172/JCI81133 (2016). · DOI
  44. Kochanek, P. M. & Hallenbeck, J. M. Polymorphonuclear leukocytes and monocytes/macrophages in the pathogenesis of cerebral ischemia and stroke. Stroke 23(9), 1367–1379. https://doi.org/10.1161/01.str.23.9.1367 (1992). · DOI
  45. Moore, D. F. et al. Using peripheral blood mononuclear cells to determine a gene expression profile of acute ischemic stroke: A pilot investigation. Circulation 111(2), 212–221. https://doi.org/10.1161/01.CIR.0000152105.79665.C6 (2005). · DOI
  46. Hou, Q. et al. SNAP-25 in hippocampal CA1 region is involved in memory consolidation. Eur. J. Neurosci. 20(6), 1593–1603. https://doi.org/10.1111/j.1460-9568.2004.03600.x (2004). · DOI
  47. Nabokina, S., Egea, G., Blasi, J. & Mollinedo, F. Intracellular location of SNAP-25 in human neutrophils. Biochem. Biophys. Res. Commun. 239(2), 592–597. https://doi.org/10.1006/bbrc.1997.7515 (1997). · DOI
  48. Nuyanzina, V. A. & Nabokina, S. M. Identification of exocytosis mediator proteins in peripheral blood neutrophils of patients with chronic myeloid leukemia. Bull. Exp. Biol. Med. 137(4), 361–363. https://doi.org/10.1023/b:bebm.0000035130.80245.13 (2004). · DOI
  49. Reed, G. L., Houng, A. K. & Fitzgerald, M. L. Human platelets contain SNARE proteins and a Sec1p homologue that interacts with syntaxin 4 and is phosphorylated after thrombin activation: Implications for platelet secretion. Blood 93(8), 2617–2626. https://doi.org/10.1182/blood.V93.8.2617 (1999). · DOI
  50. Redondo, P. C. et al. A role for SNAP-25 but not VAMPs in store-mediated Ca2+ entry in human platelets. J. Physiol. 558(1), 99–109. https://doi.org/10.1113/jphysiol.2004.064899 (2004). · DOI
  51. Bernhardt, J. et al. Agreed definitions and a shared vision for new standards in stroke recovery research: The Stroke Recovery and Rehabilitation Roundtable taskforce. Int. J Stroke. 12(5), 444–450. https://doi.org/10.1177/1747493017711816 (2017). · DOI
  52. Boyd, L. et al. Biomarkers of stroke recovery: Consensus-based core recommendations from the Stroke Recovery and Rehabilitation Roundtable. Int. J. Stroke. 12(5), 480–493. https://doi.org/10.1177/1747493017714176 (2017). · DOI
  53. Friberg, D., Bryant, J., Shannon, W. & Whiteside, T. L. In vitro cytokine production by normal human peripheral blood mononuclear cells as a measure of immunocompetence or the state of activation. Clin. Diagn. Lab Immunol. 1(3), 261–268. https://doi.org/10.1128/cdli.1.3.261-268.1994 (1994). · DOI
  54. Maa-Bared, S. et al. Association of ABCA1 with syntaxin 13 and flotillin-1 and enhanced phagocytosis in tangier cells. Mol. Biol. Cell. 15, 5399–5407. https://doi.org/10.1091/mbc.e04-03-0182 (2004). · DOI
  55. Arneson, L. N. et al. Cutting edge: Syntaxin 11 regulates lymphocyte-mediated secretion and cytotoxicity. J. Immunol. 179(6), 3397–3401. https://doi.org/10.4049/jimmunol.179.6.3397 (2007). · DOI
  56. Pei, Y. & Maitta, R. W. Alpha synuclein in hematopoiesis and immunity. Heliyon 5(10), e02590. https://doi.org/10.1016/j.heliyon.2019.e02590 (2019). · DOI
  57. Kostulas, N., Pelidou, S. H., Kivisakk, P., Kostulas, V. & Link, H. Increased IL-1beta, IL-8, and IL-17 mRNA expression in blood mononuclear cells observed in a prospective ischemic stroke study. Stroke 30(10), 2174–2179. https://doi.org/10.1161/01.str.30.10.2174 (1999). · DOI
  58. Budnik, V., Ruiz-Canada, C. & Wendler, F. Extracellular vesicles round off communication in the nervous system. Nat. Rev. Neurosci. 17(3), 160–172. https://doi.org/10.1038/nrn.2015.29 (2016). · DOI · Paper page
  59. Peak, T. C. et al. Syntaxin 6-mediated exosome secretion regulates enzalutamide resistance in prostate cancer. Mol. Carcinog. 59(1), 62–72. https://doi.org/10.1002/mc.23129 (2020). · DOI
  60. Frankel, M. R. et al. Predicting prognosis after stroke: A placebo group analysis from the National Institute of Neurological Disorders and Stroke rt-PA Stroke Trial. Neurology 55(7), 952–959. https://doi.org/10.1212/wnl.55.7.952 (2000). · DOI

Cited by

Sorted by citations

See all 12

Metadata

Authors
Cappelletti, P., Filareti, M., Masuelli, L., Bei, R., Hassanzadeh, K., Corbo, M., & Feligioni, M.
Venue
Scientific Reports
Published
2022-08-25
Volume
12
Issue
1
ISSN
2045-2322
Cited by
12
References
4
Language
en

About these checks

Registry, retraction, Cites and statistics results are computed, not judged, with one exception: a printed reference that no index lists is read once by a model before it counts as a citation error. Claims are extracted by a model and kept only when their quote appears verbatim in the text; each cited source is then checked, with a model’s help, for whether it says what the claim relies on. Those verdicts can be wrong — read the claim’s quote and the cited source before relying on one.

Statistics and arithmetic are recomputed, not judged.

Confidence bands are shown only for fields calibrated on our annotated test set. None is calibrated yet, so no band is shown.

What counts as a claim ›How we measure confidence ›How we check this ›

Are you an author, or do you see a problem with this page? Request a review