

The DOI matches its Crossref record; 32 of the 32 references it cites were found in a registry or an index.
Inhibition of inflammatory microglia by dietary fiber and short-chain fatty acids
Open accessAbstract
Microglia play a vital role maintaining brain homeostasis but can also cause persistent neuroinflammation. Short-chain fatty acids (SCFAs) produced by the intestinal microbiota have been suggested to regulate microglia inflammation indirectly by signaling through the gut-brain axis or directly by reaching the brain. The present work evaluated the anti-inflammatory effects of SCFAs on lipopolysaccharide (LPS)-stimulated microglia from mice fed inulin, a soluble fiber that is fermented by intestinal microbiota to produce SCFAs in vivo, and SCFAs applied to primary microglia in vitro. Feeding mice inulin increased SCFAs in the cecum and in plasma collected from the hepatic portal vein. Microglia isolated from mice fed inulin and stimulated with LPS in vitro secreted less tumor necrosis factor α (TNF-α) compared to microglia from mice not given inulin. Additionally, when mice were fed inulin and injected i.p with LPS, the ex vivo secretion of TNF-α by isolated microglia was lower than that secreted by microglia from mice not fed inulin and injected with LPS. Similarly, in vitro treatment of primary microglia with acetate and butyrate either alone or in combination downregulated microglia cytokine production with the effects being additive. SCFAs reduced histone deacetylase activity and nuclear factor-κB nuclear translocation after LPS treatment in vitro. Whereas microglia expression of SCFA receptors Ffar2 or Ffar3 was not detected by single-cell RNA sequencing analysis, the SCFA transporters Mct1 and Mct4 were. Nevertheless, inhibiting monocarboxylate transporters on primary microglia did not interfere with the anti-inflammatory effects of SCFAs, suggesting that if SCFAs produced in the gut regulate microglia directly it is likely through an epigenetic mechanism following diffusion.
Overview
The claims and statistics of this paper haven’t been checked yet.
Run the check — free, no account needed. It reads the open-access text and checks the sources it cites.
Integrity signals
Registry
Cites
Statistics
Figures
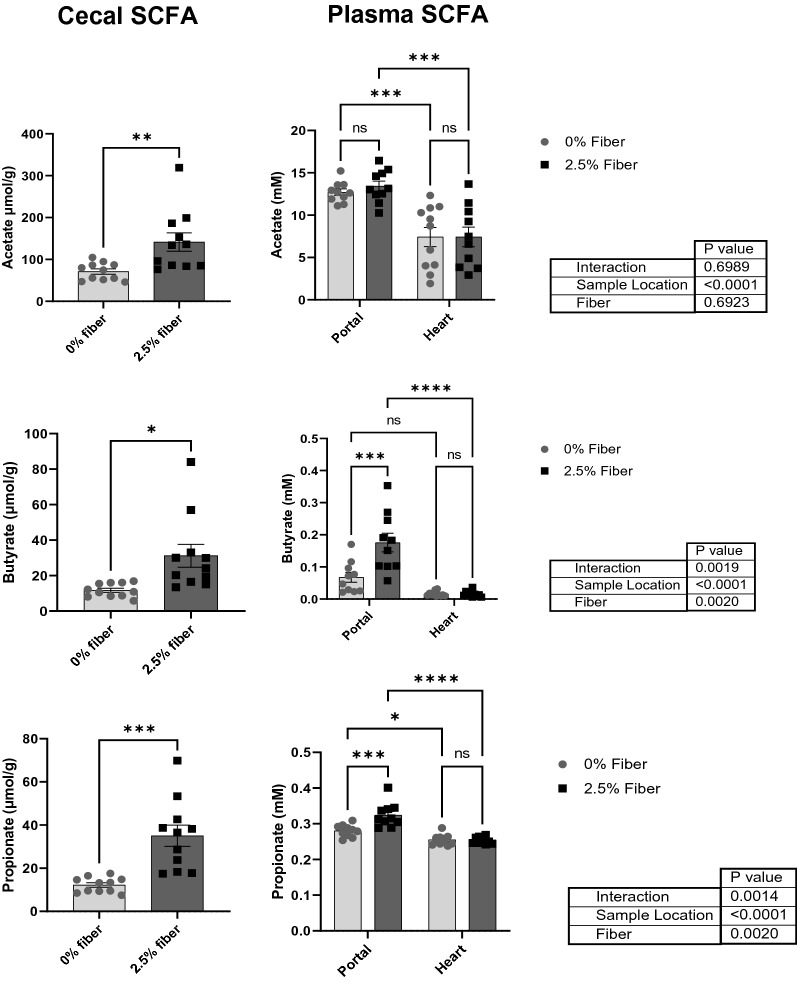
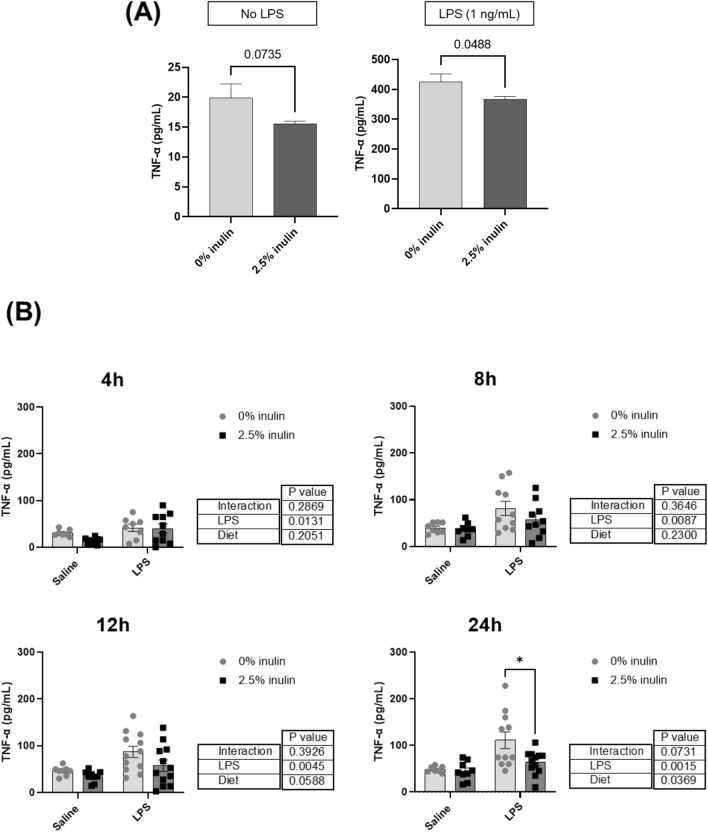
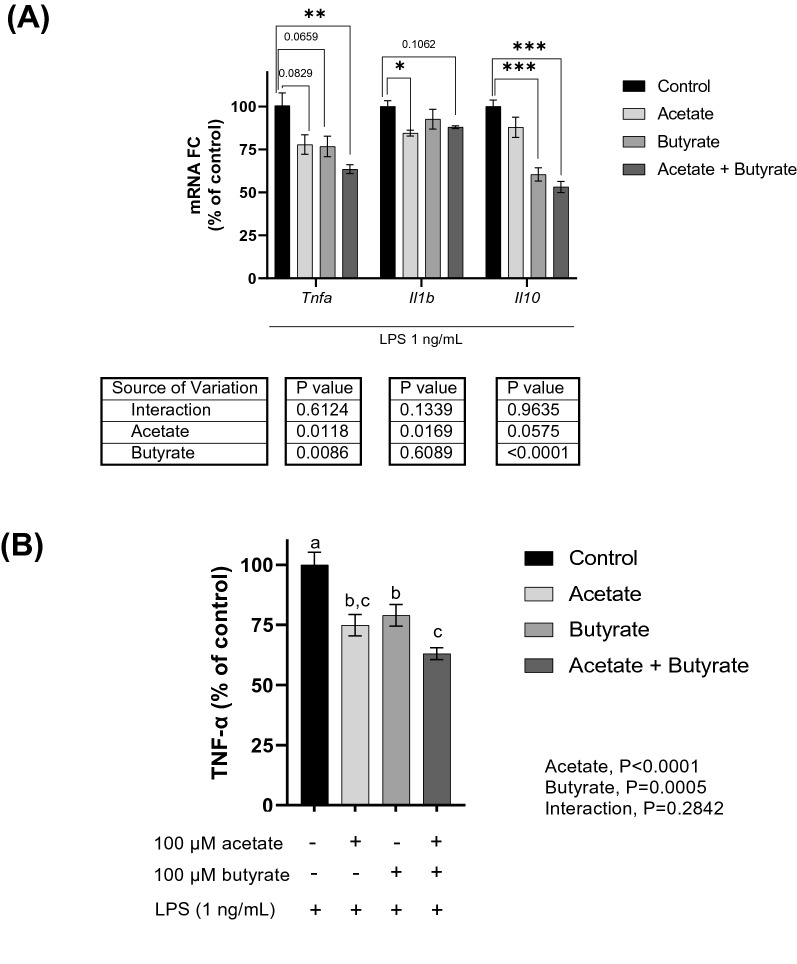
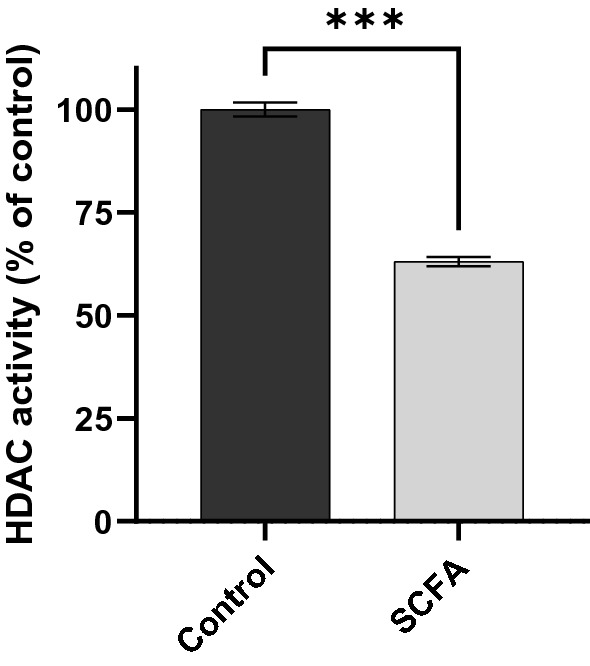
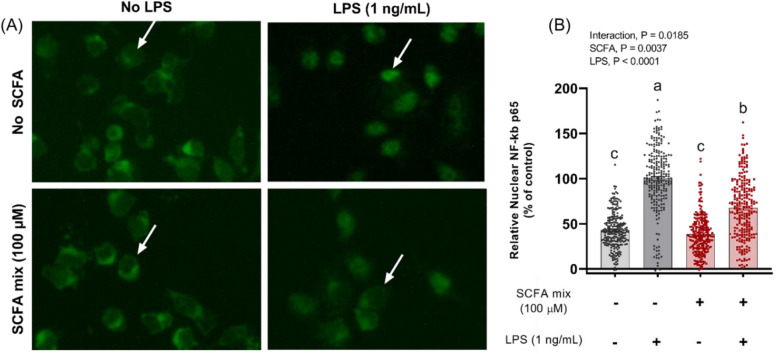
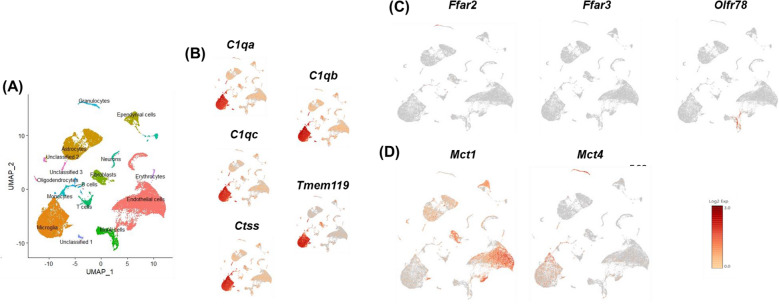
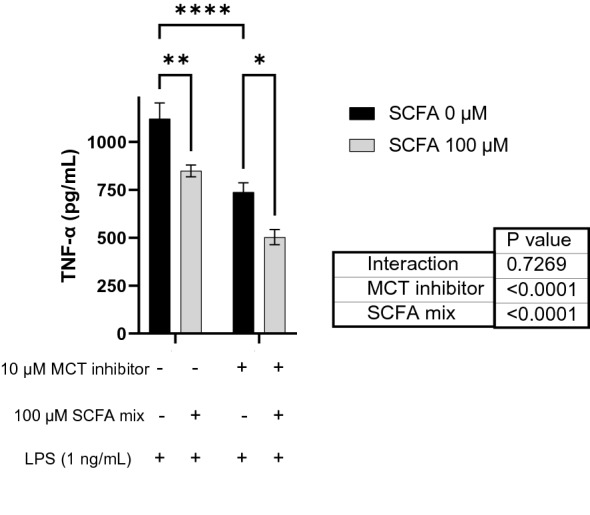
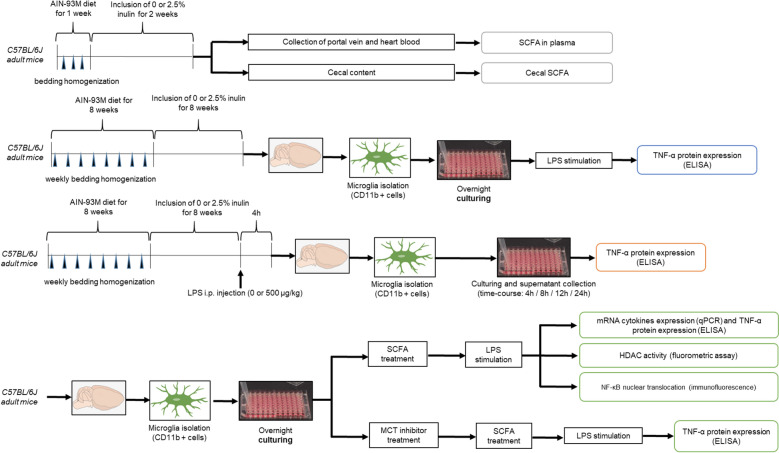
Verification
Claims the paper makes
The claims and statistics of this paper haven’t been checked yet.
Run the check — free, no account needed. It reads the open-access text and checks the sources it cites.
Claims other papers make about this one
Each is checked against this paper’s own text: does it say what the citing paper says it does?
In the citing paper
“Acetate and butyrate have been shown to inhibit the inflammatory response of LPS-stimulated primary microglia by inhibiting HDAC activity and NF-κB activation.289”
From Microbiota–gut–brain axis and its therapeutic applications in neurodegenerative diseases (2024) · cites this paper as [289]
Self-check
Percentages, sums and reported differences re-computed from the paper’s own numbers.
The self-check needs the paper’s full text.
Citations
Cites
The Microbial Metabolites, Short-Chain Fatty Acids, Regulate Colonic T reg Cell Homeostasis
Smith, P. M., Howitt, M. R., Panikov, N., Michaud, M., Gallini, C. A., Bohlooly-Y, M., Glickman, J. N., & Garrett, W. S. (2013) · Science · doi:10.1126/science.1241165 · Cited by 5,413
Host microbiota constantly control maturation and function of microglia in the CNS
Erny, D., Hrabě de Angelis, A. L., Jaitin, D., Wieghofer, P., Staszewski, O., David, E., Keren-Shaul, H., Mahlakoiv, T., Jakobshagen, K., Buch, T., et al. (2015) · Nature Neuroscience · doi:10.1038/nn.4030 · Cited by 3,569
The role of short-chain fatty acids in microbiota–gut–brain communication
Dalile, B., Van Oudenhove, L., Vervliet, B., & Verbeke, K. (2019) · Nature Reviews Gastroenterology & Hepatology · doi:10.1038/s41575-019-0157-3 · Cited by 3,357
Regulation of inflammatory responses by gut microbiota and chemoattractant receptor GPR43
Maslowski, K. M., Vieira, A. T., Ng, A., Kranich, J., Sierro, F., Yu, D., Schilter, H. C., Rolph, M. S., Mackay, F., Artis, D., et al. (2009) · Nature · doi:10.1038/nature08530 · Cited by 3,241
The Role of Short-Chain Fatty Acids From Gut Microbiota in Gut-Brain Communication
Silva, Y. P., Bernardi, A., & Frozza, R. L. (2020) · Frontiers in Endocrinology · doi:10.3389/fendo.2020.00025 · Cited by 3,043
Single-cell transcriptomics of 20 mouse organs creates a Tabula Muris
The Tabula Muris Consortium, coordination, O., coordination, L., processing, O. C. A., sequencing, L. P. A., analysis, C. D., annotation, C. T., Writing group, Supplemental text writing group, & Principal investigators (2018) · Nature · doi:10.1038/s41586-018-0590-4 · Cited by 2,842
HMDB 5.0: the Human Metabolome Database for 2022
Wishart, D. S., Guo, A., Oler, E., Wang, F., Anjum, A., Peters, H., Dizon, R., Sayeeda, Z., Tian, S., Lee, B. L., et al. (2021) · Nucleic Acids Research · doi:10.1093/nar/gkab1062 · Cited by 2,659
Interactions between the microbiota, immune and nervous systems in health and disease
Fung, T. C., Olson, C. A., & Hsiao, E. Y. (2017) · Nature Neuroscience · doi:10.1038/nn.4476 · Cited by 1,900
Systemic inflammation and microglial activation: systematic review of animal experiments
Hoogland, I. C. M., Houbolt, C., van Westerloo, D. J., van Gool, W. A., & van de Beek, D. (2015) · Journal of Neuroinflammation · doi:10.1186/s12974-015-0332-6 · Cited by 957
Nøhr, M. K., Pedersen, M. H., Gille, A., Egerod, K. L., Engelstoft, M. S., Husted, A. S., Sichlau, R. M., Grunddal, K. V., Poulsen, S. S., Han, S., et al. (2013) · Endocrinology · doi:10.1210/en.2013-1142 · Cited by 597
Erny, D., Dokalis, N., Mezö, C., Castoldi, A., Mossad, O., Staszewski, O., Frosch, M., Villa, M., Fuchs, V., Mayer, A., et al. (2021) · Cell Metabolism · doi:10.1016/j.cmet.2021.10.010 · Cited by 478
Benjamin, D., Robay, D., Hindupur, S. K., Pohlmann, J., Colombi, M., El‐Shemerly, M., Maira, S.-M., Moroni, C., Lane, H. A., & Hall, M. N. (2018) · Cell Reports · doi:10.1016/j.celrep.2018.11.043 · Cited by 414
Suzuki, T., Yoshida, S., & Hara, H. (2008) · British Journal Of Nutrition · doi:10.1017/s0007114508888733 · Cited by 370
Mitchell, R. W., On, N. H., Del Bigio, M. R., Miller, D. W., & Hatch, G. M. (2011) · Journal of Neurochemistry · doi:10.1111/j.1471-4159.2011.07245.x · Cited by 337
Wenzel, T. J., Gates, E. J., Ranger, A. L., & Klegeris, A. (2020) · Molecular and Cellular Neuroscience · doi:10.1016/j.mcn.2020.103493 · Cited by 320
Gerhart, D. Z., Enerson, B. E., Zhdankina, O., Leino, R. L., & Drewes, L. R. (1997) · American Journal of Physiology-Endocrinology and Metabolism · doi:10.1152/ajpendo.1997.273.1.e207 · Cited by 300
Trends in Dietary Fiber Intake in the United States, 1999-2008
King, D. E., Mainous, A. G., & Lambourne, C. A. (2012) · Journal of the Academy of Nutrition and Dietetics · doi:10.1016/j.jand.2012.01.019 · Cited by 295
Acetate coordinates neutrophil and ILC3 responses against C. difficile through FFAR2
Fachi, J. L., Sécca, C., Rodrigues, P. B., de Mato, F. C. P., Luccia, B. D., Felipe, J. D. S., Pral, L. P., Rungue, M., Rocha, V. D. M., Sato, F. T., et al. (2019) · The Journal of Experimental Medicine · doi:10.1084/jem.20190489 · Cited by 227
Liu, J., Sun, J., Wang, F., Yu, X., Ling, Z., Li, H., Zhang, H., Jin, J., Chen, W., Pang, M., et al. (2015) · BioMed Research International · doi:10.1155/2015/412946 · Cited by 225
Efficient isolation of live microglia with preserved phenotypes from adult mouse brain
Nikodémová, M., & Watters, J. J. (2012) · Journal of Neuroinflammation · doi:10.1186/1742-2094-9-147 · Cited by 165
Histone deacetylase 3 (HDAC 3) as emerging drug target in NF-κB-mediated inflammation
Leus, N. G. J., Zwinderman, M. R. H., & Dekker, F. J. (2016) · Current Opinion in Chemical Biology · doi:10.1016/j.cbpa.2016.06.019 · Cited by 153
Acetate reduces microglia inflammatory signaling in vitro
Soliman, M. L., Puig, K. L., Combs, C. K., & Rosenberger, T. A. (2012) · Journal of Neurochemistry · doi:10.1111/j.1471-4159.2012.07955.x · Cited by 131
Cerovic, M., Forloni, G., & Balducci, C. (2019) · Frontiers in Aging Neuroscience · doi:10.3389/fnagi.2019.00284 · Cited by 127
Microglia, Cytokines, and Neural Activity: Unexpected Interactions in Brain Development and Function
Ferro, A., Auguste, Y. S. S., & Cheadle, L. (2021) · Frontiers in Immunology · doi:10.3389/fimmu.2021.703527 · Cited by 116
Cook, T. M., Gavini, C. K., Jesse, J., Aubert, G., Gornick, E. S., Bonomo, R. R., Gautron, L., Layden, B. T., & Mansuy‐Aubert, V. (2021) · Molecular Metabolism · doi:10.1016/j.molmet.2021.101350 · Cited by 111
Soliman, M. L., Smith, M. D., Houdek, H. M., & Rosenberger, T. A. (2012) · Journal of Neuroinflammation · doi:10.1186/1742-2094-9-51 · Cited by 105
Nonionic diffusion of short-chain fatty acids across rat colon
Charney, A. N., Micic, L., & Egnor, R. W. (1998) · American Journal of Physiology-Gastrointestinal and Liver Physiology · doi:10.1152/ajpgi.1998.274.3.g518 · Cited by 96
Short-Chain Fatty Acid and FFAR2 Activation – A New Option for Treating Infections?
Schlatterer, K., Peschel, A., & Kretschmer, D. (2021) · Frontiers in Cellular and Infection Microbiology · doi:10.3389/fcimb.2021.785833 · Cited by 94
How microbiota shape microglial phenotypes and epigenetics
Erny, D., & Prinz, M. (2020) · Glia · doi:10.1002/glia.23822 · Cited by 80
Copper‐Binding Peptides Attenuate Microglia Inflammation through Suppression of NF‐kB Pathway
Caetano‐Silva, M. E., Rund, L. A., Vailati-Riboni, M., Pacheco, M. T. B., & Johnson, R. W. (2021) · Molecular Nutrition & Food Research · doi:10.1002/mnfr.202100153 · Cited by 49
Self-citationFeeding the beast: Can microglia in the senescent brain be regulated by diet?
Johnson, R. W. (2014) · Brain Behavior and Immunity · doi:10.1016/j.bbi.2014.09.022 · Cited by 44
Self-citationDietary Fiber as a Counterbalance to Age-Related Microglial Cell Dysfunction
Vailati-Riboni, M., Rund, L. A., Caetano‐Silva, M. E., Hutchinson, N. T., Wang, S. S., Soto‐Díaz, K., Woods, J. A., Steelman, A. J., & Johnson, R. W. (2022) · Frontiers in Nutrition · doi:10.3389/fnut.2022.835824 · Cited by 35
Self-citation
Cited by
Sorted by citations
Microbiota–gut–brain axis and its therapeutic applications in neurodegenerative diseases
Loh, J. S., Mak, W. Q., Tan, L. K. S., Ng, C. X., Chan, H. H., Yeow, S. H., Foo, J. B., Ong, Y. S., How, C. W., & Khaw, K. Y. (2024) · Signal Transduction and Targeted Therapy · doi:10.1038/s41392-024-01743-1 · Cited by 1,193
Abdolmaleky, H. M., & Zhou, J. (2024) · Antioxidants · doi:10.3390/antiox13080985 · Cited by 335
Cao, Q., Shen, M., Li, R., Liu, Y., Zeng, Z., Zhou, J., Niu, D., Zhang, Q., Wang, R., Yao, J., et al. (2025) · Journal of Neuroinflammation · doi:10.1186/s12974-025-03454-y · Cited by 138
Jiao, W., Lin, J., Deng, Y., Ji, Y., Liang, C., Wei, S., Xi, J., & Yan, F. (2025) · Journal of Neuroinflammation · doi:10.1186/s12974-024-03312-3 · Cited by 132
The gut microbiota–brain axis in neurological disorders
You, M., Chen, N., Yang, Y., Cheng, L., He, H., Cai, Y., Liu, Y., Liu, H., & Hong, G. (2024) · MedComm · doi:10.1002/mco2.656 · Cited by 113
Metadata
- Authors
- Caetano-Silva, M. E., Rund, L., Hutchinson, N. T., Woods, J. A., Steelman, A. J., & Johnson, R. W.
- Affiliations
- University of Illinois Urbana-Champaign (US)
- Corresponding author
- Johnson, Rodney W.
- Venue
- Scientific Reports
- Published
- 2023-02-16
- Volume
- 13
- Issue
- 1
- Pages
- 2819-2819
- ISSN
- 2045-2322 (ISSN-L)
- PMC
- PMC9935636
- OpenAlex
- W4321018263
- Cited by
- 225
- References
- 32
- Citations by year
- 2026: 80 · 2025: 77 · 2024: 51 · 2023: 17
- FWCI
- 23.02
- Type
- journal article
- Language
- en
- Open access
- gold
- doi.org
- Locations
- Scientific Reports (publishedVersion, cc-by)
- PubMed Central (publishedVersion, cc-by)
- PubMed (publishedVersion)
- DOAJ (DOAJ: Directory of Open Access Journals) (submittedVersion, cc-by-sa)
- Funders
- National Institutes of Health (R01 AG059622)
- Topics
- Life Sciences › Neuroscience › Neurology › Neuroinflammation and Neurodegeneration Mechanisms
- Life Sciences › Biochemistry, Genetics and Molecular Biology › Molecular Biology › Gut microbiota and health
- Life Sciences › Neuroscience › Biological Psychiatry › Tryptophan and brain disorders
- Keywords
- microglia, neuroinflammation, short-chain fatty acids, dietary fiber, inulin, gut microbiota, lipopolysaccharide, TNF-α, acetate, butyrate, histone deacetylase, NF-κB, FFAR2, FFAR3, MCT1, MCT4, monocarboxylate transporters, epigenetic regulation, gut-brain axis
- MeSH terms
- Animals, Anti-Inflammatory Agents, Dietary Fiber, Fatty Acids, Volatile, Inulin, Lipopolysaccharides, Tumor Necrosis Factor-alpha, Microglia, Membrane Transport Proteins, Mice
About these checks
Registry, retraction, Cites and statistics results are computed, not judged, with one exception: a printed reference that no index lists is read once by a model before it counts as a citation error. Claims are extracted by a model and kept only when their quote appears verbatim in the text; each cited source is then checked, with a model’s help, for whether it says what the claim relies on. Those verdicts can be wrong — read the claim’s quote and the cited source before relying on one.
Statistics and arithmetic are recomputed, not judged.
Confidence bands are shown only for fields calibrated on our annotated test set. None is calibrated yet, so no band is shown.
What counts as a claim ›How we measure confidence ›How we check this ›
Are you an author, or do you see a problem with this page? Request a review
