

The DOI matches its Crossref record; 37 of the 37 references it cites were found in a registry or an index.
Improving Josephson junction reproducibility for superconducting quantum circuits: junction area fluctuation
Open accessAbstract
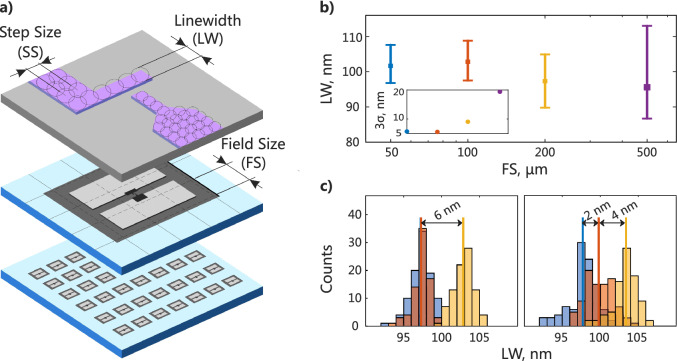
Josephson superconducting qubits and parametric amplifiers are prominent examples of superconducting quantum circuits that have shown rapid progress in recent years. As such devices become more complex, the requirements for reproducibility of their electrical properties across a chip are being tightened. Critical current of the Josephson junction Ic is the essential electrical parameter in a chip. So, its variation is to be minimized. According to the Ambegaokar–Baratoff formula, critical current is related to normal-state resistance, which can be measured at room temperature. In this study, we focused on the dominant source of non-uniformity for the Josephson junction critical current–junction area variation. We optimized Josephson junction fabrication process and demonstrated resistance variation of 9.8–4.4% and 4.8–2.3% across 22 × 22 mm 2 and 5 × 10 mm 2 chip areas, respectively. For a wide range of junction areas from 0.008 to 0.12 μm 2, we ensure a small linewidth standard deviation of 4 nm measured over 4500 junctions with linear dimensions from 80 to 680 nm. We found that the dominate source of junction area variation limiting $${\mathrm{I}}_{\mathrm{c}}$$ I c reproducibility is the imperfection of the evaporation system. The developed fabrication process was tested on superconducting highly coherent transmon qubits (T1 > 100 μs) and a nonlinear asymmetric inductive element parametric amplifier.
Overview
The claims and statistics of this paper haven’t been checked yet.
Run the check — free, no account needed. It reads the open-access text and checks the sources it cites.
Integrity signals
Registry
Cites
Statistics
Figures



Verification
Claims the paper makes
The claims and statistics of this paper haven’t been checked yet.
Run the check — free, no account needed. It reads the open-access text and checks the sources it cites.
Claims other papers make about this one
Each is checked against this paper’s own text: does it say what the citing paper says it does?
The source backs part of the claim, not all of it — or backs it for a different population, condition or comparison.
In the citing paper
“The standard deviations for area are comparable with values reported in literature3,53.”
From Advanced CMOS manufacturing of superconducting qubits on 300 mm wafers (2024) · cites this paper as [53]
Experimental — accuracy not yet measured
Self-check
Percentages, sums and reported differences re-computed from the paper’s own numbers.
The self-check needs the paper’s full text.
Citations
Cites
Quantum supremacy using a programmable superconducting processor
Arute, F., Arya, K., Babbush, R., Bacon, D., Bardin, J. C., Barends, R., Biswas, R., Boixo, S., Brandao, F. G. S. L., Buell, D. A., et al. (2019) · Nature · doi:10.1038/s41586-019-1666-5 · Cited by 7,720
Charge-insensitive qubit design derived from the Cooper pair box
Koch, J., Yu, T. M., Gambetta, J., Houck, A. A., Schuster, D. I., Majer, J., Blais, A., Devoret, M. H., Girvin, S. M., & Schoelkopf, R. J. (2007) · Physical Review A · doi:10.1103/physreva.76.042319 · Cited by 3,351
Tunneling Between Superconductors
Ambegaokar, V., & Baratoff, A. (1963) · Physical Review Letters · doi:10.1103/physrevlett.10.486 · Cited by 2,195
Suppressing quantum errors by scaling a surface code logical qubit
Google Quantum, A. I., Acharya, R., Aleiner, I., Allen, R., Andersen, T. I., Ansmann, M., Arute, F., Arya, K., Asfaw, A., Atalaya, J., et al. (2023) · Nature · doi:10.1038/s41586-022-05434-1 · Cited by 1,103
Fluxonium: Single Cooper-Pair Circuit Free of Charge Offsets
Manucharyan, V. E., Koch, J., Glazman, L. I., & Devoret, M. H. (2009) · Science · doi:10.1126/science.1175552 · Cited by 805
Offset masks for lift-off photoprocessing
Dolan, G. J. (1977) · Applied Physics Letters · doi:10.1063/1.89690 · Cited by 693
Realizing repeated quantum error correction in a distance-three surface code
Krinner, S., Lacroix, N., Remm, A., Di Paolo, A., Genois, E., Leroux, C., Hellings, C., Lazar, S., Swiadek, F., Herrmann, J., et al. (2022) · Nature · doi:10.1038/s41586-022-04566-8 · Cited by 686
Quantum computational advantage via 60-qubit 24-cycle random circuit sampling
Zhu, Q., Cao, S., Chen, F., Chen, M.-C., Chen, X., Chung, T.-H., Deng, H., Du, Y., Fan, D., Gong, M., et al. (2022) · Science Bulletin · doi:10.1016/j.scib.2021.10.017 · Cited by 263
Laser-annealing Josephson junctions for yielding scaled-up superconducting quantum processors
Hertzberg, J. B., Zhang, E. J., Rosenblatt, S., Magesan, E., Smolin, J. A., Yau, J.-B., Adiga, V. P., Sandberg, M., Brink, M., Chow, J. M., et al. (2021) · npj Quantum Information · doi:10.1038/s41534-021-00464-5 · Cited by 198
Experimental Realization of a Protected Superconducting Circuit Derived from the 0 – π Qubit
Gyenis, A., Mundada, P., Paolo, A. D., Hazard, T., You, X., Schuster, D., Koch, J., Blais, A., & Houck, A. (2021) · PRX Quantum · doi:10.1103/prxquantum.2.010339 · Cited by 179
Cited by
Advanced CMOS manufacturing of superconducting qubits on 300 mm wafers
Van Damme, J., Massar, S., Acharya, R., Ivanov, T., Perez Lozano, D., Canvel, Y., Demarets, M., Vangoidsenhoven, D., Hermans, Y., Lai, J. G., et al. (2024) · Nature · doi:10.1038/s41586-024-07941-9 · Cited by 63
“The standard deviations for area are comparable with values reported in literature 3,53 .”
Result
Metadata
- Authors
- Pishchimova, A. A., Smirnov, N. S., Ezenkova, D. A., Krivko, E. A., Zikiy, E. V., Moskalev, D. O., Ivanov, A. I., Korshakov, N. D., & Rodionov, I. A.
- Affiliations
- Bauman Moscow State Technical University (RU)
- Corresponding author
- Rodionov, Ilya A.
- ORCID
- Venue
- Scientific Reports
- Published
- 2023-04-25
- Volume
- 13
- Issue
- 1
- Pages
- 6772-6772
- ISSN
- 2045-2322 (ISSN-L)
- PMC
- PMC10130087
- OpenAlex
- W4366983175
- Cited by
- 39
- References
- 37
- Citations by year
- 2026: 13 · 2025: 11 · 2024: 14 · 2023: 1
- FWCI
- 3.68
- Type
- journal article
- Language
- en
- Open access
- gold
- doi.org
- Licence
- cc-by
- creativecommons.org/licenses/by/4.0 (tdm)
- creativecommons.org/licenses/by/4.0 (vor)
- Locations
- Scientific Reports (publishedVersion, cc-by)
- PubMed Central (publishedVersion, cc-by)
- PubMed (publishedVersion)
- arXiv (Cornell University) (submittedVersion)
- DOAJ (DOAJ: Directory of Open Access Journals) (submittedVersion, cc-by-sa)
- arXiv (Cornell University)
- Topics
- Physical Sciences › Physics and Astronomy › Atomic and Molecular Physics, and Optics › Quantum Information and Cryptography
- Physical Sciences › Engineering › Electrical and Electronic Engineering › Superconducting and THz Device Technology
- Physical Sciences › Physics and Astronomy › Condensed Matter Physics › Physics of Superconductivity and Magnetism
- Keywords
- critical current, superconducting qubits, transmon qubits, parametric amplifiers, normal resistance, Ambegaokar-Baratoff relation, superconducting quantum circuits, fabrication process optimization
About these checks
Registry, retraction, Cites and statistics results are computed, not judged, with one exception: a printed reference that no index lists is read once by a model before it counts as a citation error. Claims are extracted by a model and kept only when their quote appears verbatim in the text; each cited source is then checked, with a model’s help, for whether it says what the claim relies on. Those verdicts can be wrong — read the claim’s quote and the cited source before relying on one.
Statistics and arithmetic are recomputed, not judged.
Confidence bands are shown only for fields calibrated on our annotated test set. None is calibrated yet, so no band is shown.
What counts as a claim ›How we measure confidence ›How we check this ›
Are you an author, or do you see a problem with this page? Request a review
How to cite
Cite CoChat for the checks on this page, and the paper for its own findings.
- This page
- CoChat. (2026). Citation check: Improving Josephson junction reproducibility for superconducting quantum circuits: junction area fluctuation. https://app.cochat.ai/papers/10.1038/s41598-023-34051-9
- The paper
- Pishchimova, A. A., Smirnov, N. S., Ezenkova, D. A., Krivko, E. A., Zikiy, E. V., Moskalev, D. O., Ivanov, A. I., Korshakov, N. D., & Rodionov, I. A. (2023). Improving Josephson junction reproducibility for superconducting quantum circuits: junction area fluctuation. Scientific Reports. https://doi.org/10.1038/s41598-023-34051-9
Data sources
Bibliographic data: Semantic Scholar, OpenAlex, Crossref.
Contains information from the Semantic Scholar Academic Graph Datasets, made available under the ODC Attribution License (ODC-BY 1.0).
Semantic Scholar’s data is described in: Kinney, R., et al. (2023). The Semantic Scholar Open Data Platform. arXiv:2301.10140.
