

The DOI matches its Crossref record; 20 of the 20 references it cites were found in a registry or an index; 6 of the 13 sources its claims cite were checked for support.
Explainable artificial intelligence for searching frequency characteristics in Parkinson's disease tremor
Open accessAbstract
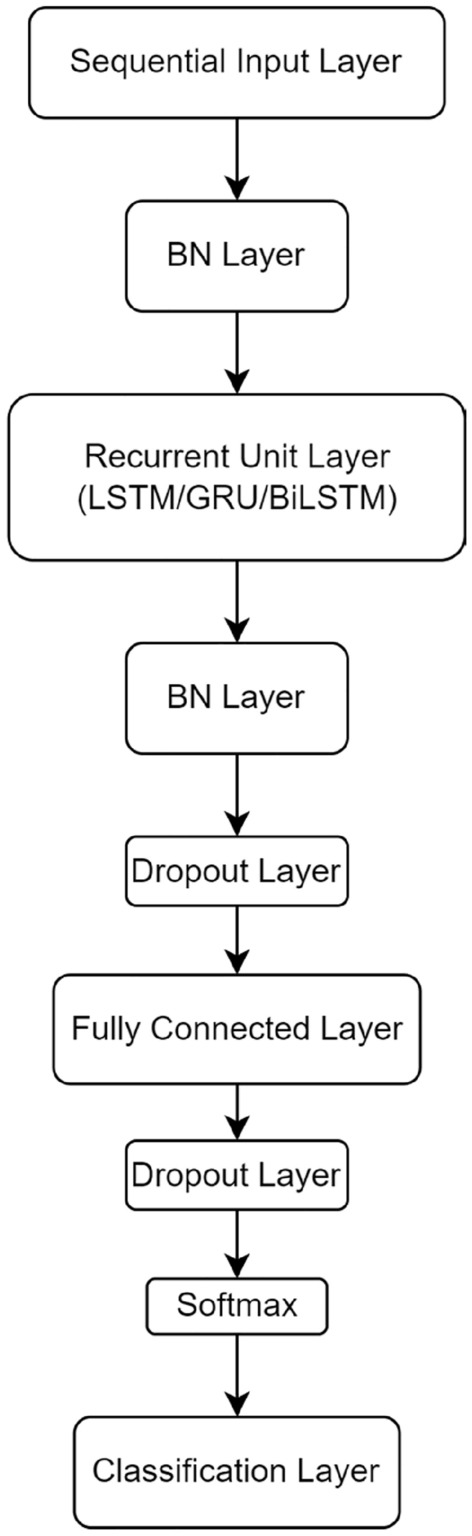
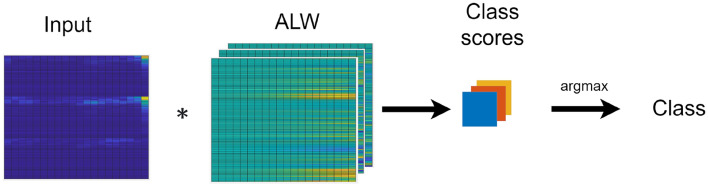
The distinction between Parkinson's disease (PD) and essential tremor (ET) tremors is subtle, posing challenges in differentiation. To accurately classify the PD and ET, BiLSTM-based recurrent neural networks are employed to classify between normal patients (N), PD patients, and ET patients using accelerometry data on their lower arm (L), hand (H), and upper arm (U) as inputs. The trained recurrent neural network (RNN) has reached 80% accuracy. The neural network is analyzed using layer-wise relevance propagation (LRP) to understand the internal workings of the neural network. A novel explainable AI method, called LRP-based approximate linear weights (ALW), is introduced to identify the similarities in relevance when assigning the class scores in the neural network. The ALW functions as a 2D kernel that linearly transforms the input data directly into the class scores, which significantly reduces the complexity of analyzing the neural network. This new classification method reconstructs the neural network's original function, achieving a 73% PD and ET tremor classification accuracy. By analyzing the ALWs, the correlation between each input and the class can also be determined. Then, the differentiating features can be subsequently identified. Since the input is preprocessed using short-time Fourier transform (STFT), the differences between the magnitude of tremor frequencies ranging from 3 to 30 Hz in the mean N, PD, and ET subjects are successfully identified. Aside from matching the current medical knowledge on frequency content in the tremors, the differentiating features also provide insights about frequency contents in the tremors in other frequency bands and body parts.
Overview
CoChat Summary
TL;DR
This paper trains a BiLSTM-based recurrent neural network to classify normal, Parkinson’s disease, and essential tremor subjects from upper-limb accelerometry, then applies layer-wise relevance propagation and a new approximate linear weights method to identify frequency-domain differentiating features. The RNN reached 80% accuracy, while the simplified ALW classifier reached 73% accuracy and highlighted tremor frequency bands across lower arm, hand, and upper arm.
Key findings
- The BiLSTM-based RNN classified N, PD, and ET with 80% accuracy; the LRP-based ALW reconstruction achieved 73% accuracy.
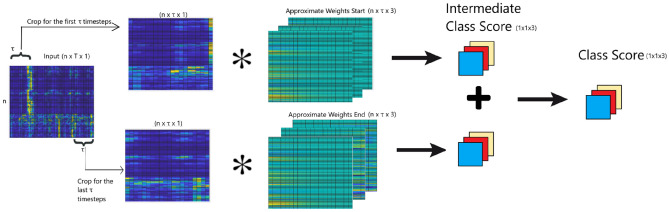
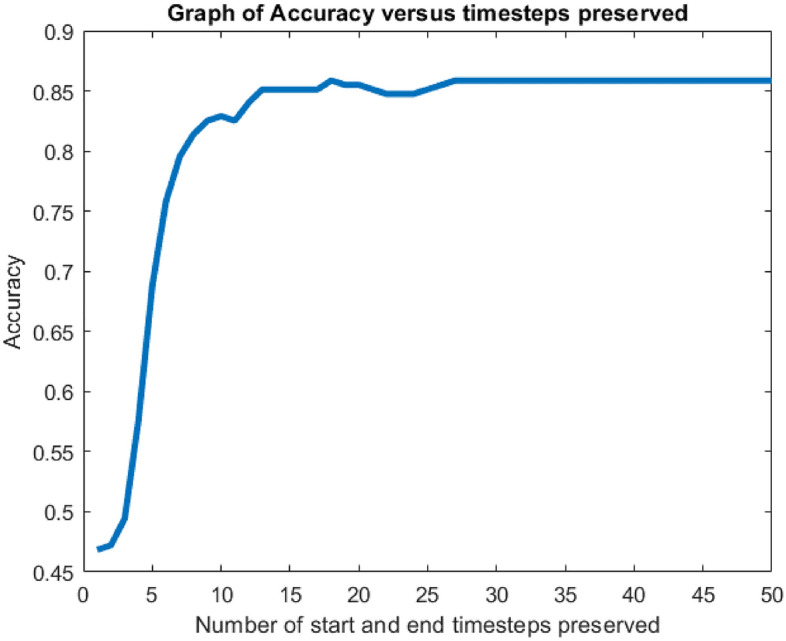
- LRP indicated that only the first and last 20 timesteps were important for classification: accuracy dropped when fewer than 20 preserved timesteps were used and stayed relatively constant with more than 20.
- ALW identified frequency features including PD with high amplitude at 4.7 Hz in the lower arm and 4.7 Hz and 5.5 Hz in the hand and upper arm; ET with high amplitude at 4.7–5.5 Hz, 7.8–8.6 Hz, and 10.9–11.7 Hz in the lower arm, 4.7–8.6 Hz in the hand, and 6.3–9.4 Hz and 10.9–11.3 Hz in the upper arm; and N with relatively higher amplitude at 20–30 Hz at all body parts and at 3.1 Hz.
- Erasure analysis supported the LRP implementation: removing positively relevant parameters dropped accuracy to almost zero, while removing negatively relevant parameters raised accuracy to 100%.
Methods
- Tremors were measured with an SBG IG-500A attitude and heading reference system on the lower arm, hand, and upper arm during REST, OUT, WING, DRINK, and FNF actions.
- The methodology reports 67 N, 87 PD, and 18 ET subjects; a later comparison section lists 86 PD patients (55 males, 31 females, mean age 69.67 ± 8.18), 18 ET patients (10 males, eight females, mean age 67.06 ± 8.93), and 67 normal subjects (35 males, 32 females, mean age 55.03 ± 10.8). Data were interpolated with PCHIP, bandpass filtered at 3–30 Hz, and preprocessed with STFT at 4.7 ms time resolution and 0.7825 Hz frequency resolution from 3.12 to 29.69 Hz.
- A BiLSTM-based RNN was trained with a class-balanced testing set of 30, an 80:20 training-validation split for the remaining data, batch normalization, and 40% dropout. LRP was applied to explain the network, and ALW approximated the input-to-class-score relationship as a 2D convolutional layer.
Limitations
- The paper states that ALW neglects neural-network nonlinearity and lowers accuracy; LRP has relevance leakage from bias terms and the LSTM forget gate; limited datasets and oversampling of ET data may have caused overfitting; STFT captures stationary and linear data although tremor is described as non-stationary and non-linear; drinking action may introduce dynamic action tremor noise; and the reported unique features need further validation with clinicians’ judgment.
- Evident from the text: the ET group is much smaller than the N and PD groups, and the normal group has a lower mean age than the PD and ET groups, which may affect generalizability.
Model-written summary. Check it against the paper before relying on it.
Integrity signals
Registry
Cites
Statistics
Figures




Verification
Claims the paper makes
3 Valid · 2 Not valid · 7 Not checked · 37 Own results and interpretations
Some cited sources support this claim and some don’t — read each source’s verdict below.
In the paper
“According to Puschmann et al.2, Lenka et al.14, and Thenganatt et al.15, the frequency of PD’s tremor lies between 4 and 6 Hz.”
§ Explainable artificial intelligence for searching frequency characteristics in Parkinson’s disease tremor > Results and discussion > Comparison with existing medical knowledge
What the sources say
- Disputedcites Puschmann et al.2 Puschmann, A. & Wszolek, Z. K. Diagnosis and treatment of common forms of tremor. Semin Neurol 31(1), 65–77. https://doi.org/10.1055/s-0031-1271312 (2011). sourceExperimental — accuracy not yet measured
The “Tremor Frequency” section gives the usual frequency of PD tremor as 3–5 Hz, not 4–6 Hz. It also notes that PD tremor can occur below 4 Hz. The supplied passage has no page number. (LLM, conf=0.89)
Checked by a reasoning model — may be wrong.
- Partly supportedcites Lenka et al.14 Lenka, A. & Jankovic, J. Tremor syndromes: An updated review. Front. Neurol. 12, 684835. https://doi.org/10.3389/fneur.2021.684835 (2021). sourceExperimental — accuracy not yet measured
The “Rest Tremor” subsection under “Tremor Associated With Parkinsonism” says that rest tremor in PD typically has a frequency of 4–6 Hz. The citing sentence omits both “rest” and “typically,” presenting that range as applying to PD tremor generally. (LLM, conf=0.86)
- Supportedcites Thenganatt et al.15 Thenganatt, M. A. & Louis, E. D. Distinguishing essential tremor from Parkinson’s disease: bedside tests and laboratory evaluations. Expert Rev. Neurother. 12(6), 687–696. https://doi.org/10.1586/ern.12.49 (2012). source
The Neurophysiological evaluation section reports that more than 95% of PD cases had tremor frequencies in the 4–6 Hz range when measurements from all limb positions were pooled. The Bedside examination section also describes PD rest tremor as 4–6 Hz. The claim is supported as a typical range, not an exceptionless one. (LLM, conf=0.92)
plain- Asserted: passes — The authors put it forward as true.
- Checkable: passes — It can be checked against evidence.
- Load-bearing: unclear — It is unclear whether the paper’s conclusions depend on it.
- Based: passes — The paper gives a reason why it holds.
- Disputed
A result the paper reports from its own data — it cites no other source for it, so there is none to check. The quote shows it is in the paper.
In the paper
“it is also observed that normal patients’ tremor tends to have a relatively higher amplitude of frequency at 20–30 Hz at all body parts.”
§ Explainable artificial intelligence for searching frequency characteristics in Parkinson’s disease tremor > Results and discussion > Comparison with existing medical knowledge
hedgedstates an association- Asserted: passes — The authors put it forward as true.
- Checkable: passes — It can be checked against evidence.
- Load-bearing: unclear — It is unclear whether the paper’s conclusions depend on it.
- Based: passes — The paper gives a reason why it holds.
A result the paper reports from its own data — it cites no other source for it, so there is none to check. The quote shows it is in the paper.
In the paper
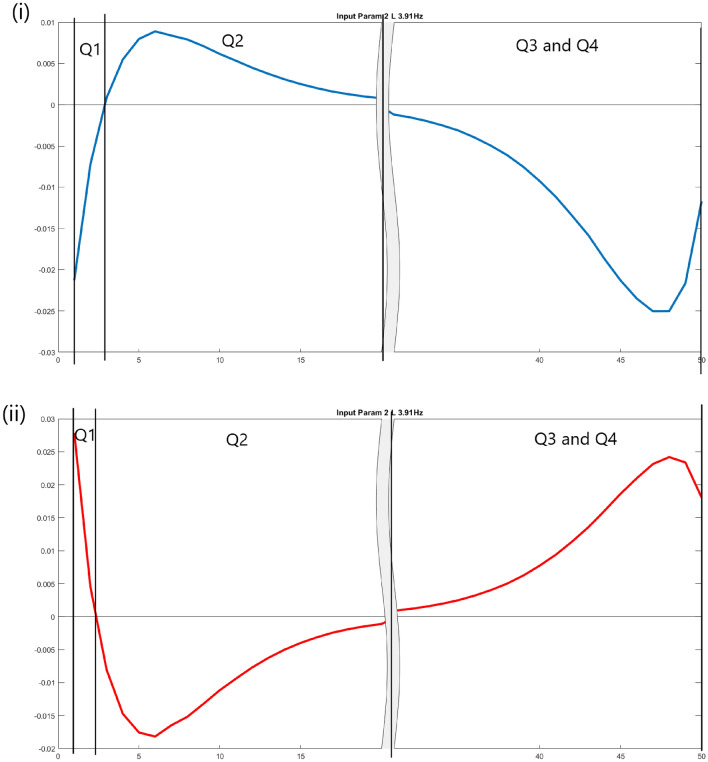
“For example, for frequency content 3.9 Hz at the lower arm in N, the weights change from negative to positive in the first half of the timesteps.”
§ Explainable artificial intelligence for searching frequency characteristics in Parkinson’s disease tremor > Results and discussion > Differentiating features identification
plain- Asserted: passes — The authors put it forward as true.
- Checkable: passes — It can be checked against evidence.
- Load-bearing: unclear — It is unclear whether the paper’s conclusions depend on it.
- Based: passes — The paper gives a reason why it holds.
A result the paper states — it cites no source for it, so there is none to check. The quote shows it is in the paper.
In the paper
“The performance has degraded using the ALWs.”
§ Explainable artificial intelligence for searching frequency characteristics in Parkinson’s disease tremor > Results and discussion > Layer-wise relevance propagation (LRP)
plainstates a cause- Asserted: passes — The authors put it forward as true.
- Checkable: passes — It can be checked against evidence.
- Load-bearing: passes — The paper’s conclusions depend on it.
- Based: passes — The paper gives a reason why it holds.
A result the paper reports from its own data — it cites no other source for it, so there is none to check. The quote shows it is in the paper.
In the paper
“the neural network can achieve full classification at 20 preserved timesteps based on the time index.”
§ Explainable artificial intelligence for searching frequency characteristics in Parkinson’s disease tremor > Results and discussion > Layer-wise relevance propagation (LRP)
plainstates a cause- Asserted: passes — The authors put it forward as true.
- Checkable: passes — It can be checked against evidence.
- Load-bearing: passes — The paper’s conclusions depend on it.
- Based: passes — The paper gives a reason why it holds.
14 more claims
Create a free account to see all 49 claims and every source verdict.
- It may state two separate claims as one. 21
- Probably not a substantial claim. 13
- The quote only partly states this claim. 1
Citations
Cites
On Pixel-Wise Explanations for Non-Linear Classifier Decisions by Layer-Wise Relevance Propagation
Bach, S., Binder, A., Montavon, G., Klauschen, F., Müller, K.-R., & Samek, W. (2015) · PLOS ONE · doi:10.1371/journal.pone.0130140 · Cited by 4,524 · cited 1×
“Bach et al. 8 developed layer-wise relevance propagation (LRP) to explain the decision-making of a convolutional neural network for each parameter of the input data.”
BackgroundKey challenges for delivering clinical impact with artificial intelligence
Kelly, C. J., Karthikesalingam, A., Suleyman, M., Corrado, G., & King, D. (2019) · BMC Medicine · doi:10.1186/s12916-019-1426-2 · Cited by 3,136
The diagnosis of Parkinson’s disease
Tolosa, E., Wenning, G., & Poewe, W. (2006) · The Lancet Neurology · doi:10.1016/s1474-4422(05)70285-4 · Cited by 902
Explaining Recurrent Neural Network Predictions in Sentiment Analysis
Arras, L., Montavon, G., Müller, K.-R., & Samek, W. (2017) · Proceedings of the 8th Workshop on Computational Approaches to Subjectivity, Sentiment and Social Media Analysis · doi:10.18653/v1/w17-5221 · Cited by 361
Motor-unit activity responsible for 8- to 12-Hz component of human physiological finger tremor
Elble, R. J., & Randall, J. E. (1976) · Journal of Neurophysiology · doi:10.1152/jn.1976.39.2.370 · Cited by 300
Differential diagnosis of common tremor syndromes
Bhidayasiri, R. (2005) · Postgraduate Medical Journal · doi:10.1136/pgmj.2005.032979 · Cited by 177
Distinguishing essential tremor from Parkinson's disease: bedside tests and laboratory evaluations
Thenganatt, M. A., & Louis, E. D. (2012) · Expert Review of Neurotherapeutics · doi:10.1586/ern.12.49 · Cited by 155 · cited 1×
“According to Puschmann et al. 2 , Lenka et al. 14 , and Thenganatt et al. 15 , the frequency of PD’s tremor lies between 4 and 6 Hz.”
Diagnosis and Treatment of Common Forms of Tremor
Puschmann, A., & Wszolek, Z. (2011) · Seminars in Neurology · doi:10.1055/s-0031-1271312 · Cited by 138
Tremor Syndromes: An Updated Review
Lenka, A., & Jankovic, J. (2021) · Frontiers in Neurology · doi:10.3389/fneur.2021.684835 · Cited by 132
Differential diagnosis of Parkinson and essential tremor with convolutional LSTM networks
Oktay, A. B., & Koçer, A. (2019) · Biomedical Signal Processing and Control · doi:10.1016/j.bspc.2019.101683 · Cited by 72
Cited by
Okelberry, T., Lyons, K. E., & Pahwa, R. (2024) · Parkinsonism & Related Disorders · doi:10.1016/j.parkreldis.2024.106086 · Cited by 46
Explainable AI for Sensor Signal Interpretation to Revolutionize Human Health Monitoring: A Review
Alharthi, A. S., Alqurashi, A., Alharbi, T. E. A., Alammar, M. M., Aldosari, N., Bouchekara, H. R. E. H., Sha’aban, Y. A., Shahriar, M. S., & Ayidh, A. A. (2025) · IEEE Access · doi:10.1109/access.2025.3585764 · Cited by 43
Arnab, S. B., Palash, M. I. A., Islam, R., Ovi, H. H., Yousuf, M. A., & Uddin, M. Z. (2024) · Expert Systems · doi:10.1111/exsy.13790 · Cited by 18
Explainable machine learning for movement disorders - Classification of tremor and myoclonus
van den Brandhof, E. L., Tuitert, I., van der Stouwe, A. M. M., Elting, J. W. J., Dalenberg, J. R., Svoreňová, T., Klamer, M. R., Marapin, R. S., Biehl, M. L., & Tijssen, M. A. J. (2025) · Computers in Biology and Medicine · doi:10.1016/j.compbiomed.2025.110180 · Cited by 13
Teo, Y. X., Lee, R. E., Nurzaman, S. G., Tan, C. P., & Chan, P. Y. (2024) · Computers in Biology and Medicine · doi:10.1016/j.compbiomed.2024.108957 · Cited by 10
Self-citation
Metadata
- Authors
- Lee, R. E., & Chan, P. Y.
- Affiliations
- Monash University Malaysia (MY)
- Corresponding author
- Chan, Ping Yi
- Venue
- Scientific Reports
- Published
- 2023-10-30
- Volume
- 13
- Issue
- 1
- Pages
- 18622-18622
- ISSN
- 2045-2322 (ISSN-L)
- PMC
- PMC10616175
- OpenAlex
- W4388023898
- Cited by
- 13
- References
- 18
- Citations by year
- 2026: 4 · 2025: 4 · 2024: 5
- FWCI
- 1.22
- Type
- journal article
- Language
- en
- Open access
- gold
- doi.org
- Licence
- cc-by
- creativecommons.org/licenses/by/4.0 (tdm)
- creativecommons.org/licenses/by/4.0 (vor)
- Locations
- Scientific Reports (publishedVersion, cc-by)
- PubMed Central (publishedVersion, cc-by)
- PubMed (publishedVersion)
- Monash University Research Portal (Monash University) (submittedVersion, other-oa)
- DOAJ (DOAJ: Directory of Open Access Journals) (submittedVersion, cc-by-sa)
- Topics
- Physical Sciences › Computer Science › Artificial Intelligence › Explainable Artificial Intelligence (XAI)
- Health Sciences › Health Professions › Health Information Management › Artificial Intelligence in Healthcare
- Health Sciences › Medicine › Clinical Neurology › Deep Brain Stimulation and Movement Disorders
- Keywords
- Parkinson's disease, essential tremor, tremor classification, explainable AI, layer-wise relevance propagation, BiLSTM, accelerometry, short-time Fourier transform, frequency bands, differential diagnosis
- MeSH terms
- Artificial Intelligence, Birth Weight, Humans, Parkinson Disease, Tremor, Neural Networks, Computer, Essential Tremor
About these checks
Registry, retraction, Cites and statistics results are computed, not judged, with one exception: a printed reference that no index lists is read once by a model before it counts as a citation error. Claims are extracted by a model and kept only when their quote appears verbatim in the text; each cited source is then checked, with a model’s help, for whether it says what the claim relies on. Those verdicts can be wrong — read the claim’s quote and the cited source before relying on one.
The claim verdicts this report counts are experimental: their accuracy is not yet measured.
A language model drew the claims from the paper on 2026-10-10, under version 3 of the claim definition (model deepseek-v4.1-flash, prompt extract-v3).
A second model labelled each claim on 2026-10-10 (model jev-1.13-20260917, definition revision gold-guideline-v0.2).
Cited sources are checked with a language model’s help (gpt-6-sol).
Statistics and arithmetic are recomputed, not judged.
Confidence bands are shown only for fields calibrated on our annotated test set. None is calibrated yet, so no band is shown.
What counts as a claim ›How we measure confidence ›How we check this ›
Are you an author, or do you see a problem with this page? Request a review
How to cite
Cite CoChat for the checks on this page, and the paper for its own findings.
- This page
- CoChat. (2026). Citation check: Explainable artificial intelligence for searching frequency characteristics in Parkinson's disease tremor. https://app.cochat.ai/papers/10.1038/s41598-023-45802-z
- The paper
- Lee, R. E., & Chan, P. Y. (2023). Explainable artificial intelligence for searching frequency characteristics in Parkinson's disease tremor. Scientific Reports. https://doi.org/10.1038/s41598-023-45802-z
Data sources
Bibliographic data: Semantic Scholar, OpenAlex, Crossref.
Contains information from the Semantic Scholar Academic Graph Datasets, made available under the ODC Attribution License (ODC-BY 1.0).
Semantic Scholar’s data is described in: Kinney, R., et al. (2023). The Semantic Scholar Open Data Platform. arXiv:2301.10140.
