

The DOI matches its Crossref record; 58 of the 58 references it cites were found in a registry or an index.
Spatially-informed interpolation for reconstructing lake area time series using semantic neighborhood correlation
Open accessPublished version of a preprint
Abstract
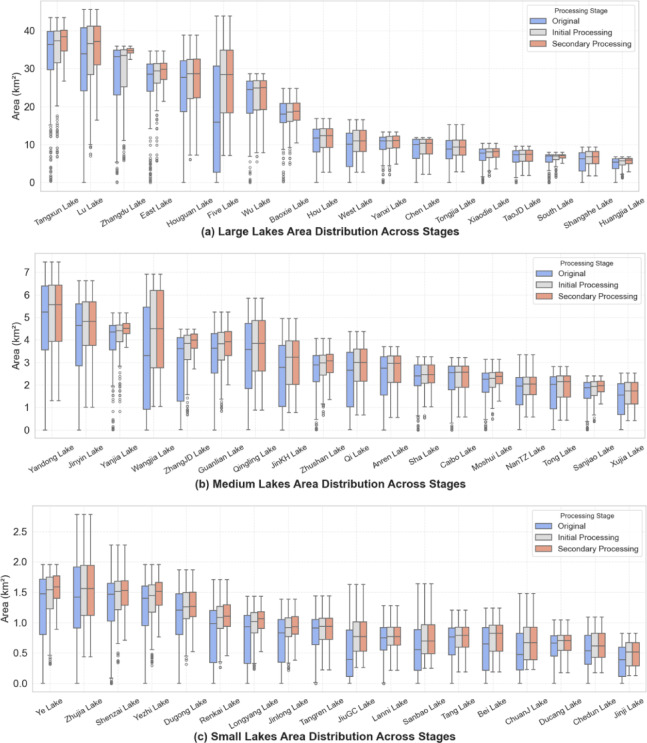
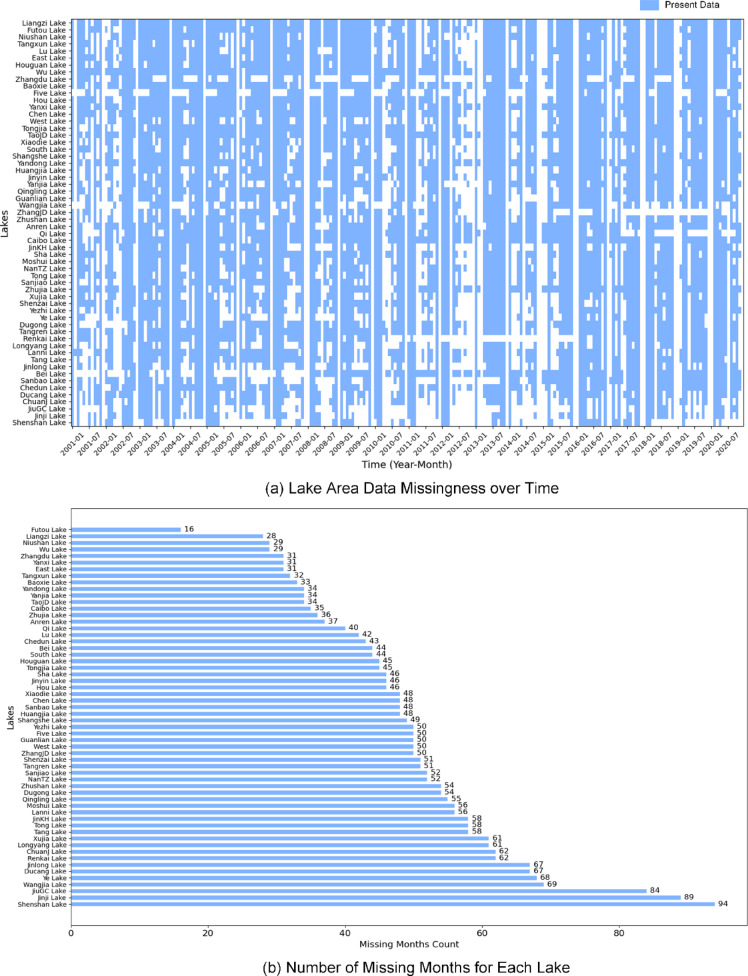
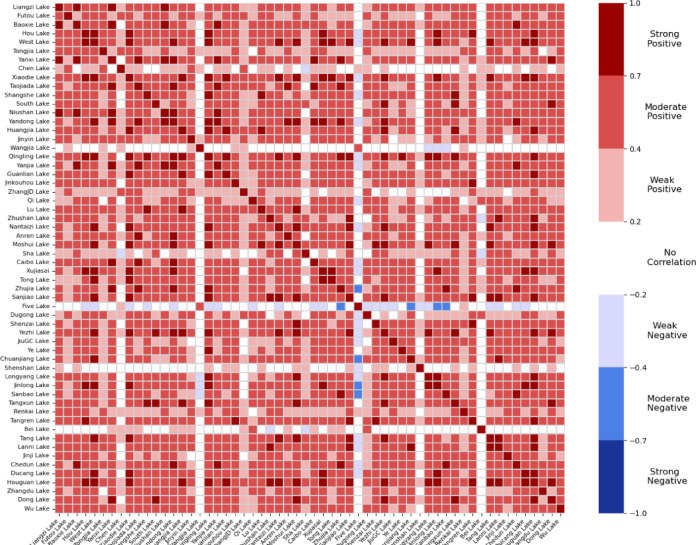
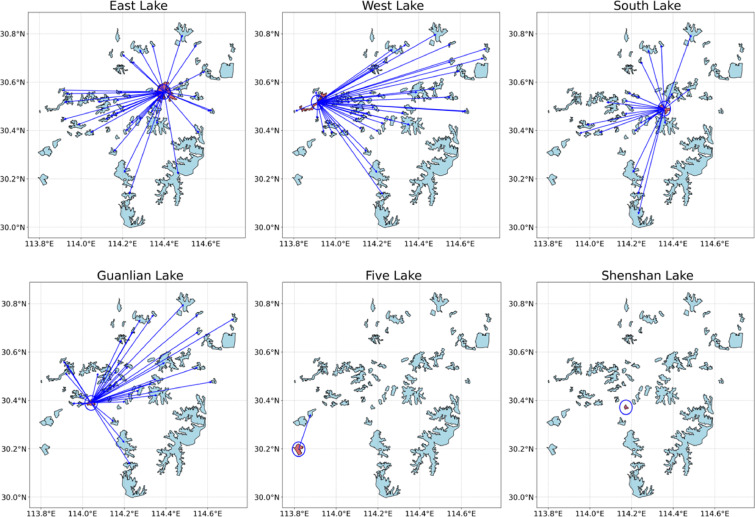
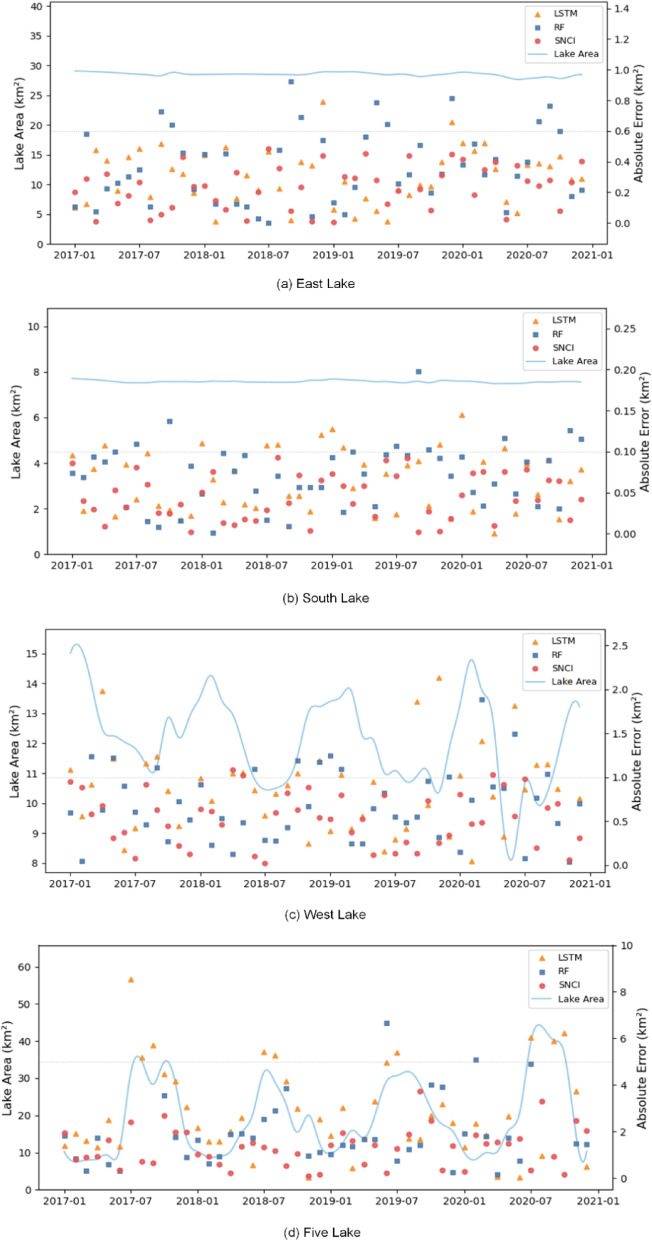
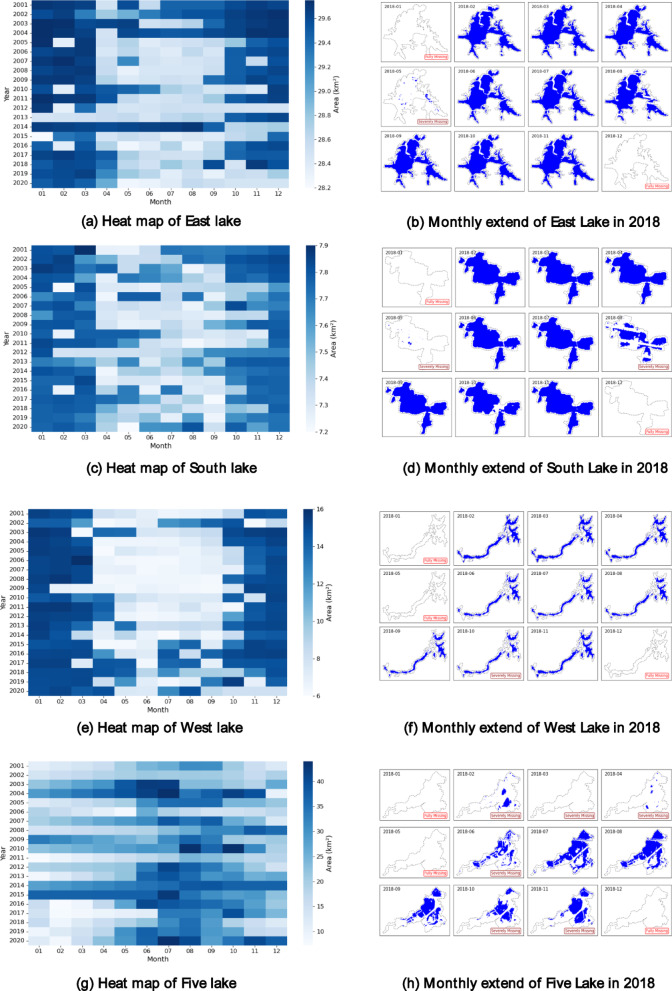
Long-term, high-resolution records of lake surface area are essential for characterizing the spatiotemporal dynamics of inland water bodies. Although Synthetic Aperture Radar has substantially improved water extent detection under adverse conditions, optical remote sensing imagery remains the dominant data source owing to its higher spatial resolution. Nevertheless, optical data are frequently compromised by persistent cloud cover and sensor limitations, leading to substantial observational gaps. To effectively address this challenge, this study introduces a novel spatially-informed interpolation method termed Semantic Neighborhood Correlation-based Interpolation (SNCI), which leverages spatial correlations among hydrologically interconnected lakes to reconstruct missing lake area observations. By explicitly modeling the inherent hydrological and climatic coherence among neighboring lakes, SNCI provides robust, accurate, and scalable interpolations even in the presence of extensive temporal data losses. The method was evaluated on monthly lake area data from 54 lakes in the Wuhan region between 2000 and 2020, using the Global Surface Water dataset, and validated against high-resolution Dynamic World observations. Several representative lakes were analyzed in detail to assess SNCI’s robustness across diverse seasonal and interannual conditions. Compared with polynomial fitting, Random Forest, and Long Short-Term Memory, SNCI consistently achieves lower interpolation errors. In the case of East Lake, SNCI reduces mean absolute error by 50.1% and root mean square error by 28.3% relative to the best-performing baseline. Across all lakes, SNCI demonstrates superior accuracy and correlation, particularly under data-sparse conditions. These results underscore SNCI’s potential to enhance lake area reconstruction accuracy and support broader applications in hydrological modeling, environmental monitoring, and climate impact assessment.
Overview
The claims and statistics of this paper haven’t been checked yet.
Run the check — free, no account needed. It reads the open-access text and checks the sources it cites.
Integrity signals
Registry
Cites
Statistics
Figures
Verification
Claims the paper makes
The claims and statistics of this paper haven’t been checked yet.
Run the check — free, no account needed. It reads the open-access text and checks the sources it cites.
Self-check
Percentages, sums and reported differences re-computed from the paper’s own numbers.
The self-check needs the paper’s full text.
Citations
Cites
Google Earth Engine: Planetary-scale geospatial analysis for everyone
Gorelick, N., Hancher, M., Dixon, M., Ilyushchenko, S., Thau, D., & Moore, R. (2017) · Remote Sensing of Environment · doi:10.1016/j.rse.2017.06.031 · Cited by 14,719
A Comprehensive Survey on Graph Neural Networks
Wu, Z., Pan, S., Chen, F., Long, G., Zhang, C., & Yu, P. S. (2021) · IEEE Transactions on Neural Networks and Learning Systems · doi:10.1109/tnnls.2020.2978386 · Cited by 11,000
Ecological and Evolutionary Responses to Recent Climate Change
Parmesan, C. (2006) · Annual Review of Ecology, Evolution, and Systematics · doi:10.1146/annurev.ecolsys.37.091305.110100 · Cited by 8,652
Greff, K., Srivastava, R. K., Koutnik, J., Steunebrink, B. R., & Schmidhuber, J. (2017) · IEEE Transactions on Neural Networks and Learning Systems · doi:10.1109/tnnls.2016.2582924 · Cited by 6,955
High-resolution mapping of global surface water and its long-term changes
Pekel, J.-F., Cottam, A., Gorelick, N., & Belward, A. S. (2016) · Nature · doi:10.1038/nature20584 · Cited by 5,513
Pearson Correlation Coefficient
Benesty, J., Chen, J., Huang, Y. A., & Cohen, I. (2009) · Springer topics in signal processing · doi:10.1007/978-3-642-00296-0_5 · Cited by 3,540
A Comprehensive Survey on Graph Neural Networks
Wu, Z., Pan, S., Chen, F., Long, G., Zhang, C., & Yu, P. (2020) · UTS ePRESS (University of Technology Sydney) · Cited by 3,174
Ground water and climate change
Taylor, R. G., Scanlon, B. R., Döll, P., Rodell, M., van Beek, R., Wada, Y., Longuevergne, L., Leblanc, M. J., Famiglietti, J. S., Edmunds, M., et al. (2012) · Nature Climate Change · doi:10.1038/nclimate1744 · Cited by 2,786
Kriging: a method of interpolation for geographical information systems
Oliver, M. A., & Webster, R. (1990) · International Journal of Geographical Information Systems · doi:10.1080/02693799008941549 · Cited by 2,275
Temporal Convolutional Networks for Action Segmentation and Detection
Lea, C., Flynn, M. D., Vidal, R., Reiter, A., & Hager, G. D. (2017) · 2017 IEEE Conference on Computer Vision and Pattern Recognition (CVPR) · doi:10.1109/cvpr.2017.113 · Cited by 2,238
Metadata
- Authors
- Liu, C.
- Affiliations
- Wuhan University (CN)
- Corresponding author
- Liu, Chen
- ORCID
- Liu, Chen
- Venue
- Scientific Reports
- Published
- 2025-07-09
- Volume
- 15
- Issue
- 1
- Pages
- 24787-24787
- ISSN
- 2045-2322 (ISSN-L)
- PMC
- PMC12241530
- OpenAlex
- W4412177594
- Cited by
- 1
- References
- 58
- Citations by year
- 2026: 1
- FWCI
- 0.25
- Type
- journal article
- Language
- en
- Open access
- gold
- doi.org
- Licence
- cc-by
- creativecommons.org/licenses/by/4.0 (tdm)
- creativecommons.org/licenses/by/4.0 (vor)
- Locations
- Scientific Reports (publishedVersion, cc-by)
- Research Square (acceptedVersion, cc-by)
- Europe PMC (PubMed Central) (publishedVersion, cc-by)
- PubMed Central (publishedVersion, cc-by)
- PubMed (publishedVersion)
- DOAJ (DOAJ: Directory of Open Access Journals) (submittedVersion, cc-by-sa)
- Topics
- Physical Sciences › Environmental Science › Water Science and Technology › Hydrology and Watershed Management Studies
- Physical Sciences › Environmental Science › Environmental Engineering › Hydrological Forecasting Using AI
- Physical Sciences › Environmental Science › Management, Monitoring, Policy and Law › Environmental Monitoring and Data Management
- Keywords
- missing data interpolation, surface water extent, Global Surface Water dataset, Dynamic World, East Lake
About these checks
Registry, retraction, Cites and statistics results are computed, not judged, with one exception: a printed reference that no index lists is read once by a model before it counts as a citation error. Claims are extracted by a model and kept only when their quote appears verbatim in the text; each cited source is then checked, with a model’s help, for whether it says what the claim relies on. Those verdicts can be wrong — read the claim’s quote and the cited source before relying on one.
Statistics and arithmetic are recomputed, not judged.
Confidence bands are shown only for fields calibrated on our annotated test set. None is calibrated yet, so no band is shown.
What counts as a claim ›How we measure confidence ›How we check this ›
Are you an author, or do you see a problem with this page? Request a review
How to cite
Cite CoChat for the checks on this page, and the paper for its own findings.
- This page
- CoChat. (2026). Citation check: Spatially-informed interpolation for reconstructing lake area time series using semantic neighborhood correlation. https://app.cochat.ai/papers/10.1038/s41598-025-09410-3
- The paper
- Liu, C. (2025). Spatially-informed interpolation for reconstructing lake area time series using semantic neighborhood correlation. Scientific Reports. https://doi.org/10.1038/s41598-025-09410-3
Data sources
Bibliographic data: Semantic Scholar, OpenAlex, Crossref.
Contains information from the Semantic Scholar Academic Graph Datasets, made available under the ODC Attribution License (ODC-BY 1.0).
Semantic Scholar’s data is described in: Kinney, R., et al. (2023). The Semantic Scholar Open Data Platform. arXiv:2301.10140.
