

The DOI matches its Crossref record; the references it cites are not checked yet.
Comparative study of palmitoleic acid, sea buckthorn oil, and lovastatin in hepatocellular steatosis model
Open accessAbstract
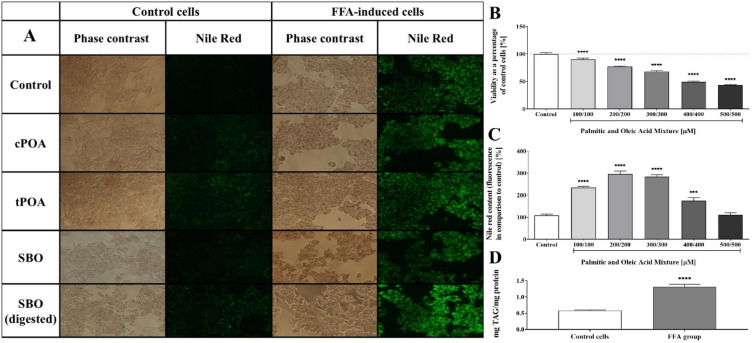
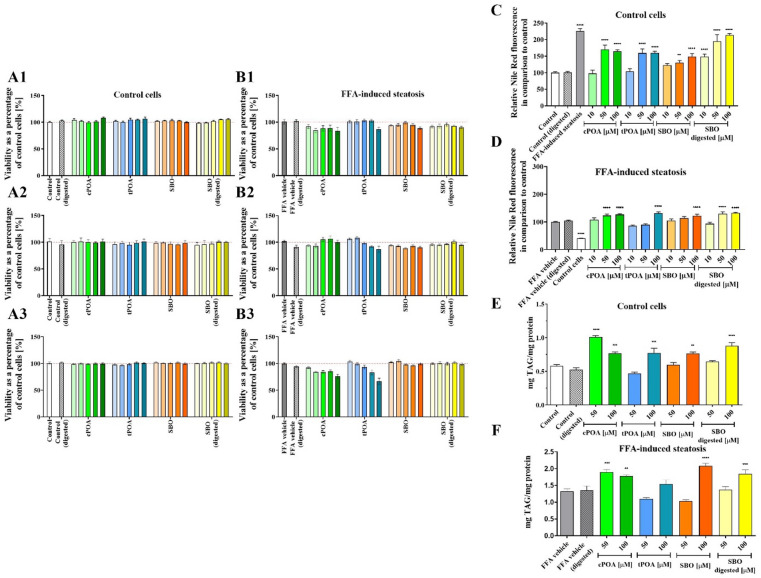
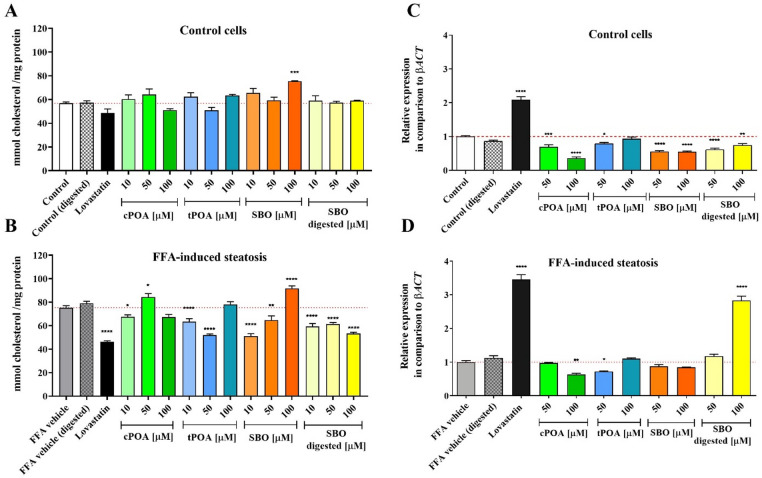
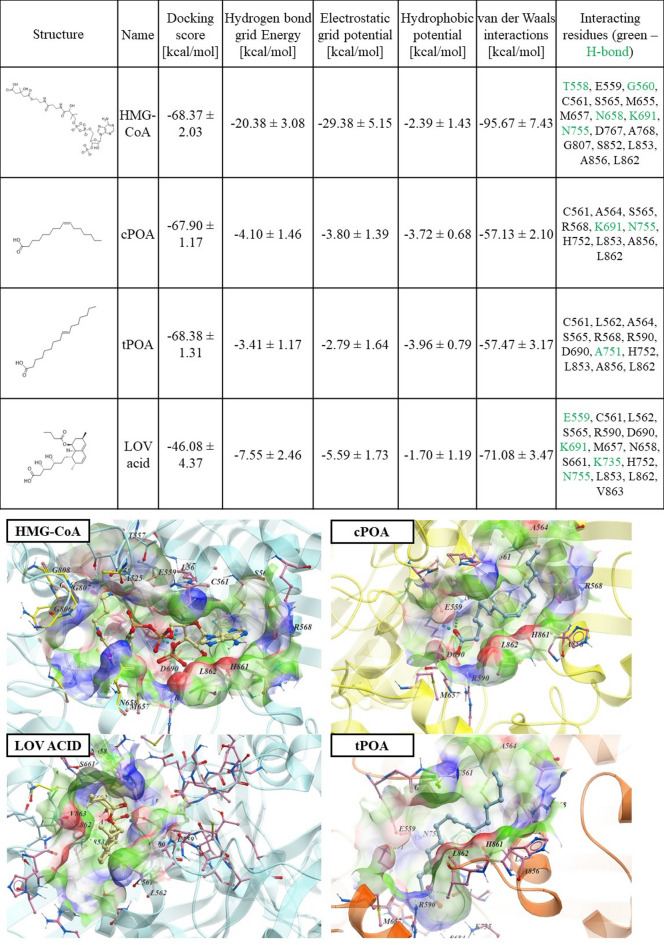
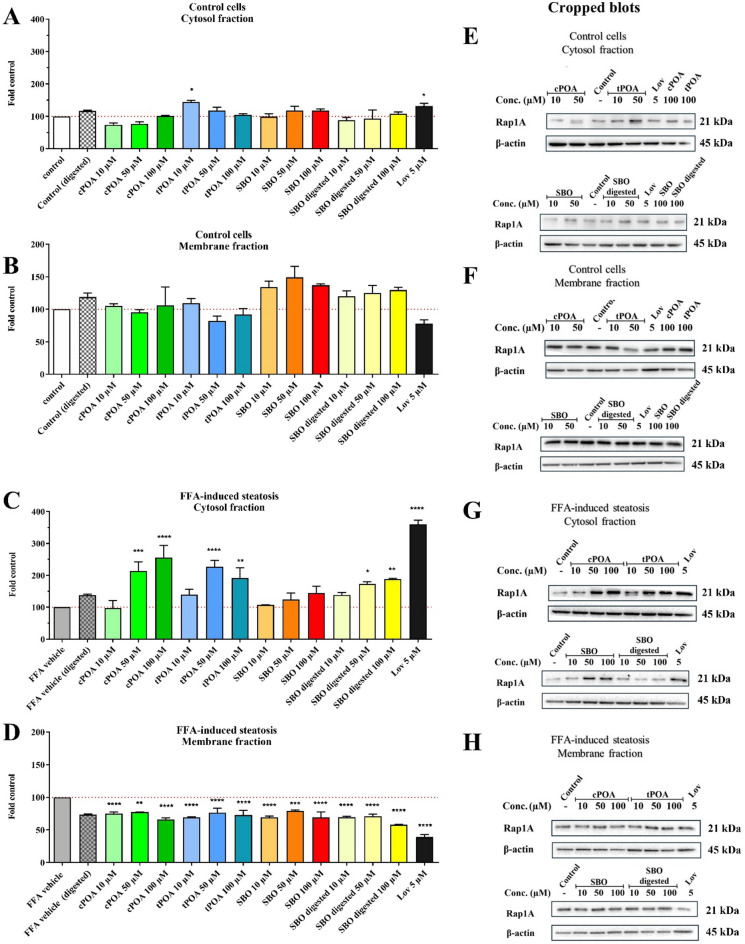
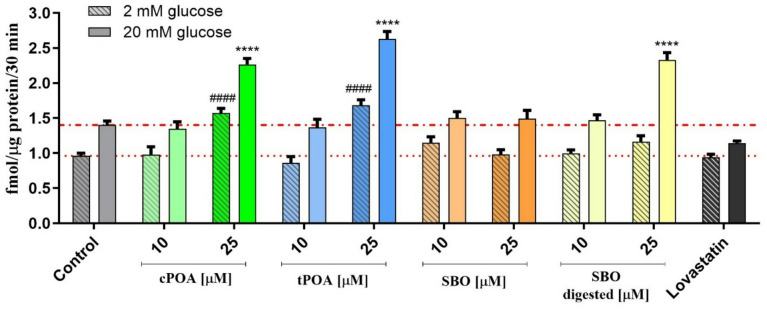
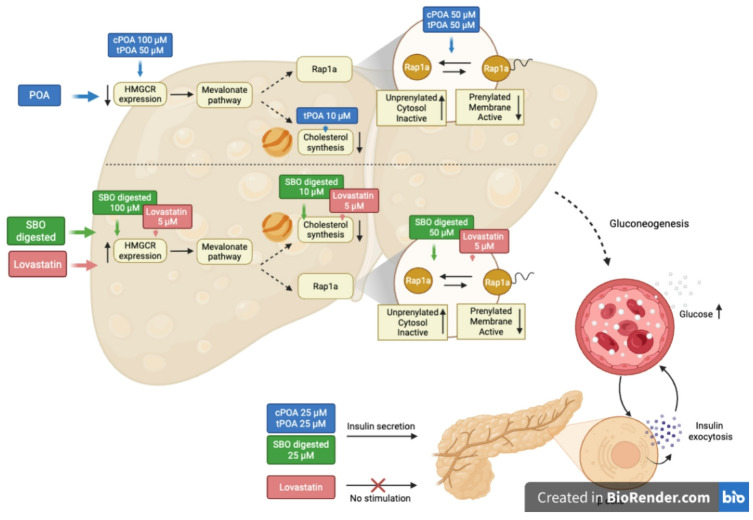
Palmitoleic acid (POA) has been associated with various metabolic effects, including regulating lipid metabolism and cholesterol production. In this study, we explored the impact of both cis - (cPOA) and trans -palmitoleic acid (tPOA), along with sea buckthorn oil (SBO), a natural source rich in cPOA, on lipid content, metabolic activity, and Rap1 prenylation in HepG2 cells. We employed a free fatty acids-induced steatosis model. Our findings revealed that neither cPOA, tPOA, SBO, nor digested SBO impaired the metabolic activity of HepG2 cells, even under steatotic conditions. All treatments led to triacylglycerol (TAG) accumulation, with tPOA demonstrating the beneficial effect. While cholesterol levels remained unchanged in normal cells, a reduction was noted in steatotic cells, comparable to the effect of lovastatin. Molecular docking suggested that both POA isomers may bind and block the catalytic pocket of 3-hydroxy-3-methylglutaryl coenzyme A reductase (HMGCR). To further explore this, we examined their influence on Rap1 prenylation and subcellular localization. Under steatotic conditions, both POA isomers, particularly at concentrations of 50 and 100 µM, elevated cytosolic Rap1 levels, whereas no significant changes were observed in membrane or cytosolic Rap1a protein levels in normal HepG2 cultures. Notably, unlike lovastatin, POA isomers and digested SBO enhanced glucose-stimulated insulin secretion from pancreatic cells. Our results highlight the potential of POA isomers and SBO as modulators of lipid metabolism, cholesterol production, and insulin secretion, suggesting their relevance in managing metabolic disorders.
Overview
The claims and statistics of this paper haven’t been checked yet.
Run the check — free, no account needed. It reads the open-access text and checks the sources it cites.
Integrity signals
Registry
Cites
Statistics
Figures
Verification
Claims the paper makes
The claims and statistics of this paper haven’t been checked yet.
Run the check — free, no account needed. It reads the open-access text and checks the sources it cites.
Claims other papers make about this one
Each is checked against this paper’s own text: does it say what the citing paper says it does?
The source backs part of the claim, not all of it — or backs it for a different population, condition or comparison.
In the citing paper
“Thus, in HepG2 cells, treatment with OA at concentrations of 0.125–0.25 mM induces significant triglyceride accumulation without a decrease in viability, whereas concentrations ≥ 0.5 mM already exhibit signs of toxicity [126,128,156].”
From The HepG2 Cell Line as a Model for Studying Metabolic Dysfunction-Associated Steatotic Liver Disease (2026) · cites this paper as [156]
Experimental — accuracy not yet measured
Self-check
Percentages, sums and reported differences re-computed from the paper’s own numbers.
The self-check needs the paper’s full text.
Citations
The citation lists are queued
They are fetched later and appear here then.
References 50 · Cited by 5
Research works printed but not linked: 50
- Rinella, M. E. & Sookoian, S. From NAFLD to MASLD: updated naming and diagnosis criteria for fatty liver disease. J. Lipid Res. 65, 100485 (2024). · DOI · Paper page
- Portincasa, P. et al. Metabolic Dysfunction–Associated steatotic liver disease: from pathogenesis to current therapeutic options. Int. J. Mol. Sci. 25, 5640 (2024). · DOI
- Mocciaro, G. et al. Non-alcoholic fatty liver disease is characterised by a reduced polyunsaturated fatty acid transport via free fatty acids and high-density lipoproteins (HDL). Mol. Metab. 73, 101728 (2023). · DOI
- Min, H. K. et al. Increased hepatic synthesis and dysregulation of cholesterol metabolism is associated with the severity of nonalcoholic fatty liver disease. Cell. Metab. 15, 665–674 (2012). · DOI
- Souza, C. O. et al. Palmitoleic acid reduces high fat diet-induced liver inflammation by promoting PPAR-γ-independent M2a polarization of myeloid cells. Biochim. Biophys. Acta Mol. Cell. Biol. Lipids. 1865, 158776–158776 (2020). · DOI
- Hodson, L., Skeaff, C. M. & Fielding, B. A. Fatty acid composition of adipose tissue and blood in humans and its use as a biomarker of dietary intake. Prog Lipid Res. 47, 348–380 (2008). · DOI
- Chen, Y., Cai, Y., Wang, K. & Wang, Y. Bioactive Compounds in Sea Buckthorn and their Efficacy in Preventing and Treating Metabolic Syndrome. Foods vol. 12 Preprint at (2023). https://doi.org/10.3390/foods12101985 · DOI
- Liu, J. et al. Superfruits in China: Bioactive phytochemicals and their potential health benefits – A Review. Food Science and Nutrition 9 6892–6902 Preprint at (2021). https://doi.org/10.1002/fsn3.2614 · DOI
- Destaillats, F., Wolff, R. L., Precht, D. & Molkentin, J. Study of individual trans- and cis-16:1 isomers in cow, goat, and Ewe cheese fats by gas-liquid chromatography with emphasis on the trans-delta3 isomer. Lipids 35, 1027–1032 (2000). · DOI
- Guillocheau, E. et al. Current intakes of trans-palmitoleic (trans-C16:1 n-7) and trans-vaccenic (trans-C18:1 n-7) acids in France are exclusively ensured by ruminant milk and ruminant meat: A market basket investigation. Food Chem. X. 5, 100081 (2020). · DOI
- Mozaffarian, D. et al. Trans-palmitoleic acid, metabolic risk factors, and new-onset diabetes in U.S. Adults: a cohort study. Ann. Intern. Med. 153, 790–799 (2010). · DOI · Paper page
- Huang, W. W. et al. Cis- and Trans-Palmitoleic acid isomers regulate cholesterol metabolism in different ways. Front. Pharmacol. 11, 602115 (2020). · DOI
- Guo, X. et al. The Role of Palmitoleic Acid in Regulating Hepatic Gluconeogenesis through SIRT3 in Obese Mice. Nutrients 14, (2022). · DOI
- Chávaro-Ortiz, L. I., Tapia, B. D., Rico-Hidalgo, M., Gutiérrez-Aguilar, R. & Frigolet, M. E. Trans-palmitoleic acid reduces adiposity via increased lipolysis in a rodent model of diet-induced obesity. Br. J. Nutr. 127, 801–809 (2022). · DOI
- Lee, J. J. et al. Palmitoleic acid is elevated in fatty liver disease and reflects hepatic lipogenesis. Am. J. Clin. Nutr. 101, 34–43 (2015). · DOI
- Korkus, E. et al. Trans-palmitoleic acid, a dairy fat biomarker, stimulates insulin secretion and activates G protein-coupled receptors with a different mechanism from the Cis isomer. Food Funct. 14, 6496–6512 (2023). · DOI
- Nogueira, J. P. & Cusi, K. Role of insulin resistance in the development of nonalcoholic fatty liver disease in people with type 2 diabetes: from bench to patient care. Diabetes Spectr. 37, 20–28 (2024). · DOI
- Dąbrowski, G. et al. Composition of flesh lipids and oleosome yield optimization of selected sea Buckthorn (Hippophae rhamnoides L.) cultivars grown in Poland. Food Chem. 369, 130921 (2022). · DOI
- Müller, F. A. & Sturla, S. J. Human in vitro models of nonalcoholic fatty liver disease. Curr. Opin. Toxicol. 16, 9–16 (2019). · DOI · Paper page
- Moravcová, A. et al. The effect of oleic and palmitic acid on induction of steatosis and cytotoxicity on rat hepatocytes in primary culture. Physiol. Res. 64, S627–S636 (2015). · DOI
- Rida, R. & Kreydiyyeh, S. Effect of FTY720P on lipid accumulation in HEPG2 cells. Scientific Reports 2023 13:1 13, 1–15 (2023). · DOI · Paper page
- Donato, M. T. et al. Effects of steatosis on drug-metabolizing capability of primary human hepatocytes. Toxicol. In Vitro. 21, 271–276 (2007). · DOI
- Korkus, E. et al. Evaluation of the anti-diabetic activity of sea Buckthorn pulp oils prepared with different extraction methods in human islet EndoC-betaH1 cells. NFS J. 27, 54–66 (2022). · DOI
- Istvan, E. S. & Deisenhofer, J. Structural mechanism for Statin Inhibition of HMG-CoA reductase. Sci. (1979). 292, 1160–1164 (2001).
- Moghadasian, M. H. Clinical Pharmacology of 3-hydroxy-3-methylglutaryl coenzyme A reductase inhibitors. Life Sci. 65, 1329–1337 (1999). · DOI
- Istvan, E. S., Palnitkar, M., Buchanan, S. K. & Deisenhofer, J. Crystal structure of the catalytic portion of human HMG-CoA reductase: insights into regulation of activity and catalysis. EMBO J. 19, 819–830 (2000). · DOI
- Wang, Y., Spolitu, S., Zadroga, J. A., Sarecha, A. K. & Ozcan, L. Hepatocyte Rap1a contributes to obesity- and statin-associated hyperglycemia. Cell. Rep. 40, 111259 (2022). · DOI
- Kusy, D. et al. Synthesis of the 6-Substituted Imidazo[1,2-a]Pyridine-3-yl-2- phosphonopropionic acids as potential inhibitors of Rab geranylgeranyl transferase. Front. Chem. 8, 596162 (2021). · DOI
- Vuille-Lessard, É., Lange, N., Riebensahm, C., Dufour, J. F. & Berzigotti, A. Dietary Interventions in Liver Diseases: Focus on MAFLD and Cirrhosis. (1901). https://doi.org/10.1007/s11901-021-00563-z · DOI
- Notarnicola, M. et al. Synergic effect of eicosapentaenoic acid and Lovastatin on gene expression of HMGCoA reductase and LDL receptor in cultured HepG2 cells. Lipids Health Dis. 9, 135 (2010). · DOI
- Cruz, M. M. et al. Palmitoleic acid decreases Non-alcoholic hepatic steatosis and increases lipogenesis and fatty acid oxidation in adipose tissue from obese mice. Front. Endocrinol. (Lausanne). 11, 537061 (2020). · DOI
- Yang, Z. H., Miyahara, H. & Hatanaka, A. Chronic administration of palmitoleic acid reduces insulin resistance and hepatic lipid accumulation in KK-Ay mice with genetic type 2 diabetes. Lipids Health Dis. 10, 120 (2011). · DOI
- Farokh Nezhad, R., Nourbakhsh, M., Razzaghy-Azar, M., Sharifi, R. & Yaghmaei, P. The effect of trans-palmitoleic acid on cell viability and Sirtuin 1 gene expression in hepatocytes and the activity of peroxisome-proliferator-activated receptor-alpha. J. Res. Med. Sci. 25, 105 (2020). · DOI
- Duan, Y. et al. Regulation of cholesterol homeostasis in health and diseases: from mechanisms to targeted therapeutics. Signal Transduction and Targeted Therapy 7, 1–29 (2022). (2022). · DOI · Paper page
- Ishikawa, T. et al. Concomitant Attenuation of HMG-CoA reductase expression potentiates the cancer cell growth-inhibitory effect of Statins and expands their efficacy in tumor cells with epithelial characteristics. Oncotarget 9, 29304–29315 (2018). · DOI
- Trub, A. G. et al. Statin therapy inhibits fatty acid synthase via dynamic protein modifications. Nat. Commun. 13, 2542 (2022). · DOI
- Natali, F., Siculella, L., Salvati, S. & Gnoni, G. V. Oleic acid is a potent inhibitor of fatty acid and cholesterol synthesis in C6 glioma cells. J. Lipid Res. 48, 1966–1975 (2007). · DOI
- Notarnicola, M. et al. Polyunsaturated fatty acids reduce fatty acid synthase and Hydroxy-Methyl-Glutaryl CoA-Reductase gene expression and promote apoptosis in HepG2 cell line. Lipids Health Dis. 10, 10 (2011). · DOI
- DeBose-Boyd, R. A. & Ye, J. SREBPs in Lipid Metabolism, Insulin Signaling, and Beyond. Trends in Biochemical Sciences 43 358–368 Preprint at (2018). https://doi.org/10.1016/j.tibs.2018.01.005 · DOI
- Wu, N. et al. Activation of 3-hydroxy-3-methylglutaryl coenzyme A (HMG-CoA) reductase during high fat diet feeding. Biochim. Biophys. Acta Mol. Basis Dis. 1832, 1560–1568 (2013). · DOI
- Marchwicka, A., Kamińska, D., Monirialamdari, M., Błażewska, K. M. & Gendaszewska-Darmach, E. Protein prenyltransferases and their inhibitors: structural and functional characterization. Int. J. Mol. Sci. https://doi.org/10.3390/ijms23105424 (2022). 23 Preprint at. · DOI
- Spolitu, S. et al. Hepatic glucagon signaling regulates PCSK9 and Low-Density lipoprotein cholesterol. Circ. Res. 124, 38–51 (2019). · DOI · Paper page
- Taylor, B. A. & Thompson, P. D. Statins and their effect on PCSK9-Impact and clinical relevance. Curr. Atheroscler Rep. 18, 46–46 (2016). · DOI
- Wu, J., Wong, W. L., Khosravi, F., Minden, M. D. & Penn, L. Z. Blocking the Raf/MEK/ERK pathway sensitizes acute myelogenous leukemia cells to Lovastatin-Induced apoptosis. Cancer Res. 64 (18), 6461–6468 (2004). http://www.stanford.edu/group/nolan/protocols/pro_optimiz.html · DOI
- Jaśkiewicz, A., Pajką, B. & Orzechowski, A. The many faces of Rap1 GTPase. Int. J. Mol. Sci. 19 (10), 2848 (2018). · DOI
- Hao, M., Head, W. S., Gunawardana, S. C., Hasty, A. H. & Piston, D. W. Direct effect of cholesterol on insulin secretiona novel mechanism for pancreatic β-Cell dysfunction. Diabetes 56, 2328–2338 (2007). · DOI
- Hao, M. & Bogan, J. S. Cholesterol regulates Glucose-stimulated insulin secretion through phosphatidylinositol 4,5-Bisphosphate. J. Biol. Chem. 284, 29489 (2009). · DOI
- Korkus, E. et al. The insulinotropic activity of oleosomes prepared from various sea Buckthorn cultivars in mouse and human pancreatic β cell lines. NFS J. 31, 142–154 (2023). · DOI
- Miyazaki, J. I. et al. Establishment of a pancreatic beta cell line that retains glucose-inducible insulin secretion: special reference to expression of glucose transporter isoforms. Endocrinology 127, 126–132 (1990). · DOI
- Livak, K. J. & Schmittgen, T. D. Analysis of relative gene expression data using real-time quantitative PCR and the 2(-Delta delta C(T)) method. Methods 25, 402–408 (2001). · DOI · Paper page
Metadata
- Authors
- Szustak, M., Pichlak, M., Korkus, E., Kamińska, D., Koziołkiewicz, M., Dąbrowski, G., Czaplicki, S., Konopka, I., & Gendaszewska-Darmach, E.
- Affiliations
- Lodz University of Technology (PL)
- University of Warmia and Mazury in Olsztyn (PL)
- ORCID
- Venue
- Scientific Reports
- Published
- 2026-01-24
- Volume
- 16
- Issue
- 1
- Pages
- 6135-6135
- ISSN
- 2045-2322 (ISSN-L)
- PMC
- PMC12902076
- OpenAlex
- W7125596720
- Cited by
- 5
- References
- 50
- Citations by year
- 2026: 5
- FWCI
- 52.97
- Type
- journal article
- Language
- en
- Open access
- gold
- doi.org
- Licence
- Locations
- Scientific Reports (publishedVersion, cc-by)
- Europe PMC (PubMed Central) (publishedVersion, cc-by)
- PubMed (publishedVersion)
- PubMed Central (publishedVersion, cc-by)
- DOAJ (DOAJ: Directory of Open Access Journals) (submittedVersion, cc-by-sa)
- Funders
- The National Science Centre, Poland (2018/31/B/NZ9/02433)
- Topics
- Health Sciences › Medicine › Complementary and alternative medicine › Phytochemical and Pharmacological Studies
- Life Sciences › Biochemistry, Genetics and Molecular Biology › Biochemistry › Cholesterol and Lipid Metabolism
- Health Sciences › Medicine › Hepatology › Liver Disease Diagnosis and Treatment
- Keywords
- palmitoleic acid, trans-palmitoleic acid, sea buckthorn oil, lovastatin, HepG2 cells, triglyceride accumulation, cholesterol, HMGCR, HMGR, glucose-stimulated insulin secretion, lipid metabolism, insulin secretion
- MeSH terms
- Cholesterol, Fatty Acids, Monounsaturated, Fatty Liver, Humans, Hydroxymethylglutaryl CoA Reductases, Lovastatin, Plant Oils, Triglycerides, Hippophae, Lipid Metabolism, Hep G2 Cells, Molecular Docking Simulation
About these checks
Registry, retraction, Cites and statistics results are computed, not judged, with one exception: a printed reference that no index lists is read once by a model before it counts as a citation error. Claims are extracted by a model and kept only when their quote appears verbatim in the text; each cited source is then checked, with a model’s help, for whether it says what the claim relies on. Those verdicts can be wrong — read the claim’s quote and the cited source before relying on one.
Statistics and arithmetic are recomputed, not judged.
Confidence bands are shown only for fields calibrated on our annotated test set. None is calibrated yet, so no band is shown.
What counts as a claim ›How we measure confidence ›How we check this ›
Are you an author, or do you see a problem with this page? Request a review
How to cite
Cite CoChat for the checks on this page, and the paper for its own findings.
- This page
- CoChat. (2026). Citation check: Comparative study of palmitoleic acid, sea buckthorn oil, and lovastatin in hepatocellular steatosis model. https://app.cochat.ai/papers/10.1038/s41598-026-37006-y
- The paper
- Szustak, M., Pichlak, M., Korkus, E., Kamińska, D., Koziołkiewicz, M., Dąbrowski, G., Czaplicki, S., Konopka, I., & Gendaszewska-Darmach, E. (2026). Comparative study of palmitoleic acid, sea buckthorn oil, and lovastatin in hepatocellular steatosis model. Scientific Reports. https://doi.org/10.1038/s41598-026-37006-y
