

The DOI matches its Crossref record; 36 of the 36 references it cites were found in a registry or an index.
Deep echocardiography: data-efficient supervised and semi-supervised deep learning towards automated diagnosis of cardiac disease
Open accessAbstract
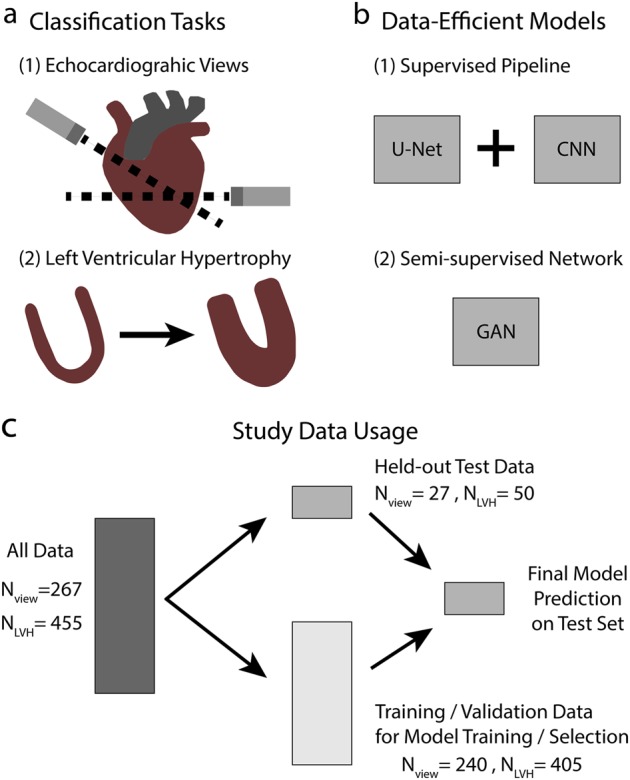
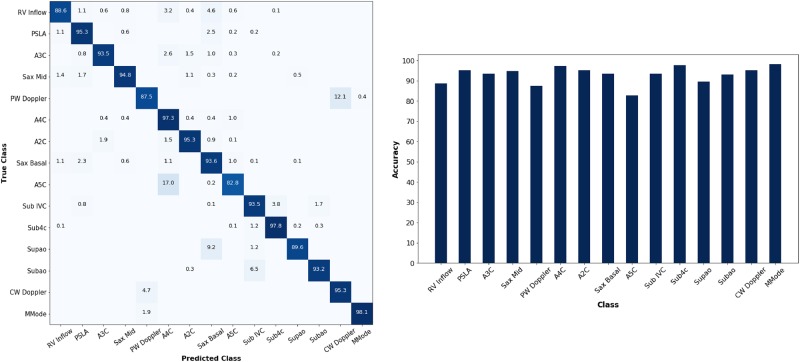
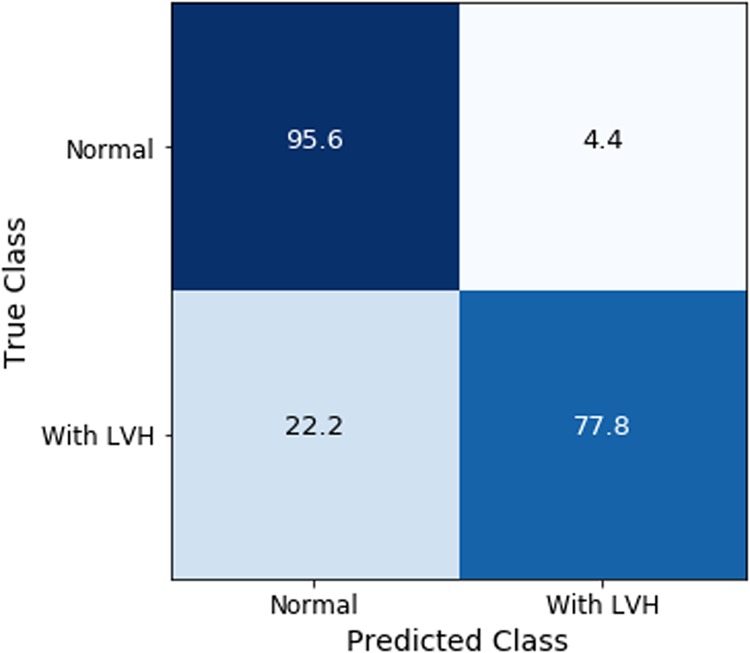
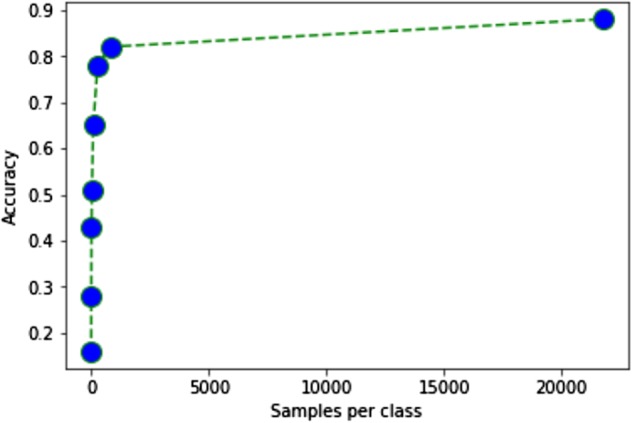
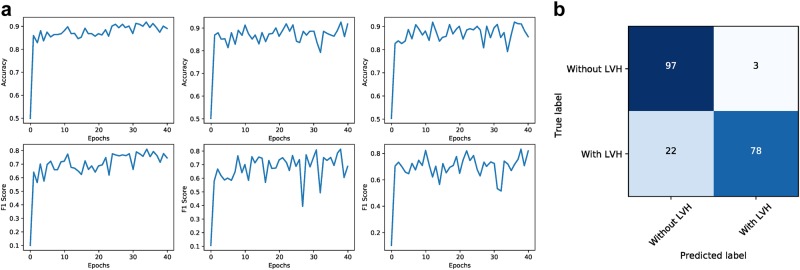
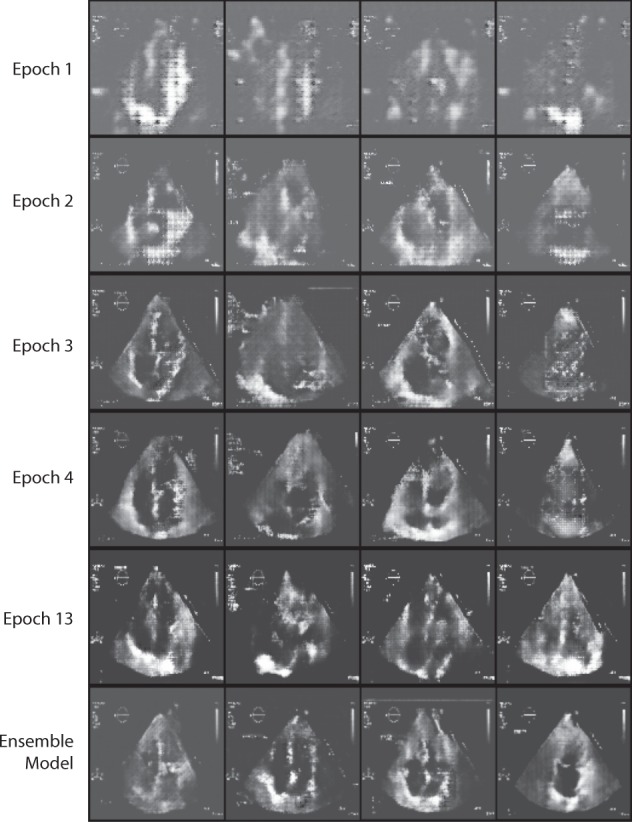
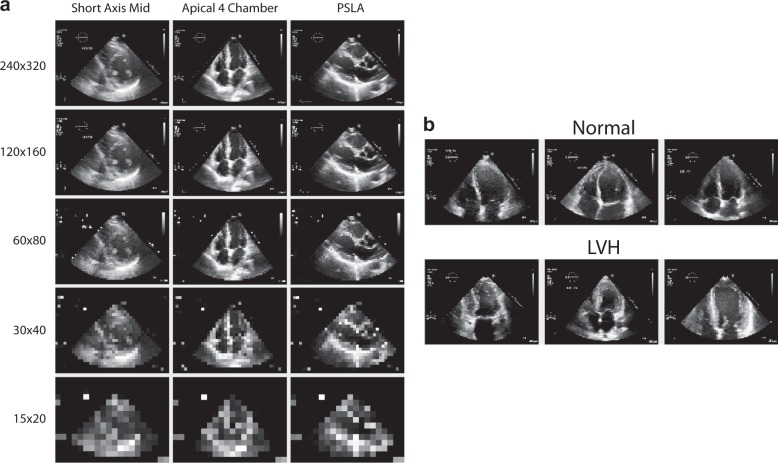
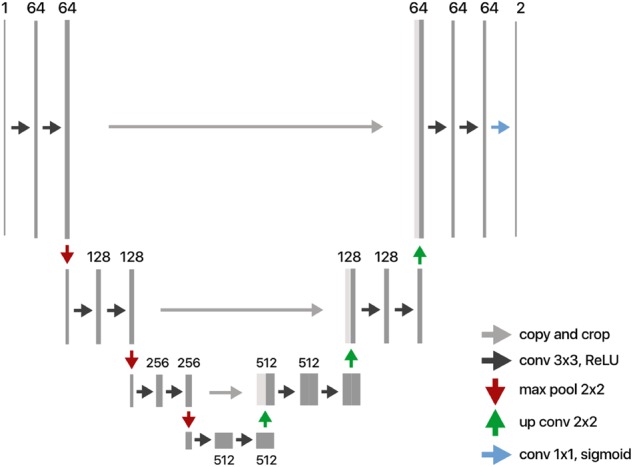
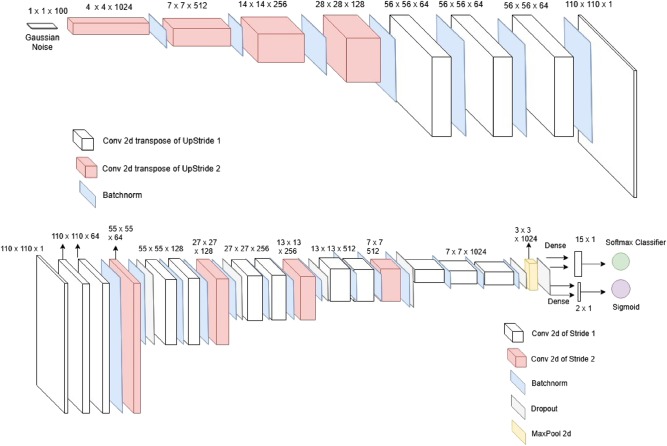
Deep learning and computer vision algorithms can deliver highly accurate and automated interpretation of medical imaging to augment and assist clinicians. However, medical imaging presents uniquely pertinent obstacles such as a lack of accessible data or a high-cost of annotation. To address this, we developed data-efficient deep learning classifiers for prediction tasks in cardiology. Using pipeline supervised models to focus relevant structures, we achieve an accuracy of 94.4% for 15-view still-image echocardiographic view classification and 91.2% accuracy for binary left ventricular hypertrophy classification. We then develop semi-supervised generative adversarial network models that can learn from both labeled and unlabeled data in a generalizable fashion. We achieve greater than 80% accuracy in view classification with only 4% of labeled data used in solely supervised techniques and achieve 92.3% accuracy for left ventricular hypertrophy classification. In exploring trade-offs between model type, resolution, data resources, and performance, we present a comprehensive analysis and improvements of efficient deep learning solutions for medical imaging assessment especially in cardiology.
Overview
The claims and statistics of this paper haven’t been checked yet.
Free: it reads the open-access text and checks the first 5 claims that cite a source we can check. Create a free account to check every claim.
Integrity signals
Registry
Cites
Statistics
Figures

Verification
Claims the paper makes
The claims and statistics of this paper haven’t been checked yet.
Free: it reads the open-access text and checks the first 5 claims that cite a source we can check. Create a free account to check every claim.
Claims other papers make about this one
Each is checked against this paper’s own text: does it say what the citing paper says it does?
The cited source says what the claim attributes to it.
In the citing paper
“To account for challenges around data access, 70 data-efficient echocardiogram algorithms 70 have been developed, such as semisupervised GANs that are effective at downstream tasks (e.g predicting left ventricular hypertrophy).”
From Deep learning-enabled medical computer vision (2021) · cites this paper as [70]
The cited source says what the claim attributes to it.
In the citing paper
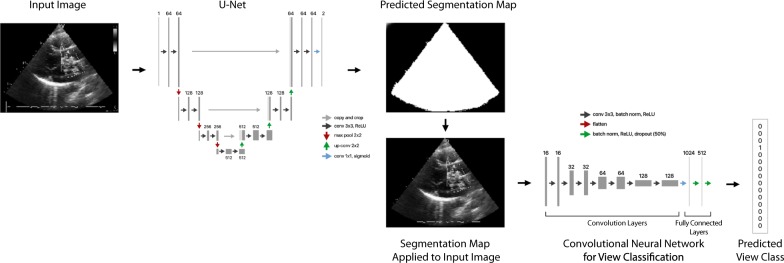
“The core framework of their model included a U-Net for eliminating auxiliary information from image and a series of convolutional neural networks, resulting in an accuracy of 91.2%.”
From A Comprehensive Review on Synergy of Multi-Modal Data and AI Technologies in Medical Diagnosis (2024) · cites this paper as [139]
The cited source says what the claim attributes to it.
In the citing paper
“GANs demonstrated superior performance than traditional CNNs with limited data, attaining a test accuracy of 92.3%.”
From A Comprehensive Review on Synergy of Multi-Modal Data and AI Technologies in Medical Diagnosis (2024) · cites this paper as [139]
Self-check
Percentages, sums and reported differences re-computed from the paper’s own numbers.
The self-check needs the paper’s full text.
Citations
Cites
Deep Residual Learning for Image Recognition
He, K., Zhang, X., Ren, S., & Sun, J. (2016) · 2016 IEEE Conference on Computer Vision and Pattern Recognition (CVPR) · doi:10.1109/cvpr.2016.90 · Cited by 235,474
Very Deep Convolutional Networks for Large-Scale Image Recognition
Simonyan, K., & Zisserman, A. (2014) · arXiv · doi:10.48550/arxiv.1409.1556 · Cited by 114,148
U-Net: Convolutional Networks for Biomedical Image Segmentation
Ronneberger, O., Fischer, P., & Brox, T. (2015) · Lecture notes in computer science · doi:10.1007/978-3-319-24574-4_28 · Cited by 99,404
LeCun, Y., Bengio, Y., & Hinton, G. (2015) · Nature · doi:10.1038/nature14539 · Cited by 84,126
ImageNet: A large-scale hierarchical image database
Deng, J., Dong, W., Socher, R., Li, L.-J., Li, K., & Fei-Fei, L. (2009) · 2009 IEEE Conference on Computer Vision and Pattern Recognition · doi:10.1109/cvpr.2009.5206848 · Cited by 65,333
ImageNet Large Scale Visual Recognition Challenge
Russakovsky, O., Deng, J., Su, H., Krause, J., Satheesh, S., Ma, S., Huang, Z., Karpathy, A., Khosla, A., Bernstein, M., et al. (2015) · International Journal of Computer Vision · doi:10.1007/s11263-015-0816-y · Cited by 39,380
(2014) · Cited by 33,419
A survey on deep learning in medical image analysis
Litjens, G., Kooi, T., Bejnordi, B. E., Setio, A. A. A., Ciompi, F., Ghafoorian, M., van der Laak, J. A. W. M., van Ginneken, B., & Sánchez, C. I. (2017) · Medical Image Analysis · doi:10.1016/j.media.2017.07.005 · Cited by 15,332
Dermatologist-level classification of skin cancer with deep neural networks
Esteva, A., Kuprel, B., Novoa, R. A., Ko, J., Swetter, S. M., Blau, H. M., & Thrun, S. (2017) · Nature · doi:10.1038/nature21056 · Cited by 14,362
Batch Normalization: Accelerating Deep Network Training by Reducing Internal Covariate Shift
Ioffe, S. (2024) · arXiv (Cornell University) · doi:10.57702/o9raffed · Cited by 14,214
Research works printed but not linked: 1
- Krizhevsky, A., Sutskever, I. & Geoffrey, E. H. ImageNet Classification with Deep Convolutiona lNeural Networks. Adv. Neural Inf. Process. Syst. 25, 1–9 (2012).
Cited by
High-performance medicine: the convergence of human and artificial intelligence
Topol, E. J. (2019) · Nature Medicine · doi:10.1038/s41591-018-0300-7 · Cited by 10,450
Deep learning-enabled medical computer vision
Esteva, A., Chou, K., Yeung, S., Naik, N., Madani, A., Mottaghi, A., Liu, Y., Topol, E., Dean, J., & Socher, R. (2021) · npj Digital Medicine · doi:10.1038/s41746-020-00376-2 · Cited by 1,406
Self-citationRecent advances and clinical applications of deep learning in medical image analysis
Chen, X., Wang, X., Zhang, K., Fung, K.-M., Thai, T. C., Moore, K., Mannel, R. S., Liu, H., Zheng, B., & Qiu, Y. (2022) · Medical Image Analysis · doi:10.1016/j.media.2022.102444 · Cited by 1,080
Deep learning interpretation of echocardiograms
Ghorbani, A., Ouyang, D., Abid, A., He, B., Chen, J. H., Harrington, R. A., Liang, D. H., Ashley, E. A., & Zou, J. Y. (2020) · npj Digital Medicine · doi:10.1038/s41746-019-0216-8 · Cited by 518
Innovations in Genomics and Big Data Analytics for Personalized Medicine and Health Care: A Review
Hassan, M., Awan, F. M., Naz, A., deAndrés-Galiana, E. J., Alvarez, O., Cernea, A., Fernández-Brillet, L., Fernández-Martínez, J. L., & Kloczkowski, A. (2022) · International Journal of Molecular Sciences · doi:10.3390/ijms23094645 · Cited by 317
“A machine learning echocardiography algorithm proposed by Madani et al. provided an accuracy of greater than 90% for the diagnosis of cardiac disease [61].”
Method
Metadata
- Authors
- Madani, A., Ong, J. R., Tibrewal, A., & Mofrad, M. R. K.
- Affiliations
- University of California, Berkeley (US)
- University of California, San Francisco (US)
- Corresponding author
- Mofrad, Mohammad R. K.
- Venue
- npj Digital Medicine
- Published
- 2018-10-18
- Volume
- 1
- Issue
- 1
- Pages
- 59-59
- ISSN
- 2398-6352 (ISSN-L)
- PMC
- PMC6550282
- OpenAlex
- W2897320536
- Cited by
- 250
- References
- 36
- Citations by year
- 2026: 15 · 2025: 34 · 2024: 44 · 2023: 37 · 2022: 35 · 2021: 38 · 2020: 31 · 2019: 13 · 2018: 3
- FWCI
- 26.80
- Type
- journal article
- Language
- en
- Open access
- gold
- doi.org
- Licence
- cc-by
- creativecommons.org/licenses/by/4.0 (tdm)
- creativecommons.org/licenses/by/4.0 (vor)
- Locations
- npj Digital Medicine (publishedVersion, cc-by)
- Europe PMC (PubMed Central) (publishedVersion, cc-by)
- PubMed Central (publishedVersion, cc-by)
- PubMed (publishedVersion)
- DOAJ (DOAJ: Directory of Open Access Journals) (submittedVersion)
- eScholarship (California Digital Library) (submittedVersion)
- Funders
- University of California, San Francisco
- Topics
- Health Sciences › Health Professions › Health Information Management › Artificial Intelligence in Healthcare
- Health Sciences › Medicine › Health Informatics › Artificial Intelligence in Healthcare and Education
- Health Sciences › Medicine › Radiology, Nuclear Medicine and Imaging › COVID-19 diagnosis using AI
- Keywords
- left ventricular hypertrophy, semi-supervised learning, generative adversarial networks, data-efficient deep learning, automated cardiac diagnosis, medical image classification, annotation cost
About these checks
Registry, retraction, Cites and statistics results are computed, not judged, with one exception: a printed reference that no index lists is read once by a model before it counts as a citation error. Claims are extracted by a model and kept only when their quote appears verbatim in the text; each cited source is then checked, with a model’s help, for whether it says what the claim relies on. Those verdicts can be wrong — read the claim’s quote and the cited source before relying on one.
Statistics and arithmetic are recomputed, not judged.
Confidence bands are shown only for fields calibrated on our annotated test set. None is calibrated yet, so no band is shown.
What counts as a claim ›How we measure confidence ›How we check this ›
Are you an author, or do you see a problem with this page? Request a review
How to cite
Cite CoChat for the checks on this page, and the paper for its own findings.
- This page
- CoChat. (2026). Citation check: Deep echocardiography: data-efficient supervised and semi-supervised deep learning towards automated diagnosis of cardiac disease. https://app.cochat.ai/papers/10.1038/s41746-018-0065-x
- The paper
- Madani, A., Ong, J. R., Tibrewal, A., & Mofrad, M. R. K. (2018). Deep echocardiography: data-efficient supervised and semi-supervised deep learning towards automated diagnosis of cardiac disease. npj Digital Medicine. https://doi.org/10.1038/s41746-018-0065-x
Data sources
Bibliographic data: Semantic Scholar, OpenAlex, Crossref.
Contains information from the Semantic Scholar Academic Graph Datasets, made available under the ODC Attribution License (ODC-BY 1.0).
Semantic Scholar’s data is described in: Kinney, R., et al. (2023). The Semantic Scholar Open Data Platform. arXiv:2301.10140.
