

The DOI matches its Crossref record; 15 of the 15 references it cites were found in a registry or an index.
Fast and accurate view classification of echocardiograms using deep learning
Open accessAbstract
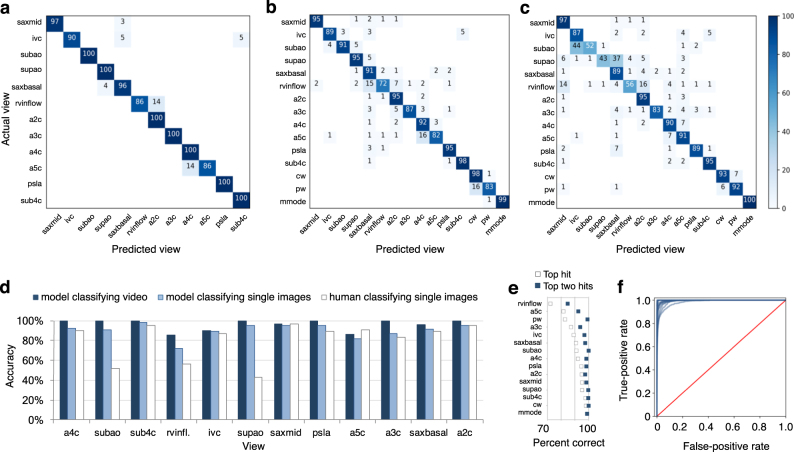
Echocardiography is essential to cardiology. However, the need for human interpretation has limited echocardiography’s full potential for precision medicine. Deep learning is an emerging tool for analyzing images but has not yet been widely applied to echocardiograms, partly due to their complex multi-view format. The essential first step toward comprehensive computer-assisted echocardiographic interpretation is determining whether computers can learn to recognize these views. We trained a convolutional neural network to simultaneously classify 15 standard views (12 video, 3 still), based on labeled still images and videos from 267 transthoracic echocardiograms that captured a range of real-world clinical variation. Our model classified among 12 video views with 97.8% overall test accuracy without overfitting. Even on single low-resolution images, accuracy among 15 views was 91.7% vs. 70.2–84.0% for board-certified echocardiographers. Data visualization experiments showed that the model recognizes similarities among related views and classifies using clinically relevant image features. Our results provide a foundation for artificial intelligence-assisted echocardiographic interpretation.
Overview
The claims and statistics of this paper haven’t been checked yet.
Free: it reads the open-access text and checks the first 5 claims that cite a source we can check. Create a free account to check every claim.
Integrity signals
Registry
Cites
Statistics
Figures



Verification
Claims the paper makes
The claims and statistics of this paper haven’t been checked yet.
Free: it reads the open-access text and checks the first 5 claims that cite a source we can check. Create a free account to check every claim.
Claims other papers make about this one
Each is checked against this paper’s own text: does it say what the citing paper says it does?
In the citing paper
“DL can be trained on a large database of echocardiographic studies and surpass the performance of board-certified echocardiographers in view classification 67 .”
From Deep learning-enabled medical computer vision (2021) · cites this paper as [67]
Self-check
Percentages, sums and reported differences re-computed from the paper’s own numbers.
The self-check needs the paper’s full text.
Citations
Cites
ImageNet Large Scale Visual Recognition Challenge
Russakovsky, O., Deng, J., Su, H., Krause, J., Satheesh, S., Ma, S., Huang, Z., Karpathy, A., Khosla, A., Bernstein, M., et al. (2015) · International Journal of Computer Vision · doi:10.1007/s11263-015-0816-y · Cited by 39,380
(2008) · Journal of Machine Learning Research · Cited by 33,051
A survey on deep learning in medical image analysis
Litjens, G., Kooi, T., Bejnordi, B. E., Setio, A. A. A., Ciompi, F., Ghafoorian, M., van der Laak, J. A. W. M., van Ginneken, B., & Sánchez, C. I. (2017) · Medical Image Analysis · doi:10.1016/j.media.2017.07.005 · Cited by 15,332
Dermatologist-level classification of skin cancer with deep neural networks
Esteva, A., Kuprel, B., Novoa, R. A., Ko, J., Swetter, S. M., Blau, H. M., & Thrun, S. (2017) · Nature · doi:10.1038/nature21056 · Cited by 14,362
Gulshan, V., Peng, L., Coram, M., Stumpe, M. C., Wu, D., Narayanaswamy, A., Venugopalan, S., Widner, K., Madams, T., Cuadros, J., et al. (2016) · JAMA · doi:10.1001/jama.2016.17216 · Cited by 7,697
ACCF/ASE/AHA/ASNC/HFSA/HRS/SCAI/SCCM/SCCT/SCMR 2011 Appropriate Use Criteria for Echocardiography
Douglas, P. S., Garcia, M. J., Haines, D. E., Lai, W. W., Manning, W. J., Patel, A. R., Picard, M. H., Polk, D. M., Ragosta, M., Ward, R. P., et al. (2011) · Journal of the American College of Cardiology · doi:10.1016/j.jacc.2010.11.002 · Cited by 673
Narula, S., Shameer, K., Salem Omar, A. M., Dudley, J. T., & Sengupta, P. P. (2016) · Journal of the American College of Cardiology · doi:10.1016/j.jacc.2016.08.062 · Cited by 410
Knackstedt, C., Bekkers, S. C. A. M., Schummers, G., Schreckenberg, M., Muraru, D., Badano, L. P., Franke, A., Bavishi, C., Omar, A. M. S., & Sengupta, P. P. (2015) · Journal of the American College of Cardiology · doi:10.1016/j.jacc.2015.07.052 · Cited by 262
Sengupta, P. P., Huang, Y.-M., Bansal, M., Ashrafi, A., Fisher, M., Shameer, K., Gall, W., & Dudley, J. T. (2016) · Circulation: Cardiovascular Imaging · doi:10.1161/circimaging.115.004330 · Cited by 203
Wharton, G., Steeds, R., Allen, J., Phillips, H., Jones, R., Kanagala, P., Lloyd, G., Masani, N., Mathew, T., Oxborough, D., et al. (2015) · Echo Research & Practice · doi:10.1530/erp-14-0079 · Cited by 183
Cited by
High-performance medicine: the convergence of human and artificial intelligence
Topol, E. J. (2019) · Nature Medicine · doi:10.1038/s41591-018-0300-7 · Cited by 10,450
Machine learning and deep learning
Janiesch, C., Zschech, P., & Heinrich, K. (2021) · Electronic Markets · doi:10.1007/s12525-021-00475-2 · Cited by 2,959
Attention gated networks: learning to leverage salient regions in medical images
Schlemper, J., Oktay, O., Schaap, M., Heinrich, M., Kainz, B., Glocker, B., & Rueckert, D. (2019) · Medical Image Analysis · doi:10.1016/j.media.2019.01.012 · Cited by 2,014
Deep learning-enabled medical computer vision
Esteva, A., Chou, K., Yeung, S., Naik, N., Madani, A., Mottaghi, A., Liu, Y., Topol, E., Dean, J., & Socher, R. (2021) · npj Digital Medicine · doi:10.1038/s41746-020-00376-2 · Cited by 1,406
Self-citationVideo-based AI for beat-to-beat assessment of cardiac function
Ouyang, D., He, B., Ghorbani, A., Yuan, N., Ebinger, J., Langlotz, C. P., Heidenreich, P. A., Harrington, R. A., Liang, D. H., Ashley, E. A., et al. (2020) · Nature · doi:10.1038/s41586-020-2145-8 · Cited by 1,153
Metadata
- Authors
- Madani, A., Arnaout, R., Mofrad, M., & Arnaout, R.
- Affiliations
- QB3 (US)
- Beth Israel Deaconess Medical Center (US)
- Corresponding author
- Arnaout, Ramy
- Mofrad, Mohammad
- Arnaout, Rima
- Venue
- npj Digital Medicine
- Published
- 2018-03-21
- Volume
- 1
- Issue
- 1
- ISSN
- 2398-6352 (ISSN-L)
- PMC
- PMC6395045
- OpenAlex
- W2963428668
- Cited by
- 585
- References
- 15
- Citations by year
- 2026: 51 · 2025: 82 · 2024: 84 · 2023: 81 · 2022: 78 · 2021: 81 · 2020: 68 · 2019: 40 · 2018: 19
- FWCI
- 14.17
- Type
- journal article
- Language
- en
- Open access
- gold
- doi.org
- Licence
- cc-by
- creativecommons.org/licenses/by/4.0 (tdm)
- creativecommons.org/licenses/by/4.0 (vor)
- Locations
- npj Digital Medicine (publishedVersion, cc-by)
- Europe PMC (PubMed Central) (publishedVersion, other-oa)
- PubMed Central (publishedVersion, cc-by)
- PubMed (publishedVersion)
- OSTI OAI (U.S. Department of Energy Office of Scientific and Technical Information) (submittedVersion)
- DOAJ (DOAJ: Directory of Open Access Journals) (submittedVersion)
- eScholarship (California Digital Library) (submittedVersion)
- eScholarship (California Digital Library) (submittedVersion, cc-by)
- Funders
- American Heart Association (16IRG27630014, 17IGMV33870001, 15GPSPG23830004)
- National Institutes of Health
- National Heart, Lung, and Blood Institute (K08HL125945)
- National Institute of Allergy and Infectious Diseases (K08AI114958)
- Topics
- Health Sciences › Medicine › Health Informatics › Artificial Intelligence in Healthcare and Education
- Health Sciences › Health Professions › Health Information Management › Artificial Intelligence in Healthcare
- Health Sciences › Medicine › Critical Care and Intensive Care Medicine › Ultrasound in Clinical Applications
- Keywords
- transthoracic echocardiography, convolutional neural networks, artificial intelligence in cardiology
About these checks
Registry, retraction, Cites and statistics results are computed, not judged, with one exception: a printed reference that no index lists is read once by a model before it counts as a citation error. Claims are extracted by a model and kept only when their quote appears verbatim in the text; each cited source is then checked, with a model’s help, for whether it says what the claim relies on. Those verdicts can be wrong — read the claim’s quote and the cited source before relying on one.
Statistics and arithmetic are recomputed, not judged.
Confidence bands are shown only for fields calibrated on our annotated test set. None is calibrated yet, so no band is shown.
What counts as a claim ›How we measure confidence ›How we check this ›
Are you an author, or do you see a problem with this page? Request a review
How to cite
Cite CoChat for the checks on this page, and the paper for its own findings.
- This page
- CoChat. (2026). Citation check: Fast and accurate view classification of echocardiograms using deep learning. https://app.cochat.ai/papers/10.1038/s41746-017-0013-1
- The paper
- Madani, A., Arnaout, R., Mofrad, M., & Arnaout, R. (2018). Fast and accurate view classification of echocardiograms using deep learning. npj Digital Medicine. https://doi.org/10.1038/s41746-017-0013-1
Data sources
Bibliographic data: Semantic Scholar, OpenAlex, Crossref.
Contains information from the Semantic Scholar Academic Graph Datasets, made available under the ODC Attribution License (ODC-BY 1.0).
Semantic Scholar’s data is described in: Kinney, R., et al. (2023). The Semantic Scholar Open Data Platform. arXiv:2301.10140.
