

A high-generalizability machine learning framework for predicting the progression of Alzheimer’s disease using limited data
Open accessThe DOI matches its Crossref record; 55 of the 55 references it cites were found in a registry or an index.
Abstract
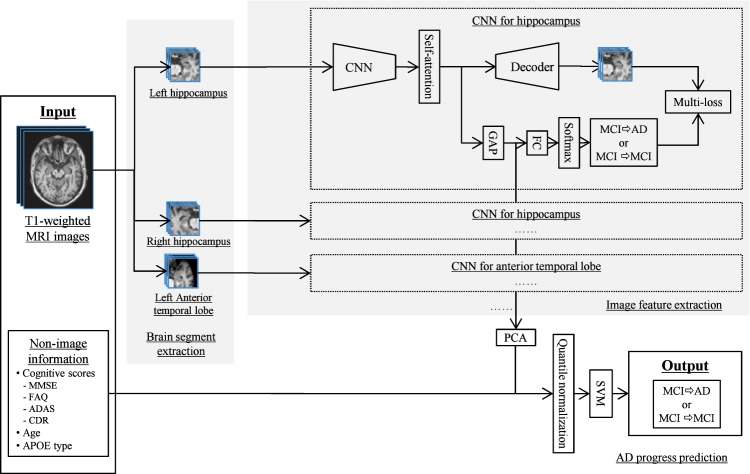
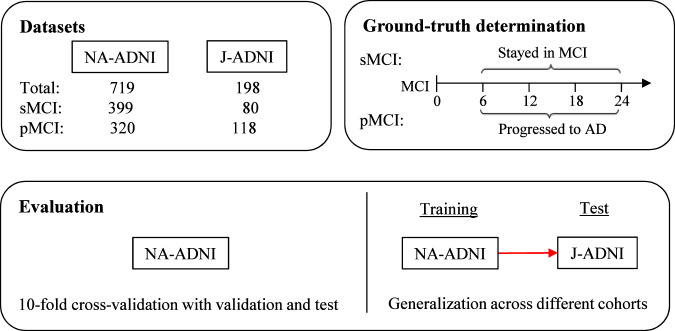
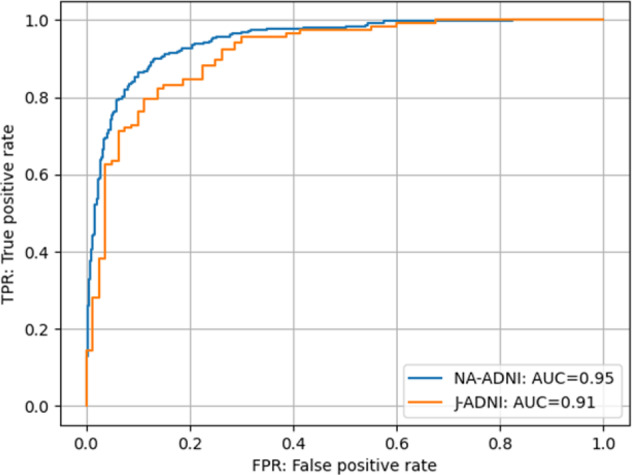
Alzheimer’s disease is a neurodegenerative disease that imposes a substantial financial burden on society. A number of machine learning studies have been conducted to predict the speed of its progression, which varies widely among different individuals, for recruiting fast progressors in future clinical trials. However, because the data in this field are very limited, two problems have yet to be solved: the first is that models built on limited data tend to induce overfitting and have low generalizability, and the second is that no cross-cohort evaluations have been done. Here, to suppress the overfitting caused by limited data, we propose a hybrid machine learning framework consisting of multiple convolutional neural networks that automatically extract image features from the point of view of brain segments, which are relevant to cognitive decline according to clinical findings, and a linear support vector classifier that uses extracted image features together with non-image information to make robust final predictions. The experimental results indicate that our model achieves superior performance (accuracy: 0.88, area under the curve [AUC]: 0.95) compared with other state-of-the-art methods. Moreover, our framework demonstrates high generalizability as a result of evaluations using a completely different cohort dataset (accuracy: 0.84, AUC: 0.91) collected from a different population than that used for training.
Overview
The claims and statistics of this paper haven’t been checked yet.
Free: it reads the open-access text and checks the first 5 claims that cite a source we can check. Create a free account to check every claim.
Integrity signals
Registry
Cites
Statistics
Figures
Verification
Claims the paper makes
The claims and statistics of this paper haven’t been checked yet.
Free: it reads the open-access text and checks the first 5 claims that cite a source we can check. Create a free account to check every claim.
Self-check
Percentages, sums and reported differences re-computed from the paper’s own numbers.
The self-check needs the paper’s full text.
Citations
Cites
Vaswani, A., Shazeer, N., Parmar, N., Uszkoreit, J., Jones, L., Gomez, A. N., Kaiser, L., & Polosukhin, I. (2017) · arXiv · doi:10.48550/arxiv.1706.03762 · Cited by 120,404
LeCun, Y., Bengio, Y., & Hinton, G. (2015) · Nature · doi:10.1038/nature14539 · Cited by 84,126
Faster R-CNN: Towards Real-Time Object Detection with Region Proposal Networks
Ren, S., He, K., Girshick, R., & Sun, J. (2017) · IEEE Transactions on Pattern Analysis and Machine Intelligence · doi:10.1109/tpami.2016.2577031 · Cited by 73,472
ImageNet: A large-scale hierarchical image database
Deng, J., Dong, W., Socher, R., Li, L.-J., Li, K., & Fei-Fei, L. (2009) · 2009 IEEE Conference on Computer Vision and Pattern Recognition · doi:10.1109/cvpr.2009.5206848 · Cited by 65,333
Densely Connected Convolutional Networks
Huang, G., Liu, Z., Van Der Maaten, L., & Weinberger, K. Q. (2017) · 2017 IEEE Conference on Computer Vision and Pattern Recognition (CVPR) · doi:10.1109/cvpr.2017.243 · Cited by 48,566
An Image is Worth 16x16 Words: Transformers for Image Recognition at Scale
Dosovitskiy, A., Beyer, L., Kolesnikov, A., Weissenborn, D., Zhai, X., Unterthiner, T., Dehghani, M., Minderer, M., Heigold, G., Gelly, S., et al. (2020) · arXiv · doi:10.48550/arxiv.2010.11929 · Cited by 47,472
Rich Feature Hierarchies for Accurate Object Detection and Semantic Segmentation
Girshick, R., Donahue, J., Darrell, T., & Malik, J. (2014) · 2014 IEEE Conference on Computer Vision and Pattern Recognition · doi:10.1109/cvpr.2014.81 · Cited by 32,684
A survey on Image Data Augmentation for Deep Learning
Shorten, C., & Khoshgoftaar, T. M. (2019) · Journal of Big Data · doi:10.1186/s40537-019-0197-0 · Cited by 13,203
V-Net: Fully Convolutional Neural Networks for Volumetric Medical Image Segmentation
Milletari, F., Navab, N., & Ahmadi, S.-A. (2016) · 2016 Fourth International Conference on 3D Vision (3DV) · doi:10.1109/3dv.2016.79 · Cited by 11,931
UMAP: Uniform Manifold Approximation and Projection
McInnes, L., Healy, J., Saul, N., & Großberger, L. (2018) · Journal of Open Source Software · doi:10.21105/joss.00861 · Cited by 9,826
Research works printed but not linked: 5
- Goto, T., Wang, C., Li, Y. & Tsuboshita, Y. Multi-modal deep learning for predicting progression of Alzheimer’s disease using bi-linear shake fusion. Proc. SPIE (Med. Imaging) 11314, 452–457 (2020).
- Srivastava, N., Hinton, G., Krizhevsky, A., Sutskever, I. & Salakhutdinov, R. Dropout: a simple way to prevent neural networks from overfitting. J. Mach. Learn. Res. 15, 1929–1958 (2014).
- Vincent, P., Larochelle, H., Bengio, Y. & Manzagol, P. A. Stacked denoising autoencoders: learning useful representations in a deep network with a local denoising criterion. J. Mach. Learn. Res. 11, 3371–3408 (2010).
- Buolamwini, J. & Gebru, T. Gender shades: intersectional accuracy disparities in commercial gender classification. Proc. Mach. Learn. Res. 81, 1–15 (2018).
- Mattes, D., Haynor, D. R., Vesselle, H., Lewellen, T. K. & Eubank, W. Nonrigid multimodality image registration. Proc. SPIE 4322, Medical Imaging: Image Processing, 1609-1620(2001).
Cited by
Lu, P., Hu, L., Mitelpunkt, A., Bhatnagar, S., Lu, L., & Liang, H. (2024) · Biomedical Signal Processing and Control · doi:10.1016/j.bspc.2023.105669 · Cited by 68
Shin, H.-J., Jeon, S., Seol, Y., Kim, S., & Kang, D. (2023) · Applied Sciences · doi:10.3390/app13063453 · Cited by 83
Tran, A. T., Zeevi, T., & Payabvash, S. (2025) · BioMedInformatics · doi:10.3390/biomedinformatics5020020 · Cited by 73
Chen, K., Weng, Y., Hosseini, A. A., Dening, T., Zuo, G., & Zhang, Y. (2023) · Neural Networks · doi:10.1016/j.neunet.2023.10.040 · Cited by 67
Mirkin, S., & Albensi, B. C. (2023) · Frontiers in Aging Neuroscience · doi:10.3389/fnagi.2023.1094233 · Cited by 46
Metadata
- Authors
- Wang, C., Li, Y., Tsuboshita, Y., Sakurai, T., Goto, T., Yamaguchi, H., Yamashita, Y., Sekiguchi, A., Tachimori, H., Initiative, F. T. A. D. N., Wang, C., Li, Y., & Goto, T.
- Affiliations
- Fujifilm (Japan) (JP)
- National Center of Neurology and Psychiatry (JP)
- Keio University (JP)
- Venue
- npj Digital Medicine
- Published
- 2022-04-12
- Volume
- 5
- Issue
- 1
- Pages
- 43-43
- ISSN
- 2398-6352 (ISSN-L)
- PMC
- PMC9005545
- OpenAlex
- W4223442957
- Cited by
- 51
- References
- 54
- Citations by year
- 2026: 10 · 2025: 16 · 2024: 9 · 2023: 13 · 2022: 3
- FWCI
- 6.68
- Type
- journal article
- Language
- en
- Open access
- gold
- doi.org
- Licence
- cc-by
- creativecommons.org/licenses/by/4.0 (tdm)
- creativecommons.org/licenses/by/4.0 (vor)
- Locations
- npj Digital Medicine (publishedVersion, cc-by)
- PubMed Central (publishedVersion, cc-by)
- PubMed (publishedVersion)
- DOAJ (DOAJ: Directory of Open Access Journals) (submittedVersion, cc-by-sa)
- Funders
- U.S. Department of Defense (U01 AG024904, W81XWH, W81XWH-12-2-, W81XWH-12, W81XWH1220012, AG024904)
- Foundation for the National Institutes of Health (W81XWH-12-2-0012, U01AG024904, Grant U01 AG024904, AG024904)
- Alzheimer's Association (U01 AG024904, W81XWH-12-2-0012)
- Bristol-Myers Squibb (U01 AG024904, AG024904, W81XWH-12-2-0012)
- Eli Lilly and Company (U01 AG024904, AG024904, W81XWH-12-2-0012)
- Pfizer (AG024904, W81XWH-12-2-0012, U01 AG024904)
- Biogen (W81XWH-12-2-0012, U01 AG024904, AG024904)
- University of Southern California (W81XWH-12-2-0012, U01 AG024904)
- F. Hoffmann-La Roche (W81XWH-12-2-0012, AG024904, U01 AG024904)
- Meso Scale Diagnostics (U01 AG024904, AG024904, W81XWH-12-2-0012)
- Alzheimer's Disease Neuroimaging Initiative (W81XWH-12-2–0012, U01AG024904, AG024904, W81XWH-12-2-, Department of Defense award number W81XWH-12-2-0012)
- BioClinica (U01 AG024904, W81XWH-12-2-0012, AG024904)
- Novartis Pharmaceuticals Corporation (W81XWH-12-2-0012, U01 AG024904, AG024904)
- Northern California Institute for Research and Education (U01 AG024904, W81XWH-12-2-0012)
- Fujifilm Corporation
- Eisai (W81XWH-12-2-0012, U01 AG024904, AG024904)
- Servier (AG024904, W81XWH-12-2-0012, U01 AG024904)
- H. Lundbeck A/S (U01 AG024904, AG024904, W81XWH-12-2-0012)
- IXICO (AG024904, W81XWH-12-2-0012, U01 AG024904)
- National Institutes of Health (3u01ag024904-10s2, W81XWH, W81XWH-12-2-0012, U01-AG024904, Grant U01 AG024904, AG024904)
- Genentech (W81XWH-12-2-0012, AG024904, U01 AG024904)
- Canadian Institutes of Health Research (U01 AG024904, W81XWH-12-2-0012)
- Japan Society for the Promotion of Science (22K15777)
- Japan Science and Technology Agency (JPMJOP1842)
- National Institute on Aging (U01-AG-024904, W81XWH-12-2–0012, AG 024904)
- National Institute of Biomedical Imaging and Bioengineering (W81XWH-12-2-0012, U01 AG024904, AG024904)
- Program on Open Innovation Platform with Enterprises, Research Institute and Academia (JPMJOP1842)
- Topics
- Health Sciences › Medicine › Psychiatry and Mental health › Dementia and Cognitive Impairment Research
- Health Sciences › Health Professions › Health Information Management › Artificial Intelligence in Healthcare
- Physical Sciences › Computer Science › Artificial Intelligence › Machine Learning in Healthcare
- Keywords
- Alzheimer's disease, disease progression prediction, fast progressors, data scarcity, overfitting, generalizability, convolutional neural networks, brain segmentation, image feature extraction, linear support vector machine, cognitive decline, clinical trial recruitment
About these checks
Registry, retraction, Cites and statistics results are computed, not judged, with one exception: a printed reference that no index lists is read once by a model before it counts as a citation error. Claims are extracted by a model and kept only when their quote appears verbatim in the text; each cited source is then checked, with a model’s help, for whether it says what the claim relies on. Those verdicts can be wrong — read the claim’s quote and the cited source before relying on one.
Statistics and arithmetic are recomputed, not judged.
Confidence bands are shown only for fields calibrated on our annotated test set. None is calibrated yet, so no band is shown.
What counts as a claim ›How we measure confidence ›How we check this ›
Are you an author, or do you see a problem with this page? Request a review
How to cite
Cite CoChat for the checks on this page, and the paper for its own findings.
- This page
- CoChat. (2026). Citation check: A high-generalizability machine learning framework for predicting the progression of Alzheimer’s disease using limited data. https://app.cochat.ai/papers/10.1038/s41746-022-00577-x
- The paper
- Wang, C., Li, Y., Tsuboshita, Y., Sakurai, T., Goto, T., Yamaguchi, H., Yamashita, Y., Sekiguchi, A., Tachimori, H., Initiative, F. T. A. D. N., Wang, C., Li, Y., & Goto, T. (2022). A high-generalizability machine learning framework for predicting the progression of Alzheimer’s disease using limited data. npj Digital Medicine. https://doi.org/10.1038/s41746-022-00577-x
Data sources
Bibliographic data: Semantic Scholar, OpenAlex, Crossref.
Contains information from the Semantic Scholar Academic Graph Datasets, made available under the ODC Attribution License (ODC-BY 1.0).
Semantic Scholar’s data is described in: Kinney, R., et al. (2023). The Semantic Scholar Open Data Platform. arXiv:2301.10140.
