

Solving the explainable AI conundrum by bridging clinicians’ needs and developers’ goals
Open accessPublished version of a preprint
The DOI matches its Crossref record; 34 of the 34 references it cites were found in a registry or an index.
Abstract
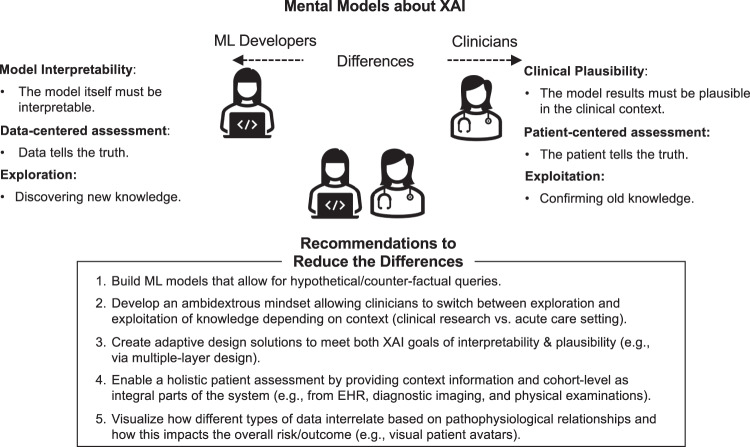
Explainable artificial intelligence (XAI) has emerged as a promising solution for addressing the implementation challenges of AI/ML in healthcare. However, little is known about how developers and clinicians interpret XAI and what conflicting goals and requirements they may have. This paper presents the findings of a longitudinal multi-method study involving 112 developers and clinicians co-designing an XAI solution for a clinical decision support system. Our study identifies three key differences between developer and clinician mental models of XAI, including opposing goals (model interpretability vs. clinical plausibility), different sources of truth (data vs. patient), and the role of exploring new vs. exploiting old knowledge. Based on our findings, we propose design solutions that can help address the XAI conundrum in healthcare, including the use of causal inference models, personalized explanations, and ambidexterity between exploration and exploitation mindsets. Our study highlights the importance of considering the perspectives of both developers and clinicians in the design of XAI systems and provides practical recommendations for improving the effectiveness and usability of XAI in healthcare.
Overview
The claims and statistics of this paper haven’t been checked yet.
Free: it reads the open-access text and checks the first 5 claims that cite a source we can check. Create a free account to check every claim.
Integrity signals
Registry
Cites
Statistics
Figures

Verification
Claims the paper makes
The claims and statistics of this paper haven’t been checked yet.
Free: it reads the open-access text and checks the first 5 claims that cite a source we can check. Create a free account to check every claim.
Claims other papers make about this one
Each is checked against this paper’s own text: does it say what the citing paper says it does?
The source backs part of the claim, not all of it — or backs it for a different population, condition or comparison.
In the citing paper
“Simple, interpretable visualizations, such as bar charts and line graphs, were preferred for understanding predictions at a glance.”
From Explainable AI in hospital clinical decision support systems: A scoping review of healthcare professionals’ perspectives (2026) · cites this paper as [27]
Experimental — accuracy not yet measuredThe source backs part of the claim, not all of it — or backs it for a different population, condition or comparison.
In the citing paper
“Five studies [23,25,27,28,34] specifically described using SHapley Additive exPlanations (SHAP)”
From Explainable AI in hospital clinical decision support systems: A scoping review of healthcare professionals’ perspectives (2026) · cites this paper as [27]
Experimental — accuracy not yet measuredThe cited source says what the claim attributes to it.
In the citing paper
“The XAI orchestrator should be integrated with time-effectiveness in mind since it was found that clinicians sometimes prefer rapid, less detailed information67.”
From Orchestrating explainable artificial intelligence for multimodal and longitudinal data in medical imaging (2024) · cites this paper as [67]
The cited source says what the claim attributes to it.
In the citing paper
“Impact in workflow related to how XAI systems aligned with and influenced work processes, and arose as a theme in 9 papers [23–27,30,31,33,35].”
From Explainable AI in hospital clinical decision support systems: A scoping review of healthcare professionals’ perspectives (2026) · cites this paper as [27]
The cited source says what the claim attributes to it.
In the citing paper
“Considering context and users was also reported, with some health professionals having limited time to interpret model explanations and make a decision [23,25,27,32].”
From Explainable AI in hospital clinical decision support systems: A scoping review of healthcare professionals’ perspectives (2026) · cites this paper as [27]
10 more claims about this paper
Create a free account to see every claim other papers make about this one.
Self-check
Percentages, sums and reported differences re-computed from the paper’s own numbers.
The self-check needs the paper’s full text.
Citations
Cites
User Acceptance of Information Technology: Toward A Unified View1
Venkatesh, V., Morris, M. G., Davis, G. B., & Davis, F. D. (2003) · MIS Quarterly · doi:10.2307/30036540 · Cited by 45,035
The Discovery of Grounded Theory; Strategies for Qualitative Research
Glaser, B. G., Strauss, A. L., & Strutzel, E. (1968) · Nursing Research · doi:10.1097/00006199-196807000-00014 · Cited by 39,449
Seeking Qualitative Rigor in Inductive Research: Notes on the Gioia Methodology
Gioia, D. A., Corley, K. G., & Hamilton, A. L. (2013) · Organizational Research Methods · doi:10.1177/1094428112452151 · Cited by 13,227
Standards for Reporting Qualitative Research: A Synthesis of Recommendations
O’Brien, B. C., Harris, I. B., Beckman, T. J., Reed, D. A., & Cook, D. A. (2014) · Academic Medicine · doi:10.1097/acm.0000000000000388 · Cited by 12,211
High-performance medicine: the convergence of human and artificial intelligence
Topol, E. J. (2019) · Nature Medicine · doi:10.1038/s41591-018-0300-7 · Cited by 10,450
Geurts, P., Ernst, D., & Wehenkel, L. (2006) · Machine Learning · doi:10.1007/s10994-006-6226-1 · Cited by 9,300
Rajpurkar, P., Chen, E., Banerjee, O., & Topol, E. J. (2022) · Nature Medicine · doi:10.1038/s41591-021-01614-0 · Cited by 3,212 · cited 5×
“However, implementation of these systems into clinical practice lags behind due to a lack of trust and system explainability 2,3 .”
InfluentialConfirmation, disconfirmation, and information in hypothesis testing
Klayman, J., & Ha, Y.-W. (1987) · Psychological Review · doi:10.1037/0033-295x.94.2.211 · Cited by 2,094
Causability and explainability of artificial intelligence in medicine
Holzinger, A., Langs, G., Denk, H., Zatloukal, K., & Müller, H. (2019) · WIREs Data Mining and Knowledge Discovery · doi:10.1002/widm.1312 · Cited by 1,885
The false hope of current approaches to explainable artificial intelligence in health care
Ghassemi, M., Oakden-Rayner, L., & Beam, A. L. (2021) · The Lancet Digital Health · doi:10.1016/s2589-7500(21)00208-9 · Cited by 1,724 · cited 2×
“…(XAI) 4,5 is considered the number one requirement for enabling trustful human-AI teaming in medicine 2,3,6 ; yet, current efforts consisting of complex mathematical methodologies (e.g., ante-hoc or posthoc procedures 7 ) are unlikely to increase clinicians ’ trust and practical understanding 8 .”
Research works printed but not linked: 1
- Tabachnick, B. G., Fidell, L. S. & Ullman, J. B. Using multivariate statistics. (Pearson, 2019).
Cited by
Joshi, G., Jain, A., Araveeti, S. R., Adhikari, S., Garg, H., & Bhandari, M. (2024) · Electronics · doi:10.3390/electronics13030498 · Cited by 294
Abbas, Q., Jeong, W., & Lee, S. W. (2025) · Healthcare · doi:10.3390/healthcare13172154 · Cited by 236
“Clinicians have different needs and cognitive styles, and not all explanations are equally meaningful or useful for every user [31,32].”
Should AI models be explainable to clinicians?
Abgrall, G., Holder, A. L., Chelly Dagdia, Z., Zeitouni, K., & Monnet, X. (2024) · Critical Care · doi:10.1186/s13054-024-05005-y · Cited by 175
“Engineers typically focus on the interpretability of the model’s inner workings, such as for debugging purposes, whereas clinicians emphasise the clinical relevance of its outputs [19].”
BackgroundDigital twins as global learning health and disease models for preventive and personalized medicine
Li, X., Loscalzo, J., Mahmud, A. K. M. F., Aly, D. M., Rzhetsky, A., Žitnik, M., & Benson, M. (2025) · Genome Medicine · doi:10.1186/s13073-025-01435-7 · Cited by 150
Chen, M., Wang, Y., Wang, Q., Shi, J., Wang, H., Ye, Z., Xue, P., & Qiao, Y. (2024) · npj Digital Medicine · doi:10.1038/s41746-024-01328-w · Cited by 143
Metadata
- Authors
- Bienefeld, N., Boss, J. M., Lüthy, R., Brodbeck, D., Azzati, J., Blaser, M., Willms, J., & Keller, E.
- Affiliations
- ETH Zurich (CH)
- University of Zurich (CH)
- FHNW University of Applied Sciences and Arts Northwestern Switzerland (CH)
- Corresponding author
- Bienefeld, Nadine
- Venue
- npj Digital Medicine
- Published
- 2023-05-22
- Volume
- 6
- Issue
- 1
- Pages
- 94-94
- ISSN
- 2398-6352 (ISSN-L)
- PMC
- PMC10202353
- OpenAlex
- W4377289493
- Semantic Scholar
- f72beb4fbab3a55455ad1403891855103bb470e1
- Cited by
- 159
- References
- 32
- Citations by year
- 2026: 68 · 2025: 52 · 2024: 31 · 2023: 8
- FWCI
- 14.99
- Type
- journal article
- Language
- en
- Open access
- gold
- doi.org
- Licence
- cc-by
- creativecommons.org/licenses/by/4.0 (tdm)
- creativecommons.org/licenses/by/4.0 (vor)
- Locations
- npj Digital Medicine (publishedVersion, cc-by)
- PubMed Central (publishedVersion, cc-by)
- PubMed (publishedVersion)
- Zurich Open Repository and Archive (University of Zurich) (acceptedVersion, cc-by-nc-nd)
- Repository for Publications and Research Data (ETH Zurich) (submittedVersion, cc-by)
- DOAJ (DOAJ: Directory of Open Access Journals) (submittedVersion, cc-by-sa)
- Zurich Open Repository and Archive (University of Zurich) (submittedVersion, cc-by)
- ETH Zürich Research Collection
- Zurich Open Repository and Archive (University of Zurich)
- Funders
- Schweizerischer Nationalfonds zur Förderung der Wissenschaftlichen Forschung (187331, 52441_1)
- Topics
- Physical Sciences › Computer Science › Artificial Intelligence › Explainable Artificial Intelligence (XAI)
- Health Sciences › Medicine › Health Informatics › Artificial Intelligence in Healthcare and Education
- Physical Sciences › Computer Science › Artificial Intelligence › Machine Learning in Healthcare
- Keywords
- explainable AI, clinical decision support systems, co-design, model interpretability, exploration and exploitation, ambidexterity, causal inference, personalized explanations, clinical implementation of AI
About these checks
Registry, retraction, Cites and statistics results are computed, not judged, with one exception: a printed reference that no index lists is read once by a model before it counts as a citation error. Claims are extracted by a model and kept only when their quote appears verbatim in the text; each cited source is then checked, with a model’s help, for whether it says what the claim relies on. Those verdicts can be wrong — read the claim’s quote and the cited source before relying on one.
Statistics and arithmetic are recomputed, not judged.
Confidence bands are shown only for fields calibrated on our annotated test set. None is calibrated yet, so no band is shown.
What counts as a claim ›How we measure confidence ›How we check this ›
Are you an author, or do you see a problem with this page? Request a review
How to cite
Cite CoChat for the checks on this page, and the paper for its own findings.
- This page
- CoChat. (2026). Citation check: Solving the explainable AI conundrum by bridging clinicians’ needs and developers’ goals. https://app.cochat.ai/papers/10.1038/s41746-023-00837-4
- The paper
- Bienefeld, N., Boss, J. M., Lüthy, R., Brodbeck, D., Azzati, J., Blaser, M., Willms, J., & Keller, E. (2023). Solving the explainable AI conundrum by bridging clinicians’ needs and developers’ goals. npj Digital Medicine. https://doi.org/10.1038/s41746-023-00837-4
Data sources
Bibliographic data: Semantic Scholar, OpenAlex, Crossref.
Contains information from the Semantic Scholar Academic Graph Datasets, made available under the ODC Attribution License (ODC-BY 1.0).
Semantic Scholar’s data is described in: Kinney, R., et al. (2023). The Semantic Scholar Open Data Platform. arXiv:2301.10140.
