

The DOI matches its Crossref record; 49 of the 49 references it cites were found in a registry or an index.
A simple high-throughput approach identifies actionable drug sensitivities in patient-derived tumor organoids
Open accessPublished version of a preprint
Abstract
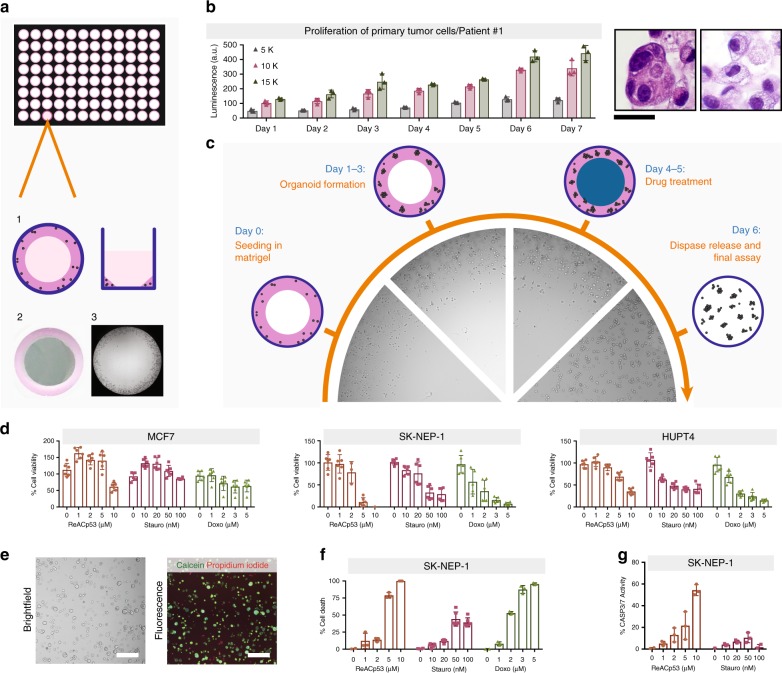
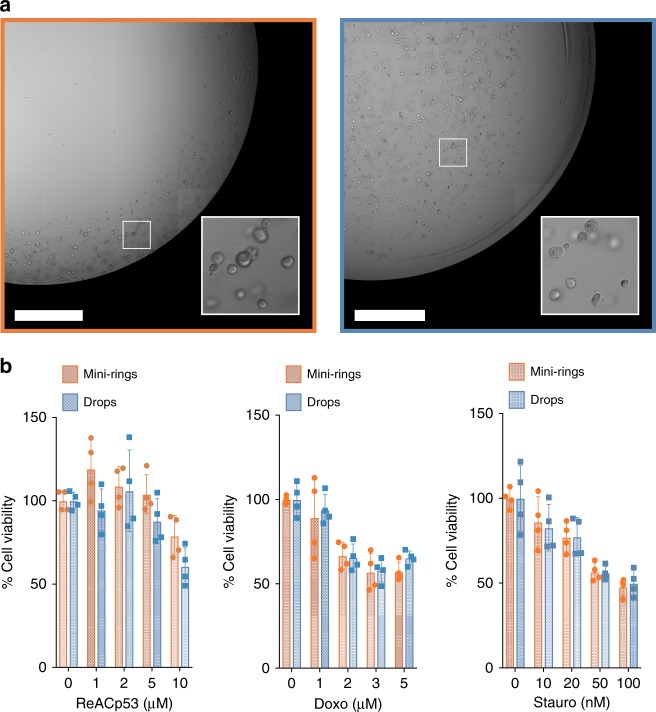
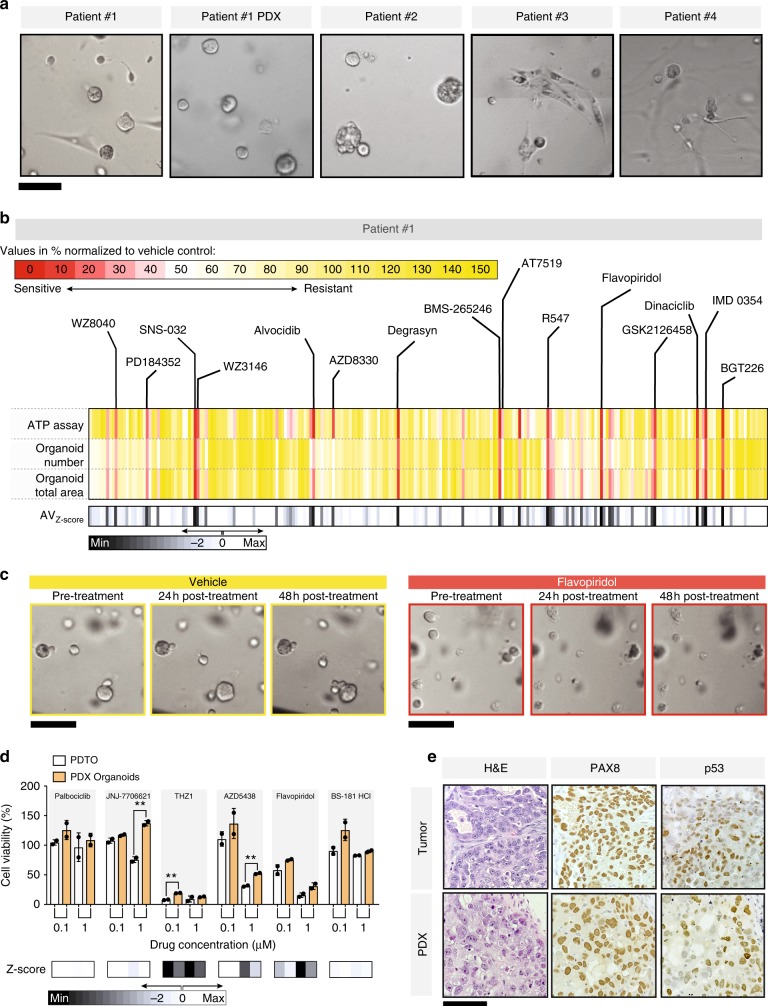
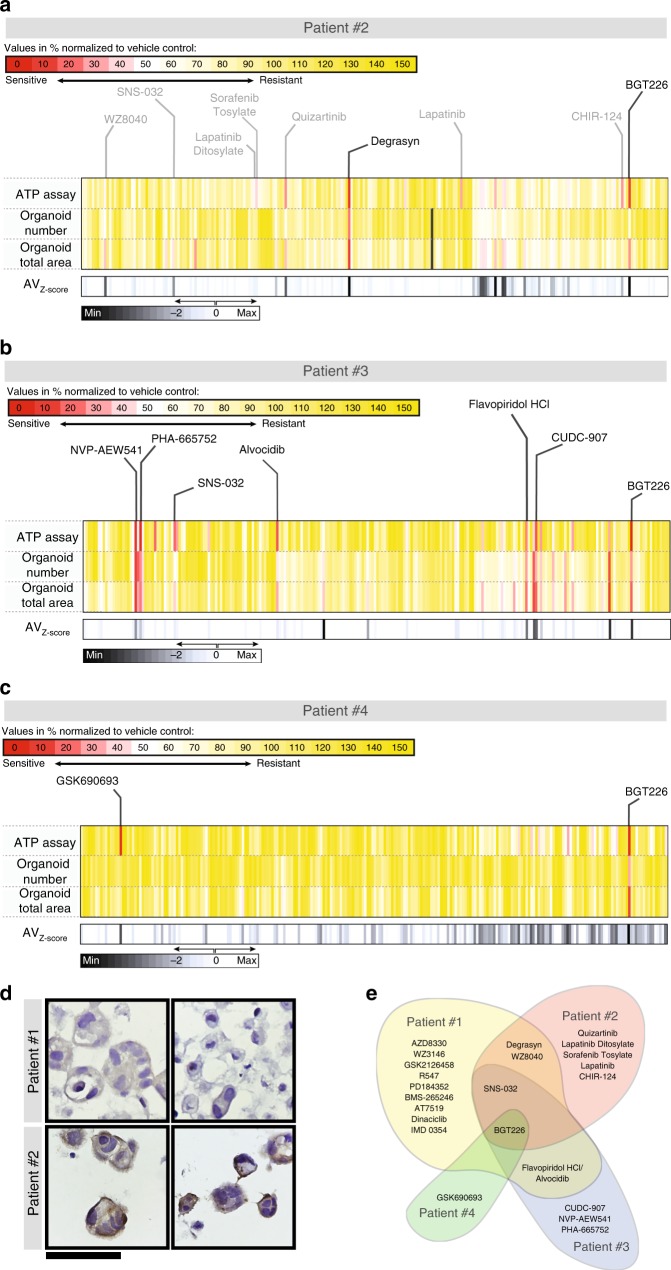
Tumor organoids maintain cell–cell interactions, heterogeneity, microenvironment, and drug response of the sample they originate from. Thus, there is increasing interest in developing tumor organoid models for drug development and personalized medicine applications. Although organoids are in principle amenable to high-throughput screenings, progress has been hampered by technical constraints and extensive manipulations required by current methods. Here we introduce a miniaturized method that uses a simplified geometry by seeding cells around the rim of the wells (mini-rings). This allows high-throughput screenings in a format compatible with automation as shown using four patient-derived tumor organoids established from two ovarian and one peritoneal high-grade serous carcinomas and one carcinosarcoma of the ovary. Using our automated screening platform, we identified personalized responses by measuring viability, number, and size of organoids after exposure to 240 kinase inhibitors. Results are available within a week from surgery, a timeline compatible with therapeutic decision-making.
Overview
The claims and statistics of this paper haven’t been checked yet.
Run the check — free, no account needed. It reads the open-access text and checks the sources it cites.
Integrity signals
Registry
Cites
Statistics
Figures
Verification
Claims the paper makes
The claims and statistics of this paper haven’t been checked yet.
Run the check — free, no account needed. It reads the open-access text and checks the sources it cites.
Claims other papers make about this one
Each is checked against this paper’s own text: does it say what the citing paper says it does?
In the citing paper
“These PDX model systems are of particular value in both basic science and potentially personalized medicine research 180,183,222 as they have clinical and molecular features that are quite representative of the human disease 223,224,225,226 .”
From Osteosarcoma (2022) · cites this paper as [222]
In the citing paper
“High-throughput development of patient-derived ovarian cancer organoids grown in a ring-shaped geometry of Matrigel, was able to identify responses to 240 kinase inhibitor compounds within a week of cell isolation (Phan et al., 2019).”
From Three-dimensional modelling of ovarian cancer: from cell lines to organoids for discovery and personalized medicine (2022) · cites this paper as Phan et al., 2019
In the citing paper
“Further, tumoroids grown by this method were able to maintain heterogeneity with distinct cytomorphologies from mixed type carcinomas.”
From Three-dimensional modelling of ovarian cancer: from cell lines to organoids for discovery and personalized medicine (2022) · cites this paper as Phan et al., 2019
Self-check
Percentages, sums and reported differences re-computed from the paper’s own numbers.
The self-check needs the paper’s full text.
Citations
Cites
Prospective Derivation of a Living Organoid Biobank of Colorectal Cancer Patients
van de Wetering, M., Francies, H. E., Francis, J. M., Bounova, G., Iorio, F., Pronk, A., van Houdt, W., van Gorp, J., Taylor-Weiner, A., Kester, L., et al. (2015) · Cell · doi:10.1016/j.cell.2015.03.053 · Cited by 2,408
Organoid models of human and mouse ductal pancreatic cancer
Boj, S. F., Hwang, C.-I., Baker, L. A., Chio, I. I. C., Engle, D. D., Corbo, V., Jager, M., Ponz-Sarvise, M., Tiriac, H., Spector, M. S., et al. (2015) · Cell · doi:10.1016/j.cell.2014.12.021 · Cited by 2,150
Patient-derived organoids model treatment response of metastatic gastrointestinal cancers
Vlachogiannis, G., Hedayat, S., Vatsiou, A., Jamin, Y., Fernández-Mateos, J., Khan, K., Lampis, A., Eason, K., Huntingford, I., Burke, R., et al. (2018) · Science · doi:10.1126/science.aao2774 · Cited by 2,096
Spheroid-based drug screen: Considerations and practical approach
Friedrich, J., Seidel, C., Ebner, R., & Kunz-Schughart, L. A. (2009) · Nature Protocols · doi:10.1038/nprot.2008.226 · Cited by 1,742
Three-dimensional cell culture: the missing link in drug discovery
Breslin, S., & O’Driscoll, L. (2013) · Drug Discovery Today · doi:10.1016/j.drudis.2012.10.003 · Cited by 1,332
Zanoni, M., Piccinini, F., Arienti, C., Zamagni, A., Santi, S., Polico, R., Bevilacqua, A., & Tesei, A. (2016) · Scientific Reports · doi:10.1038/srep19103 · Cited by 1,144
Personalized In Vitro and In Vivo Cancer Models to Guide Precision Medicine
Pauli, C., Hopkins, B. D., Prandi, D., Shaw, R. C., Fedrizzi, T., Sboner, A., Sailer, V., Augello, M. A., Puca, L., Rosati, R., et al. (2017) · Cancer Discovery · doi:10.1158/2159-8290.cd-16-1154 · Cited by 964
Kelm, J. M., Timmins, N. E., Brown, C. J., Fussenegger, M., & Nielsen, L. K. (2003) · Biotechnology and Bioengineering · doi:10.1002/bit.10655 · Cited by 934
Genetic and transcriptional evolution alters cancer cell line drug response
Ben-David, U., Siranosian, B., Ha, G., Tang, H., Oren, Y., Hinohara, K., Strathdee, C. A., Dempster, J., Lyons, N. J., Burns, R., et al. (2018) · Nature · doi:10.1038/s41586-018-0409-3 · Cited by 931
Driver mutations in TP53 are ubiquitous in high grade serous carcinoma of the ovary
Ahmed, A. A., Etemadmoghadam, D., Temple, J., Lynch, A. G., Riad, M., Sharma, R. N., Stewart, C. J. R., Fereday, S., Caldas, C., DeFazio, A., et al. (2010) · The Journal of Pathology · doi:10.1002/path.2696 · Cited by 815
Cited by
Sorted by citations
Zhao, Z., Chen, X., Dowbaj, A. M., Sljukic, A., Bratlie, K., Lin, L., Fong, E. L. S., Balachander, G. M., Chen, Z., Soragni, A., et al. (2022) · Nature Reviews Methods Primers · doi:10.1038/s43586-022-00174-y · Cited by 1,082
Self-citationBeird, H. C., Bielack, S. S., Flanagan, A. M., Gill, J., Heymann, D., Janeway, K. A., Livingston, J. A., Roberts, R. D., Strauss, S. J., & Gorlick, R. (2022) · Nature Reviews Disease Primers · doi:10.1038/s41572-022-00409-y · Cited by 660
Patient-derived organoids as a predictive biomarker for treatment response in cancer patients
Wensink, G. E., Elias, S. G., Mullenders, J., Koopman, M., Boj, S. F., Kranenburg, O. W., & Roodhart, J. M. L. (2021) · npj Precision Oncology · doi:10.1038/s41698-021-00168-1 · Cited by 323
de Witte, C. J., Espejo Valle-Inclan, J., Hami, N., Lõhmussaar, K., Kopper, O., Vreuls, C. P. H., Jonges, G. N., van Diest, P., Nguyen, L., Clevers, H., et al. (2020) · Cell Reports · doi:10.1016/j.celrep.2020.107762 · Cited by 303
Zhou, Z., Van der Jeught, K., Fang, Y., Yu, T., Li, Y., Ao, Z., Liu, S., Zhang, L., Yang, Y., Eyvani, H., et al. (2021) · Nature Biomedical Engineering · doi:10.1038/s41551-021-00805-x · Cited by 107
Vermeulen, M., Del Vento, F., Kanbar, M., Pyr dit Ruys, S., Vertommen, D., Poels, J., & Wyns, C. (2019) · International Journal of Molecular Sciences · doi:10.3390/ijms20215476 · Cited by 97
Personalized chordoma organoids for drug discovery studies
Al Shihabi, A., Davarifar, A., Nguyen, H. T. L., Tavanaie, N., Nelson, S. D., Yanagawa, J., Federman, N., Bernthal, N., Hornicek, F., & Soragni, A. (2022) · Science Advances · doi:10.1126/sciadv.abl3674 · Cited by 75
Self-citationEnabling peristalsis of human colon tumor organoids on microfluidic chips
Fang, G., Lu, H., Al-Nakashli, R., Chapman, R., Zhang, Y., Ju, L. A., Lin, G., Stenzel, M. H., & Jin, D. (2022) · Biofabrication · doi:10.1088/1758-5090/ac2ef9 · Cited by 77
Yee, C., Dickson, K.-A., Muntasir, M. N., Ma, Y., & Marsh, D. J. (2022) · Frontiers in Bioengineering and Biotechnology · doi:10.3389/fbioe.2022.836984 · Cited by 66
Patient-derived tumor models: a more suitable tool for pre-clinical studies in colorectal cancer
Rizzo, G., Bertotti, A., Leto, S. M., & Vetrano, S. (2021) · Journal of Experimental & Clinical Cancer Research · doi:10.1186/s13046-021-01970-2 · Cited by 51
Boussaad, I., Cruciani, G., Bolognin, S., Antony, P., Dording, C. M., Kwon, Y.-J., Heutink, P., Fava, E., Schwamborn, J. C., & Krüger, R. (2021) · Scientific Reports · doi:10.1038/s41598-021-81129-3 · Cited by 42
Patient-Derived Tumor Organoid Rings for Histologic Characterization and High-Throughput Screening
Nguyen, H. T. L., & Soragni, A. (2020) · STAR Protocols · doi:10.1016/j.xpro.2020.100056 · Cited by 36
Self-citationDeveloping Liver Microphysiological Systems for Biomedical Applications
Wang, J., Wu, X., Zhao, J., Ren, H., & Zhao, Y. (2024) · Advanced Healthcare Materials · doi:10.1002/adhm.202302217 · Cited by 27
Drug screening at single-organoid resolution via bioprinting and interferometry
Tebon, P. J., Wang, B., Markowitz, A. L., Davarifar, A., Krawczuk, P., Murray, G., Nguyen, H. T. L., Tavanaie, N., Nguyen, T. L., Boutros, P. C., et al. (2021) · doi:10.1101/2021.10.03.462896 · Cited by 155
Self-citationSartini, S., & Soragni, A. (2021) · Cell Stem Cell · doi:10.1016/j.stem.2021.07.007 · Cited by 4
Self-citation
Metadata
- Authors
- Phan, N., Hong, J. J., Tofig, B., Mapua, M., Elashoff, D., Moatamed, N. A., Huang, J., Memarzadeh, S., Damoiseaux, R., & Soragni, A.
- Affiliations
- Vietnam National University Ho Chi Minh City (VN)
- University of California, Los Angeles (US)
- California NanoSystems Institute (US)
- Corresponding author
- Soragni, Alice
- ORCID
- Venue
- Communications Biology
- Published
- 2019-02-25
- Volume
- 2
- Issue
- 1
- Pages
- 78-78
- ISSN
- 2399-3642 (ISSN-L)
- PMC
- PMC6389967
- OpenAlex
- W2917438927
- Cited by
- 269
- References
- 49
- Citations by year
- 2026: 28 · 2025: 42 · 2024: 29 · 2023: 35 · 2022: 38 · 2021: 47 · 2020: 37 · 2019: 13
- FWCI
- 14.11
- Type
- journal article
- Language
- en
- Open access
- gold
- doi.org
- Locations
- Communications Biology (publishedVersion, cc-by)
- bioRxiv (Cold Spring Harbor Laboratory) (acceptedVersion)
- Europe PMC (PubMed Central) (publishedVersion, other-oa)
- PubMed Central (publishedVersion, cc-by)
- PubMed (publishedVersion)
- eScholarship (California Digital Library) (submittedVersion, cc-by)
- DOAJ (DOAJ: Directory of Open Access Journals) (submittedVersion)
- eScholarship (California Digital Library) (submittedVersion)
- Funders
- Worldwide Cancer Research (16-0253)
- Hirshberg Foundation for Pancreatic Cancer Research
- U.S. Department of Health & Human Services | NIH | National Center for Advancing Translational Sciences (UL1TR000124)
- American Association for Cancer Research (14-40-38-SORA)
- Topics
- Health Sciences › Medicine › Oncology › Cancer Cells and Metastasis
- Physical Sciences › Engineering › Biomedical Engineering › 3D Printing in Biomedical Research
- Health Sciences › Medicine › Oncology › Ovarian cancer diagnosis and treatment
- Keywords
- patient-derived tumor organoids, high-throughput drug screening, kinase inhibitors, drug sensitivity, personalized medicine, high-grade serous ovarian cancer, ovarian carcinosarcoma
- MeSH terms
- Cell Survival, Humans, Neoplasms, Organoids, Reproducibility of Results, Tissue Culture Techniques, Protein Kinase Inhibitors, Cell Proliferation, Precision Medicine, Tumor Microenvironment
About these checks
Registry, retraction, Cites and statistics results are computed, not judged, with one exception: a printed reference that no index lists is read once by a model before it counts as a citation error. Claims are extracted by a model and kept only when their quote appears verbatim in the text; each cited source is then checked, with a model’s help, for whether it says what the claim relies on. Those verdicts can be wrong — read the claim’s quote and the cited source before relying on one.
Statistics and arithmetic are recomputed, not judged.
Confidence bands are shown only for fields calibrated on our annotated test set. None is calibrated yet, so no band is shown.
What counts as a claim ›How we measure confidence ›How we check this ›
Are you an author, or do you see a problem with this page? Request a review
