

The DOI matches its Crossref record; 98 of the 99 references it cites were found in a registry or an index.
Human metabolome variation along the upper intestinal tract
Open accessPublished version of a preprint
Abstract
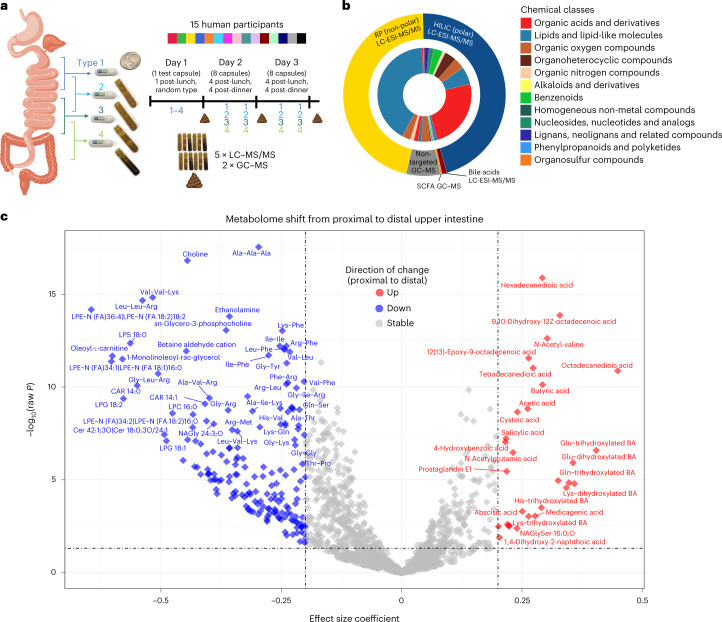
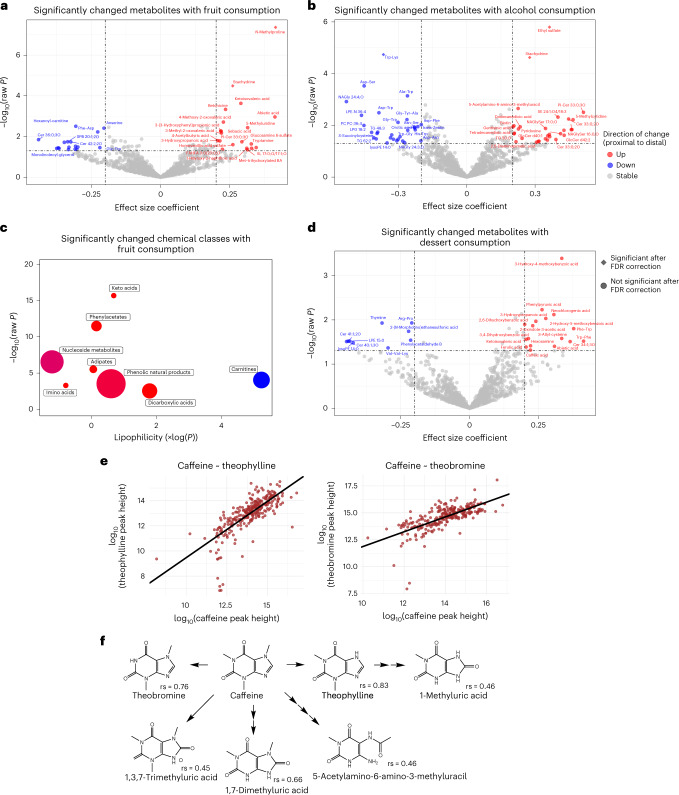
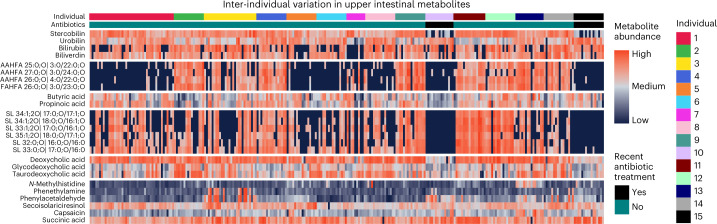
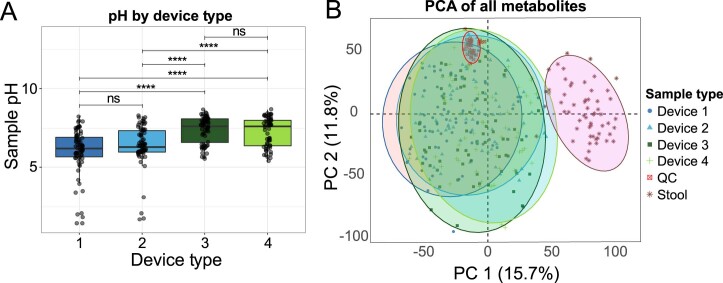
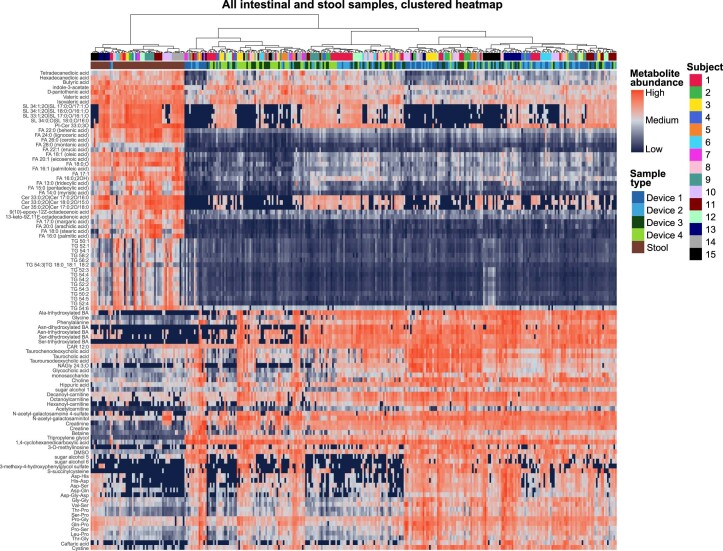
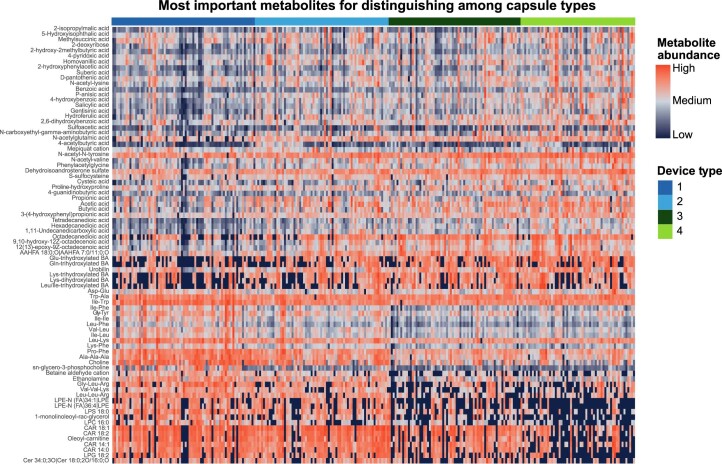
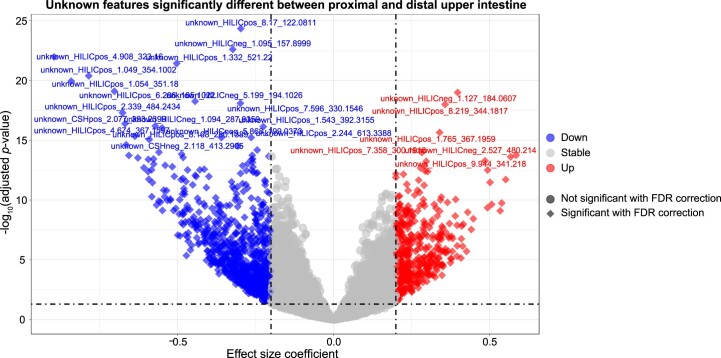
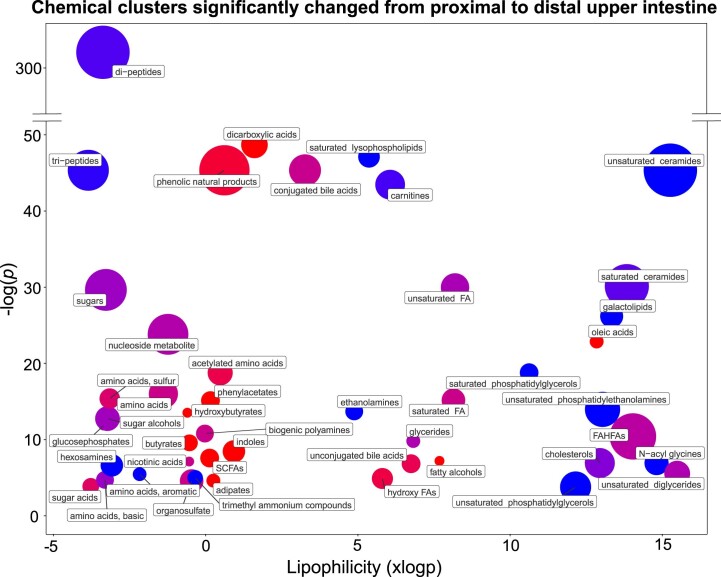
Most processing of the human diet occurs in the small intestine. Metabolites in the small intestine originate from host secretions, plus the ingested exposome 1 and microbial transformations. Here we probe the spatiotemporal variation of upper intestinal luminal contents during routine daily digestion in 15 healthy male and female participants. For this, we use a non-invasive, ingestible sampling device to collect and analyse 274 intestinal samples and 60 corresponding stool homogenates by combining five mass spectrometry assays 2,3 and 16S rRNA sequencing. We identify 1,909 metabolites, including sulfonolipids and fatty acid esters of hydroxy fatty acids (FAHFA) lipids. We observe that stool and intestinal metabolomes differ dramatically. Food metabolites display trends in dietary biomarkers, unexpected increases in dicarboxylic acids along the intestinal tract and a positive association between luminal keto acids and fruit intake. Diet-derived and microbially linked metabolites account for the largest inter-individual differences. Notably, two individuals who had taken antibiotics within 6 months before sampling show large variation in levels of bioactive FAHFAs and sulfonolipids and other microbially related metabolites. From inter-individual variation, we identify Blautia species as a candidate to be involved in FAHFA metabolism. In conclusion, non-invasive, in vivo sampling of the human small intestine and ascending colon under physiological conditions reveals links between diet, host and microbial metabolism.
Overview
The claims and statistics of this paper haven’t been checked yet.
Run the check — free, no account needed. It reads the open-access text and checks the sources it cites.
Integrity signals
Registry
Cites
Statistics
Figures
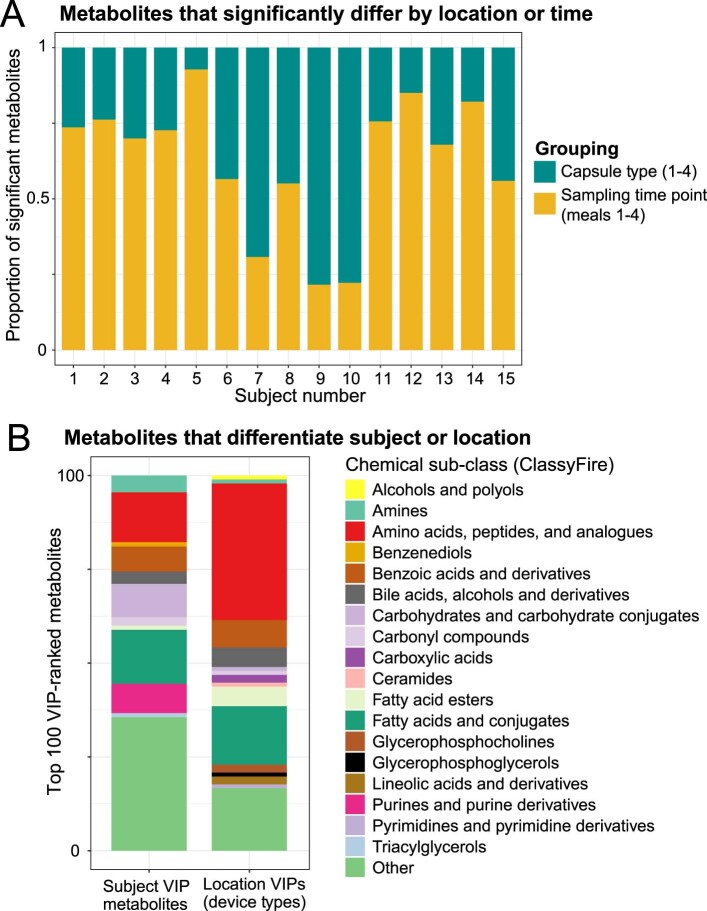
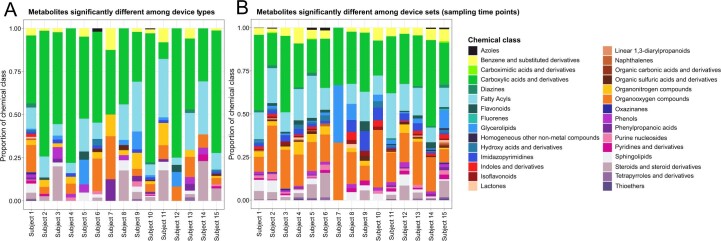
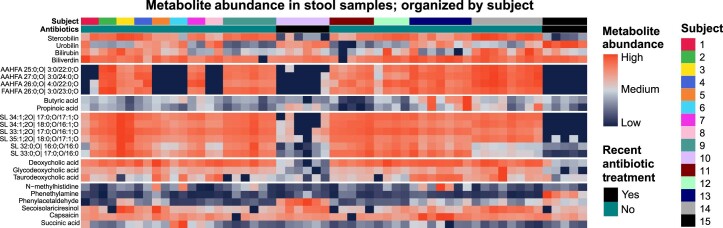
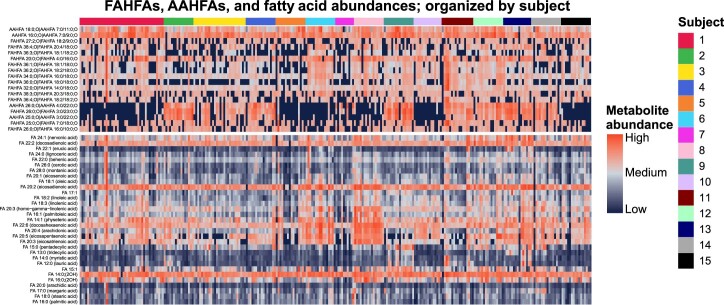
Verification
Claims the paper makes
The claims and statistics of this paper haven’t been checked yet.
Run the check — free, no account needed. It reads the open-access text and checks the sources it cites.
Claims other papers make about this one
Each is checked against this paper’s own text: does it say what the citing paper says it does?
In the citing paper
“Notably, the recent development of non-invasive, ingestible sampling devices has made it possible to collect luminal contents throughout the intestinal tract, potentially overcoming the limitations of stool samples in reflecting the regional variation of gut microbiota.354,753”
From Microbiota–gut–brain axis and its therapeutic applications in neurodegenerative diseases (2024) · cites this paper as [753]
Self-check
Percentages, sums and reported differences re-computed from the paper’s own numbers.
The self-check needs the paper’s full text.
Citations
Cites
Controlling the False Discovery Rate: A Practical and Powerful Approach to Multiple Testing
Benjamini, Y., & Hochberg, Y. (1995) · Journal of the Royal Statistical Society Series B: Statistical Methodology · doi:10.1111/j.2517-6161.1995.tb02031.x · Cited by 109,482
DADA2: High–resolution sample inference from Illumina amplicon data
Callahan, B. J., McMurdie, P. J., Rosen, M. J., Han, A. W., Johnson, A. J. A., & Holmes, S. P. (2016) · Nature Methods · doi:10.1038/nmeth.3869 · Cited by 35,698
The SILVA ribosomal RNA gene database project: improved data processing and web-based tools
Quast, C., Pruesse, E., Yilmaz, P., Gerken, J., Schweer, T., Yarza, P., Peplies, J., & Glöckner, F. O. (2012) · Nucleic Acids Research · doi:10.1093/nar/gks1219 · Cited by 33,055
U1 snRNP regulates cancer cell migration and invasion in vitro
Oh, J.-M., Venters, C. C., Di, C., Pinto, A. M., Wan, L., Younis, I., Cai, Z., Arai, C., So, B. R., Duan, J., et al. (2020) · Nature Communications · doi:10.1038/s41467-019-13993-7 · Cited by 7,157
Identifying Small Molecules via High Resolution Mass Spectrometry: Communicating Confidence
Schymanski, E. L., Jeon, J., Gulde, R., Fenner, K., Ruff, M., Singer, H. P., & Hollender, J. (2014) · Environmental Science & Technology · doi:10.1021/es5002105 · Cited by 4,519
Bile salt biotransformations by human intestinal bacteria
Ridlon, J. M., Kang, D.-J., & Hylemon, P. B. (2006) · Journal of Lipid Research · doi:10.1194/jlr.r500013-jlr200 · Cited by 2,829
Lipid extraction by methyl-tert-butyl ether for high-throughput lipidomics
Matyash, V., Liebisch, G., Kurzchalia, T. V., Shevchenko, A., & Schwudke, D. (2008) · Journal of Lipid Research · doi:10.1194/jlr.d700041-jlr200 · Cited by 2,633
Journal of the science of food and agriculture
(1962) · Journal of the Science of Food and Agriculture · doi:10.1002/jsfa.2740131302 · Cited by 2,424
Intestinal Short Chain Fatty Acids and their Link with Diet and Human Health
Ríos-Covián, D., Ruas‐Madiedo, P., Margollés, A., Gueimonde, M., Reyes‐Gavilán, C. G. D. L., & Salazar, N. (2016) · Frontiers in Microbiology · doi:10.3389/fmicb.2016.00185 · Cited by 2,300
Thévenot, E., Roux, A., Xu, Y., Ezan, É., & Junot, C. (2015) · Journal of Proteome Research · doi:10.1021/acs.jproteome.5b00354 · Cited by 1,802
Research works printed but not linked: 2
- Bhutia, Y. D. & Ganapathy, V. in Physiology of the Gastrointestinal Tract, Ch. 47 (Elsevier, 2018).
- Arnaud, M. J. in Caffeine, Coffee and Health (ed Garattini, S.) 43–95 (Raven Press, 1993).
Cited by
Sorted by citations
Items 101–143 of 143
Stachowska, E., Gudan, A., Mańkowska‐Wierzbicka, D., Liebe, R., & Krawczyk, M. J. (2024) · Internal and Emergency Medicine · doi:10.1007/s11739-024-03533-7 · Cited by 2
Jayaprakash, J., Gowda, D. V., Gangadhara, R. M., Jain, S., Yadav, H., Gowda, S. G. B., & Hui, S. (2025) · Rapid Communications in Mass Spectrometry · doi:10.1002/rcm.10032 · Cited by 2
Ke, T., Jiang, T., Li, H., Dong, X., & Khoo, H. E. (2025) · Nutrition Research · doi:10.1016/j.nutres.2025.10.004 · Cited by 2
Bron, A., Beltramo, C., Durif, C., Arora, T., Deschamps, C., Couturier, I., Domingo-Almenara, X., Otero, Y. F., Denis, S., de Wiele, T. V., et al. (2025) · Gut Microbes · doi:10.1080/19490976.2025.2579353 · Cited by 2
Spatial Multi-Omics Analysis of the Qianqiu Goat Gut Microbiome and Metabolome
Guo, P., Qin, W., Song, W., & Chen, H. (2025) · International Journal of Molecular Sciences · doi:10.3390/ijms262411815 · Cited by 2
Gangadhara, R. M., Parasuraman, P., Gowda, D., Yadav, H., Halade, G. V., Hui, S., & Gowda, S. G. B. (2026) · Analytica Chimica Acta · doi:10.1016/j.aca.2026.345435 · Cited by 2
Yu, L., Wu, N., Choi, O., & Nguyen, K. D. (2024) · Inflammation Research · doi:10.1007/s00011-024-01935-z · Cited by 2
Son, M., Laury, M. L., Stephenson, K. B., May, T. D., Hendrixson, D. T., Koroma, A. S., Ngegbai, A. S., Song, J. H., Naskidashvili, N., Goo, Y. A., et al. (2024) · American Journal of Clinical Nutrition · doi:10.1016/j.ajcnut.2024.09.018 · Cited by 2
Debédat, J., Pastor, L., Knotts, T. A., Pitman, J. G., Griffett, K., & Adams, S. H. (2025) · Journal of Lipid Research · doi:10.1016/j.jlr.2025.100896 · Cited by 2
Izquierdo-Sandoval, D., Duan, X. L., Fryganas, C., Portolés, T., Sancho, J. V., & Rubert, J. (2023) · bioRxiv (Cold Spring Harbor Laboratory) · doi:10.1101/2023.10.24.562654 · Cited by 3
Improved mouse models of the small intestine microbiota using region-specific sampling from humansPreprint
Culver, R. N., Spencer, S. P., Violette, A., Silva, E. G. L., Takeuchi, T., Nafarzadegan, C., Higginbottom, S. K., Shalon, D., Sonnenburg, J. L., & Huang, K. C. (2024) · bioRxiv (Cold Spring Harbor Laboratory) · doi:10.1101/2024.04.24.590999 · Cited by 3
Self-citationMammalian colonic contribution of amino acids to whole-body homeostasis
Kashyap, S., & Kurpad, A. V. (2024) · Current Opinion in Clinical Nutrition & Metabolic Care · doi:10.1097/mco.0000000000001082 · Cited by 1
Cassava Fiber Prevents High-Fat Diet-Induced Obesity in Mice Through Gut Microbiota Restructuring
Yang, Y., Lei, F., Liu, L., Chen, Y., Li, Q., Long, J., Zhang, Z., & Guo, A. (2025) · Foods · doi:10.3390/foods14234121 · Cited by 1
Gut microbiome modulation by cricket, pea, and whey protein using the SHIME in vitro simulator
Franciosa, I., Castelnuovo, G., Cantele, C., Cardenia, V., Bo, S., Ponzo, V., Goitre, I., Pontonio, E., Tortarolo, D., Verni, M., et al. (2026) · npj Science of Food · doi:10.1038/s41538-026-00785-9 · Cited by 2
The 3M roles of the gut microbiome in pharmacotherapy for diabetes: mediator, modifier, and marker
Seo, J. I., Koh, A., Lim, S. K., & Yoo, H. H. (2026) · Trends in Endocrinology and Metabolism · doi:10.1016/j.tem.2025.12.006 · Cited by 1
Spatially resolved architecture of the human gut microbiome and its health implications
Wang, S., Almeida, A., Mu, D., & Zeng, S. (2026) · The Lancet Microbe · doi:10.1016/j.lanmic.2026.101389 · Cited by 2
Comparison of fecal and plasma metabolite correlations following nutrition or exercise interventions
Ahmed, H., Kärkkäinen, O. K., Babu, A. F., Meuronen, T., Koistinen, V., Leclercq, S., Amadieu, C., Leyrolle, Q., Neyrinck, A. M., Rodriguez, J., et al. (2026) · Metabolomics · doi:10.1007/s11306-026-02463-z · Cited by 1
Moore, M. L., Ford, J., Schladweiler, M. C. J., Dye, J. A., Jackson, T. W., & Miller, C. N. (2024) · Metabolomics · doi:10.1007/s11306-024-02099-x · Cited by 2
Viñado, I. G., Bee, G., Trevisi, P., & Ollagnier, C. (2024) · Animal - Open Space · doi:10.1016/j.anopes.2024.100076 · Cited by 1
Sastry, S. C., Mitchell, S. B., Glick, A. A., Thorn, T. L., Lu, A., & Aydemir, T. B. (2026) · Current Developments in Nutrition · doi:10.1016/j.cdnut.2026.109103 · Cited by 1
Profiling the human luminal small intestinal microbiome using a novel ingestible medical devicePreprint
Tronel, A., Roger‐Margueritat, M., Plazy, C., Biennier, S., Craspay, A., Mohanty, I., Cools-Portier, S., Laiola, M., Roeselers, G., Mathieu, N., et al. (2025) · medRxiv · doi:10.1101/2025.04.18.25326056 · Cited by 1
Fyfe, I. (2023) · Nature Reviews Gastroenterology & Hepatology · doi:10.1038/s41575-023-00804-0
Leveraging chemical synthesis to discover metabolites from the gut microbiome
Keys, A. J., Nandwana, N. K., Alnasser, E., & Gentry, E. C. (2025) · Annals of the New York Academy of Sciences · doi:10.1111/nyas.70004
Damman, C. J. (2024) · The Conversation · doi:10.64628/aai.tn4cgxend
Combes, S., Knudsen, C., Rumeau, M., Pascal, G., Cauquil, L., Héliès, V., Ruesche, J., Poli, M., Jones, E., Lencina, C., et al. (2025) · Journal of Nutrition · doi:10.1016/j.tjnut.2025.10.013
Zhang, P., Tang, X., Akanyibah, F. A., Du, S., & Mao, F. (2025) · Laboratory Investigation · doi:10.1016/j.labinv.2025.104256 · Cited by 1
Perego, J., Mannella, V., Manuto, L., Valles‐Colomer, M., Asnicar, F., Piperni, E., García-Valiente, A., Bonanomi, M., Gaglio, D., Montini, F., et al. (2025) · bioRxiv (Cold Spring Harbor Laboratory) · doi:10.64898/2025.11.30.691404
Developmental plasticity enables an intestinal tapeworm to adapt to dietary stress
Jirků, M., Parker, W., Kadlecová, O., Moos, M., Wiśniewska, M. M., Kuchta, R., Tláskalová, P., Ilík, V., Tomčala, A., Pavlíčková, Z., et al. (2026) · Nature Communications · doi:10.1038/s41467-026-69475-0
Regional organization of nutrient absorption across the small intestine
Zwick, R. K., Sharpley, M., Rispal, J., Rabizadeh, S., Boffelli, D., & Klein, O. D. (2026) · Nature Reviews Gastroenterology & Hepatology · doi:10.1038/s41575-026-01225-5
Alanazi, A. (2026) · Journal of Clinical Laboratory Analysis · doi:10.1002/jcla.70307
Nguyen, T., Kim, D. W., Vo, A. T., Dat, L. H. B., Nguyen, T. T. N., Yu, S.-J., Nguyen, D. N., Kim, D. H., Lee, H., & Nguyen, L. P. (2026) · Journal of Pharmaceutical and Biomedical Analysis · doi:10.1016/j.jpba.2026.117687
Beyond stool: sampling context and inferential scope in gut mechanistic studies
Lewandowski, R. (2026) · Microbiology and Molecular Biology Reviews · doi:10.1128/mmbr.00212-26
Nguyen, T., Vo, A. T., Dat, L. H. B., Tran, H. M., Nguyen, H. T., & Nguyen, L. P. (2026) · Journal of Proteome Research · doi:10.1021/acs.jproteome.6c00383
From Diet to Dysbiosis: The Microbiome’s Relationship to Eosinophilic Esophagitis
Yoo, E., Schneider, Y., Bechtold, M. L., & Uchida, A. M. (2026) · Current Gastroenterology Reports · doi:10.1007/s11894-026-01058-x
Caetano, P. A., do Nascimento, T. C., da Silveira, M. V., Vieira, D. S., Silva, L. E. L. E., Schetinger, M. R. C., de Menezes, C. R., Wagner, R. C., Roca, M., Lopes, E. J., et al. (2026) · Life · doi:10.3390/life16091540
McDaniel, E., Schertler, M., Edillor, C. R., & Dutton, R. J. (2026) · bioRxiv (Cold Spring Harbor Laboratory) · doi:10.64898/2026.09.22.753573
Gao, X., Dong, Q., & Shin, A. (2026) · Frontiers in Nutrition · doi:10.3389/fnut.2026.1953842
Awuchi, C. G., Atoki, A. V., & Noreen, S. (2026) · Cogent Food & Agriculture · doi:10.1080/23311932.2026.2745202
Kumar, A. K. (2026) · Journal of Molecular Liquids · doi:10.1016/j.molliq.2026.129976
Suttikhana, I., & Ashaolu, T. J. (2026) · Food & Function · doi:10.1039/d6fo03963d
Sedentary behavior as a gut-brain metabolic state
Yu, Q., Zhang, Z., Tian, Z., Kuang, J., Corbin, K. D., Oberlin, L. E., Collins, A. M., Goodpaster, B. H., Erickson, K. I., Owen, N. G., et al. (2026) · Brain Behavior and Immunity · doi:10.1016/j.bbi.2026.107068
Capsule biopsy and targeted sampling techniques: current status and future perspectives
Wan, Y., Han, Z., Tian, Y., & Rong, L. (2026) · Mini-invasive Surgery · doi:10.20517/2574-1225.2026.36
Gut bacterial-derived beneficial proteins in intestinal disease
Zhou, S., Tian, Q., Ullah, S., Su, D., Geng, J., & Zhang, M. (2026) · Microbiological Research · doi:10.1016/j.micres.2026.128794
Metadata
- Authors
- Folz, J., Culver, R. N., Morales, J. M., Grembi, J., Triadafilopoulos, G., Relman, D. A., Huang, K. C., Shalon, D., & Fiehn, O.
- Affiliations
- University of California, Davis (US)
- Stanford Medicine (US)
- VA Palo Alto Health Care System (US)
- Chan Zuckerberg Biohub San Francisco (US)
- Corresponding author
- Fiehn, Oliver
- ORCID
- Venue
- Nature Metabolism
- Published
- 2023-05-10
- Volume
- 5
- Issue
- 5
- Pages
- 777-788
- ISSN
- 2522-5812 (ISSN-L)
- PMC
- PMC10229427
- OpenAlex
- W4376132993
- Cited by
- 143
- References
- 99
- Citations by year
- 2026: 27 · 2025: 52 · 2024: 47 · 2023: 17
- FWCI
- 12.74
- Type
- journal article
- Language
- en
- Open access
- hybrid
- doi.org
- Locations
- Nature Metabolism (publishedVersion, cc-by)
- Research Square (acceptedVersion, cc-by)
- PubMed Central (publishedVersion, cc-by)
- PubMed (publishedVersion)
- eScholarship (California Digital Library) (submittedVersion, cc-by)
- Funders
- National Science Foundation (1936687)
- U.S. Department of Health & Human Services | National Institutes of Health (R01 AT010216, U19 AG023122)
- U.S. Department of Agriculture (2021-67017-35783)
- Topics
- Life Sciences › Biochemistry, Genetics and Molecular Biology › Molecular Biology › Metabolomics and Mass Spectrometry Studies
- Life Sciences › Biochemistry, Genetics and Molecular Biology › Molecular Biology › Gut microbiota and health
- Life Sciences › Biochemistry, Genetics and Molecular Biology › Genetics › Nutrition, Genetics, and Disease
- Keywords
- human metabolome, small intestine, hydroxy fatty acid ester, dietary biomarkers, dicarboxylic acids, keto acids, fruit consumption, antibiotic exposure, Blautia, gut microbiota, interindividual variability, exposome, host-microbe interactions
- MeSH terms
- Fatty Acids, Feces, Female, Humans, Intestine, Small, Male, RNA, Ribosomal, 16S, Metabolome
About these checks
Registry, retraction, Cites and statistics results are computed, not judged, with one exception: a printed reference that no index lists is read once by a model before it counts as a citation error. Claims are extracted by a model and kept only when their quote appears verbatim in the text; each cited source is then checked, with a model’s help, for whether it says what the claim relies on. Those verdicts can be wrong — read the claim’s quote and the cited source before relying on one.
Statistics and arithmetic are recomputed, not judged.
Confidence bands are shown only for fields calibrated on our annotated test set. None is calibrated yet, so no band is shown.
What counts as a claim ›How we measure confidence ›How we check this ›
Are you an author, or do you see a problem with this page? Request a review
