

The DOI matches its Crossref record; 89 of the 89 references it cites were found in a registry or an index.
Nonlinear dynamics of multi-omics profiles during human aging
Open accessAbstract
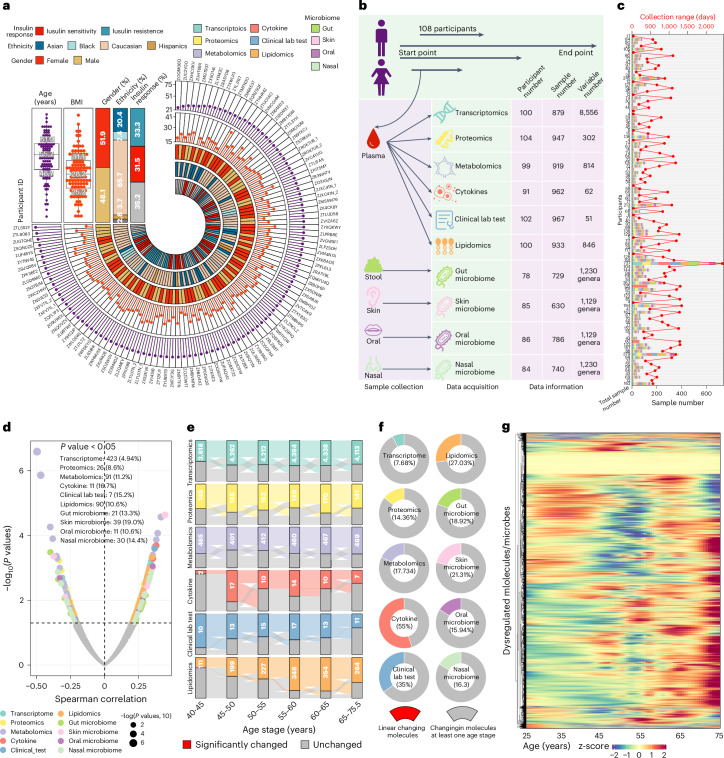
Aging is a complex process associated with nearly all diseases. Understanding the molecular changes underlying aging and identifying therapeutic targets for aging-related diseases are crucial for increasing healthspan. Although many studies have explored linear changes during aging, the prevalence of aging-related diseases and mortality risk accelerates after specific time points, indicating the importance of studying nonlinear molecular changes. In this study, we performed comprehensive multi-omics profiling on a longitudinal human cohort of 108 participants, aged between 25 years and 75 years. The participants resided in California, United States, and were tracked for a median period of 1.7 years, with a maximum follow-up duration of 6.8 years. The analysis revealed consistent nonlinear patterns in molecular markers of aging, with substantial dysregulation occurring at two major periods occurring at approximately 44 years and 60 years of chronological age. Distinct molecules and functional pathways associated with these periods were also identified, such as immune regulation and carbohydrate metabolism that shifted during the 60-year transition and cardiovascular disease, lipid and alcohol metabolism changes at the 40-year transition. Overall, this research demonstrates that functions and risks of aging-related diseases change nonlinearly across the human lifespan and provides insights into the molecular and biological pathways involved in these changes.
Overview
The claims and statistics of this paper haven’t been checked yet.
Run the check — free, no account needed. It reads the open-access text and checks the sources it cites.
Integrity signals
Registry
Cites
Statistics
Figures


Verification
Claims the paper makes
The claims and statistics of this paper haven’t been checked yet.
Run the check — free, no account needed. It reads the open-access text and checks the sources it cites.
Claims other papers make about this one
Each is checked against this paper’s own text: does it say what the citing paper says it does?
The source backs part of the claim, not all of it — or backs it for a different population, condition or comparison.
In the citing paper
“This gradual aging-related reduction in SM mass (trending towards a state of sarcopenia) contributes towards an overall decline in SM strength, function, and regenerative capacity, and is a key contributor to aging-related frailty with important implications for global health and economics [29,30,31,32].”
From Optimised Skeletal Muscle Mass as a Key Strategy for Obesity Management (2025) · cites this paper as [30]
Experimental — accuracy not yet measuredIn the citing paper
“Recent investigations propose that ageing constitutes a nonlinear dynamic procedure demarcated by heterogeneity among diverse organs and systems.86,202”
From Antiageing strategy for neurodegenerative diseases: from mechanisms to clinical advances (2025) · cites this paper as [86]
Self-check
Percentages, sums and reported differences re-computed from the paper’s own numbers.
The self-check needs the paper’s full text.
Citations
Cites
Finding and evaluating community structure in networks
Newman, M. E. J., & Girvan, M. (2004) · Physical Review E · doi:10.1103/physreve.69.026113 · Cited by 13,931
clusterProfiler 4.0: A universal enrichment tool for interpreting omics data
(2021) · doi:10.1016/j.xinn.2021.100141 · Cited by 12,455
Poewe, W., Seppi, K., Tanner, C. M., Halliday, G. M., Brundin, P., Volkmann, J., Schrag, A.-E., & Lang, A. E. (2017) · Nature Reviews Disease Primers · doi:10.1038/nrdp.2017.13 · Cited by 5,415
Oxidative stress, aging, and diseases
Liguori, I., Russo, G., Curcio, F., Bulli, G., Aran, L., Della-Morte, D., Gargiulo, G., Testa, G., Cacciatore, F., Bonaduce, D., et al. (2018) · Clinical Interventions in Aging · doi:10.2147/cia.s158513 · Cited by 3,979
Ageing as a risk factor for neurodegenerative disease
Hou, Y., Dan, X., Babbar, M., Wei, Y., Hasselbalch, S. G., Croteau, D. L., & Bohr, V. A. (2019) · Nature Reviews Neurology · doi:10.1038/s41582-019-0244-7 · Cited by 3,310
Regulation of cellular metabolism by protein lysine acetylation
Zhao, S., Xu, W., Jiang, W., Yu, W., Lin, Y., Zhang, T., Yao, J., Zhou, L., Zeng, Y., Li, H., et al. (2010) · Science · doi:10.1126/science.1179689 · Cited by 1,910
Aptamer-Based Multiplexed Proteomic Technology for Biomarker Discovery
Gold, L., Ayers, D., Bertino, J., Bock, C., Bock, A., Brody, E. N., Carter, J., Dalby, A. B., Eaton, B. E., Fitzwater, T., et al. (2010) · PLoS ONE · doi:10.1371/journal.pone.0015004 · Cited by 1,754
Dietary fats and cardiovascular disease: a presidential advisory from the American Heart Association
Sacks, F. M., Lichtenstein, A. H., Wu, J. H. Y., Appel, L. J., Creager, M. A., Kris-Etherton, P. M., Miller, M., Rimm, E. B., Rudel, L. L., Robinson, J. G., et al. (2017) · Circulation · doi:10.1161/cir.0000000000000510 · Cited by 1,386
Alzheimer's Disease and Parkinson's Disease
Nussbaum, R. L., & Ellis, C. E. (2003) · New England Journal of Medicine · doi:10.1056/nejm2003ra020003 · Cited by 1,351
Personal omics profiling reveals dynamic molecular and medical phenotypes
Chen, R., Mias, G. I., Li-Pook-Than, J., Jiang, L., Lam, H. Y. K., Chen, R., Miriami, E., Karczewski, K. J., Hariharan, M., Dewey, F. E., et al. (2012) · Cell · doi:10.1016/j.cell.2012.02.009 · Cited by 1,291
Self-citation
Cited by
Antiageing strategy for neurodegenerative diseases: from mechanisms to clinical advances
Jiang, Q., Liu, J., Huang, S., Wang, X.-Y., Chen, X., Liu, G.-H., Ye, K., Song, W., Masters, C. L., Wang, J., et al. (2025) · Signal Transduction and Targeted Therapy · doi:10.1038/s41392-025-02145-7 · Cited by 165
A panoramic view of cell population dynamics in mammalian aging
Zhang, Z., Schaefer, C., Jiang, W., Lu, Z., Lee, J., Sziraki, A., Abdulraouf, A., Wick, B., Haeussler, M., Li, Z., et al. (2025) · Science · doi:10.1126/science.adn3949 · Cited by 95
Self-citationOptimised Skeletal Muscle Mass as a Key Strategy for Obesity Management
Barber, T. M., Kabisch, S., Pfeiffer, A. F. H., & Weickert, M. O. (2025) · Metabolites · doi:10.3390/metabo15020085 · Cited by 19
Metadata
- Authors
- Shen, X., Wang, C., Zhou, X., Zhou, W., Hornburg, D., Wu, S., & Snyder, M. P.
- Affiliations
- Nanyang Technological University (SG)
- Howard Hughes Medical Institute (US)
- Stanford Medicine (US)
- Corresponding author
- Snyder, Michael P.
- Venue
- Nature Aging
- Published
- 2024-08-14
- Volume
- 4
- Issue
- 11
- Pages
- 1619-1634
- ISSN
- 2662-8465 (ISSN-L)
- PMC
- PMC11564093
- OpenAlex
- W4401585036
- Cited by
- 500
- References
- 89
- Citations by year
- 2026: 237 · 2025: 230 · 2024: 32
- FWCI
- 60.20
- Type
- journal article
- Language
- en
- Open access
- hybrid
- doi.org
- Licence
- cc-by
- creativecommons.org/licenses/by/4.0 (tdm)
- creativecommons.org/licenses/by/4.0 (vor)
- Locations
- Nature Aging (publishedVersion, cc-by)
- PubMed Central (publishedVersion, cc-by)
- PubMed (publishedVersion)
- DR-NTU (Nanyang Technological University) (submittedVersion)
- Funders
- National Institutes of Health (UL1TR001085, 1s10od020141-01)
- National Human Genome Research Institute (R01HG008164)
- National Institute of Diabetes and Digestive and Kidney Diseases (R01DK110186, U54DK102556, P30DK116074)
- National Center for Advancing Translational Sciences
- Topics
- Life Sciences › Biochemistry, Genetics and Molecular Biology › Aging › Genetics, Aging, and Longevity in Model Organisms
- Life Sciences › Biochemistry, Genetics and Molecular Biology › Molecular Biology › Bioinformatics and Genomic Networks
- Life Sciences › Biochemistry, Genetics and Molecular Biology › Molecular Biology › Single-cell and spatial transcriptomics
- Keywords
- human aging, multi-omics profiling, age-related diseases, healthspan, immune regulation, carbohydrate metabolism, cardiovascular disease, lipid metabolism, alcohol metabolism, longitudinal cohort
- MeSH terms
- Multiomics, Adult, Aged, Aging, California, Female, Humans, Longitudinal Studies, Male, Middle Aged, Nonlinear Dynamics, Proteomics, Metabolomics
About these checks
Registry, retraction, Cites and statistics results are computed, not judged, with one exception: a printed reference that no index lists is read once by a model before it counts as a citation error. Claims are extracted by a model and kept only when their quote appears verbatim in the text; each cited source is then checked, with a model’s help, for whether it says what the claim relies on. Those verdicts can be wrong — read the claim’s quote and the cited source before relying on one.
Statistics and arithmetic are recomputed, not judged.
Confidence bands are shown only for fields calibrated on our annotated test set. None is calibrated yet, so no band is shown.
What counts as a claim ›How we measure confidence ›How we check this ›
Are you an author, or do you see a problem with this page? Request a review
How to cite
Cite CoChat for the checks on this page, and the paper for its own findings.
- This page
- CoChat. (2026). Citation check: Nonlinear dynamics of multi-omics profiles during human aging. https://app.cochat.ai/papers/10.1038/s43587-024-00692-2
- The paper
- Shen, X., Wang, C., Zhou, X., Zhou, W., Hornburg, D., Wu, S., & Snyder, M. P. (2024). Nonlinear dynamics of multi-omics profiles during human aging. Nature Aging. https://doi.org/10.1038/s43587-024-00692-2
Data sources
Bibliographic data: Semantic Scholar, OpenAlex, Crossref.
Contains information from the Semantic Scholar Academic Graph Datasets, made available under the ODC Attribution License (ODC-BY 1.0).
Semantic Scholar’s data is described in: Kinney, R., et al. (2023). The Semantic Scholar Open Data Platform. arXiv:2301.10140.
